ColorAnt | Evaluate

Evaluate - Proof Evaluation

Evaluation of Proof Measurement Data

Evaluate – Proof Evaluation

The Evaluate tool can be used to check whether the proof measurement data from a media wedge fulfills the requirements for a contract proof according to ISO 12647-7 or a validation print according to ISO 12647-8.

In addition, a PSD evaluation can be performed using two different evaluation methods: “Side-by-Side” or “Media Relative”.

Moreover, the Evaluation Method G7 gray balance allows the measurement data to be checked for G7® conformity.

Finally, a fully detailed report can be created with a pass/fail indicator.

Notes

  • The Proof Evaluate tool supports all color spaces including Multicolor and spot colors. It is a powerful addition to ZePrA’s proofing feature, as it allows you to use the reference files of the dynamic media wedges created by ZePrA for proof evaluation.
  • For redundant measurement values, the median is determined and all duplicates (i.e., all patches with identical DCS values) are removed before evaluation.
    This procedure prevents duplicates as well as outliers from unjustifiably influencing the proof evaluations.
  • The Evaluate tool supports all color spaces as either reference data or reference ICC profile. In addition, it checks whether the selected wedge is actually suitable for evaluation and displays a corresponding message.
  • The Evaluate tool is available from ColorAnt L.

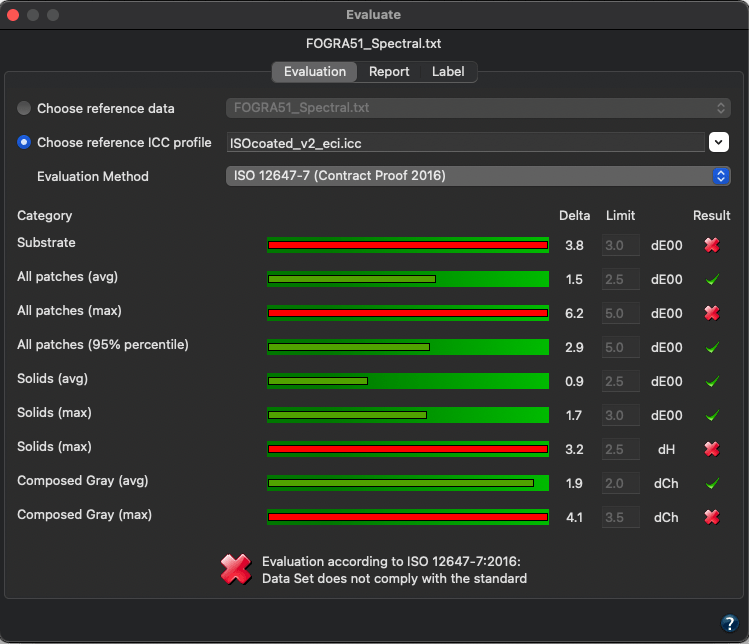
The Evaluation tab immediately shows the categories related to the chosen standard, the deltas to the reference, and a score with either a ✓ (passed) or an ✕(failed).

An overall score indicates if the proof has passed or failed.

There are two ways of selecting your reference:  

  • Choose reference data: This drop-down menu contains all data loaded under Data Sets that fit the selected proof measurement data as a reference, which means the number of patches and the color space must match. Select the reference that you want to compare with the selected media wedge measurement data. If dynamic media wedges were used in ZePrA, the corresponding reference data can be used for the proof evaluation in ColorAnt.

    Using reference data from ZePrA:
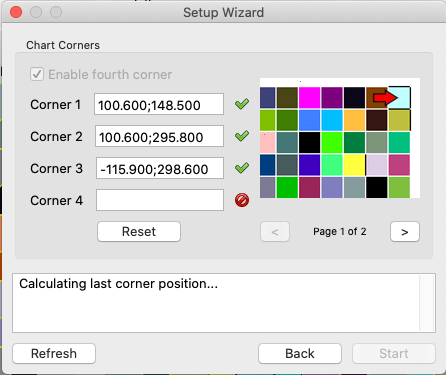
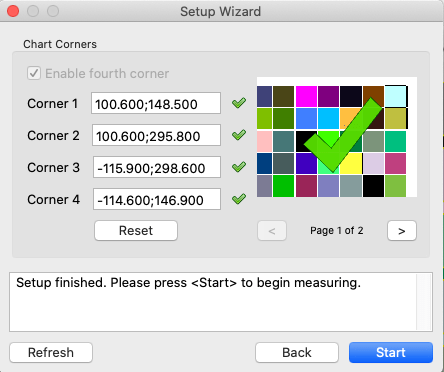
    1. Open the reference file of the ZePrA configuration in ColorAnt. It is located in ZePrA’s Report folder of the corresponding queue.
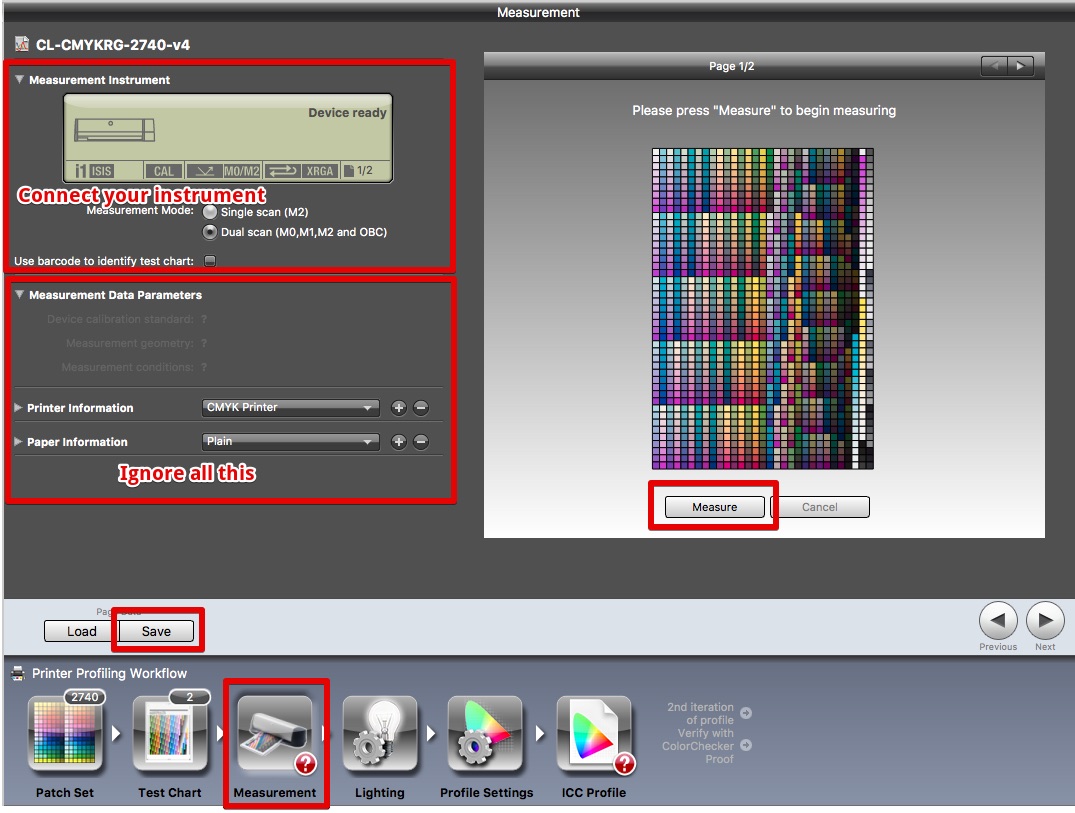
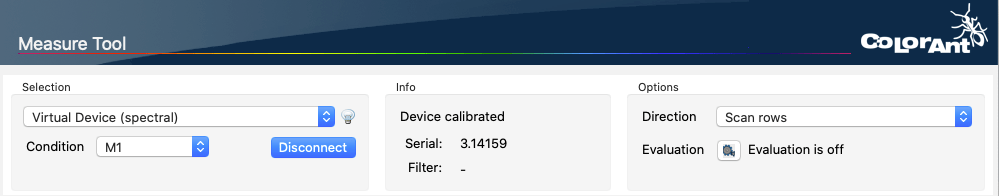
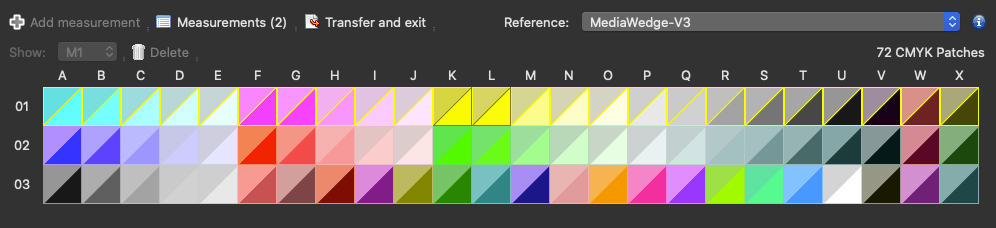
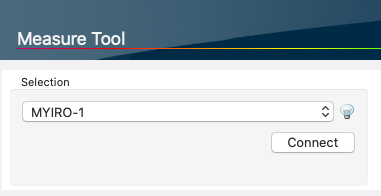
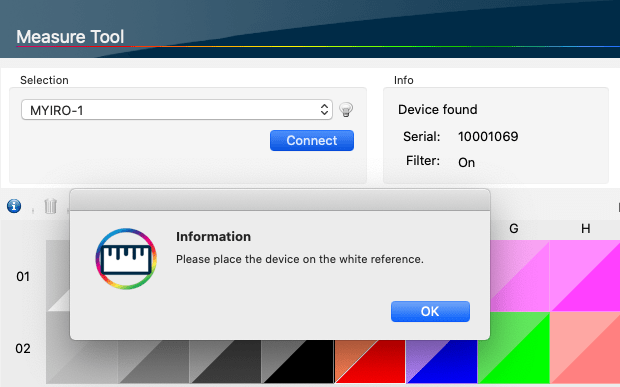
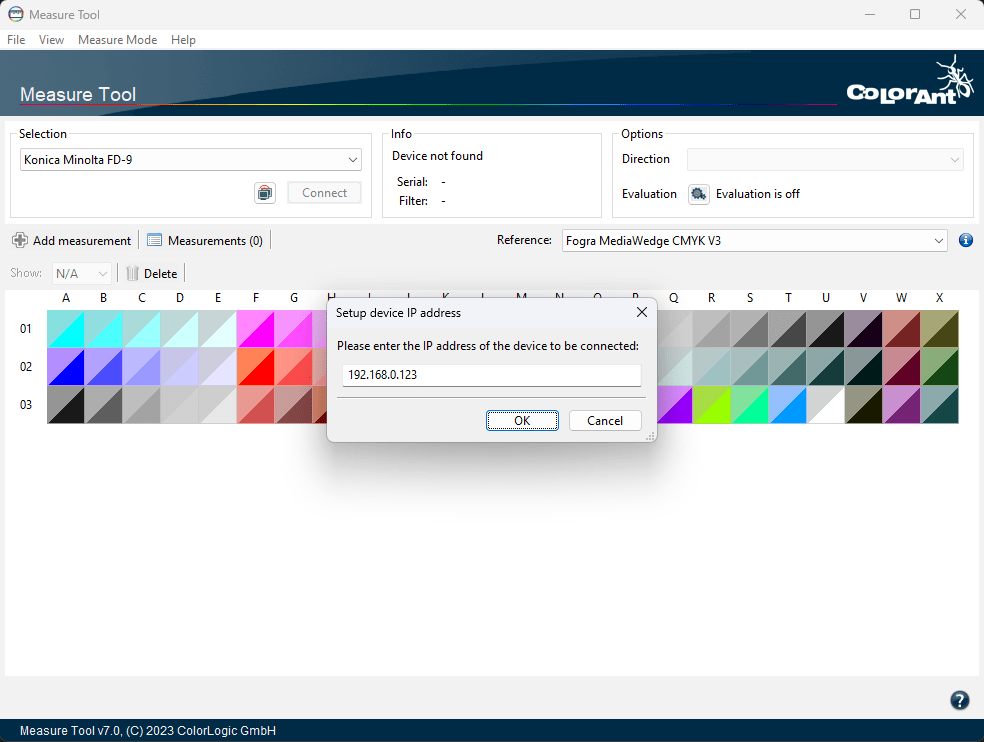
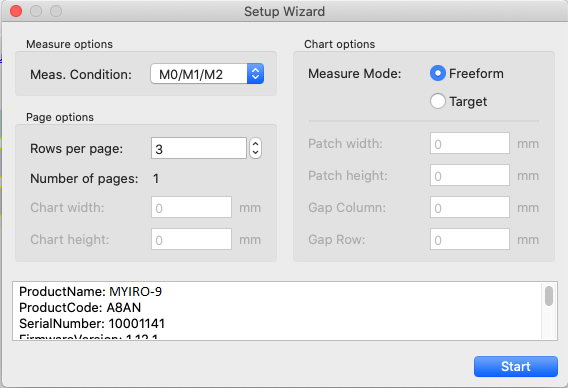
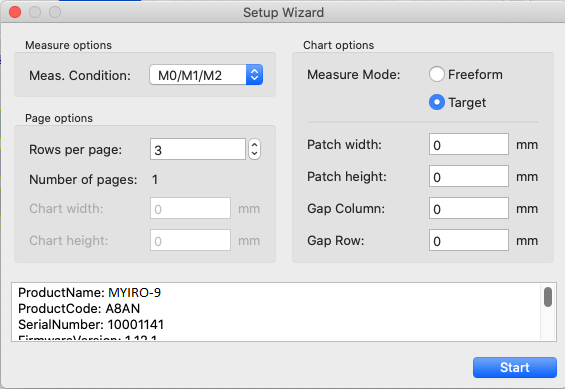
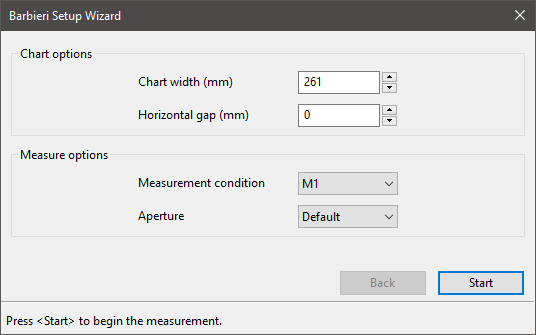
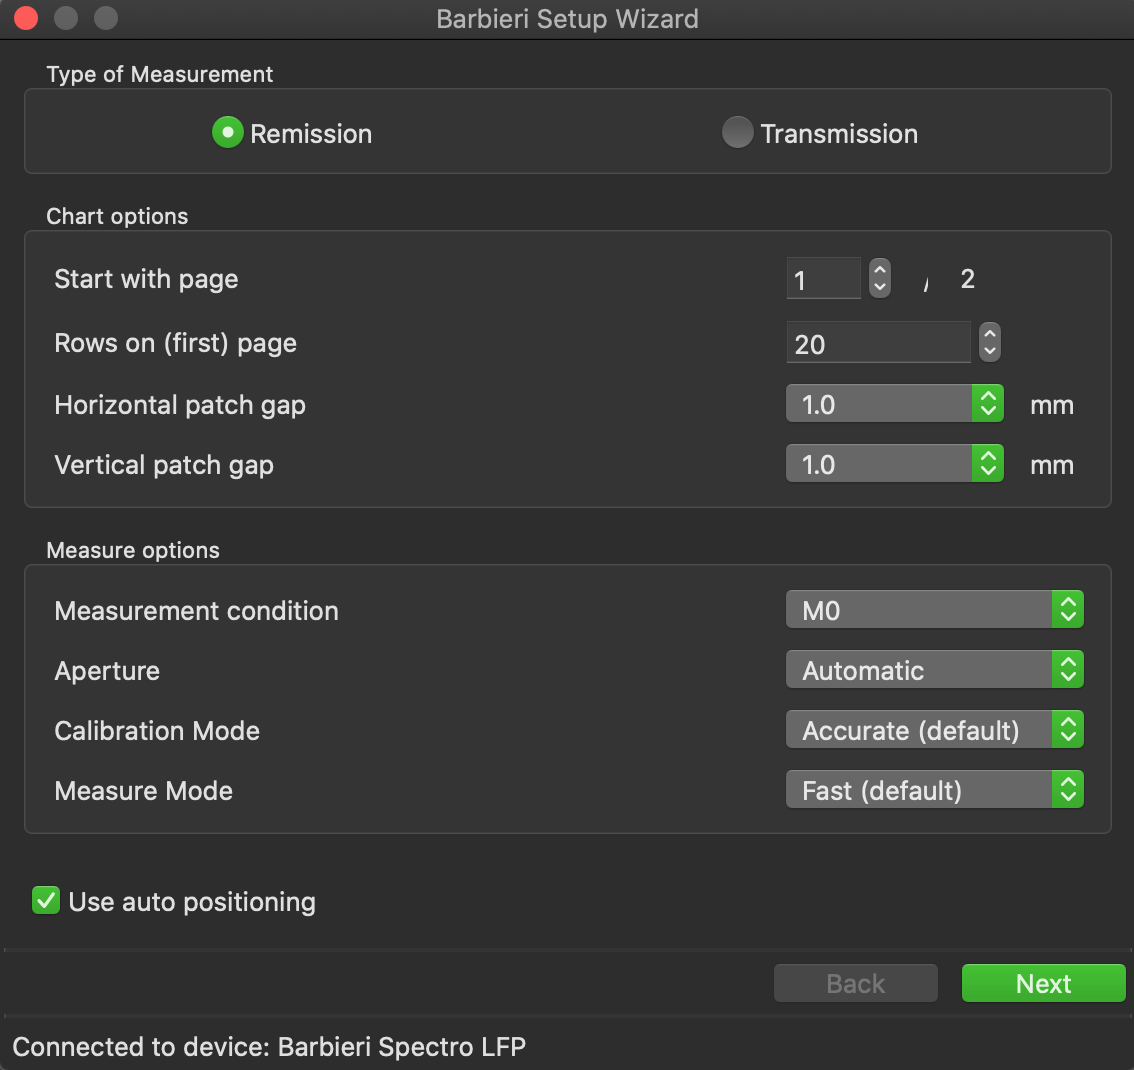
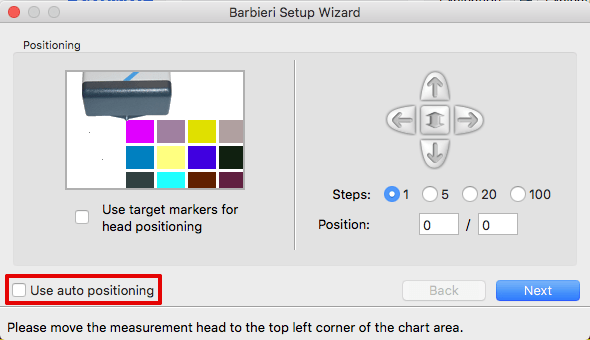
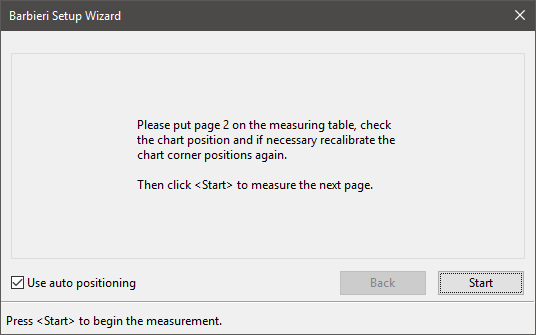
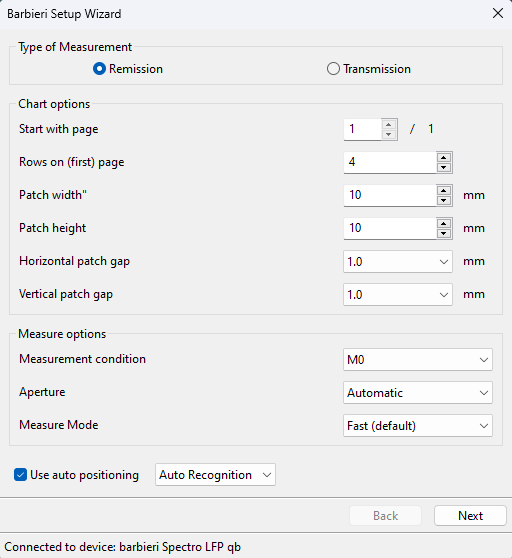
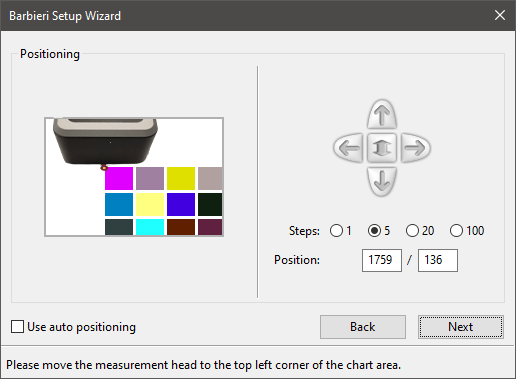
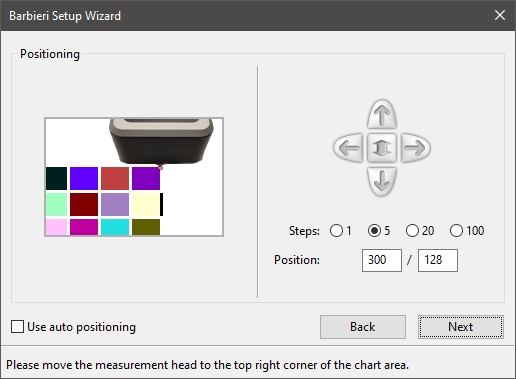
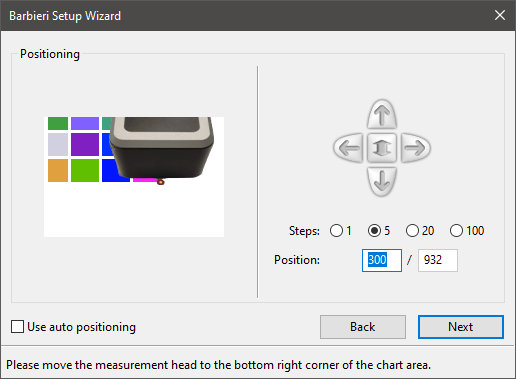
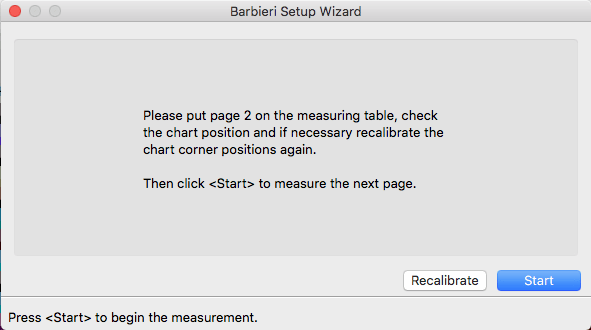
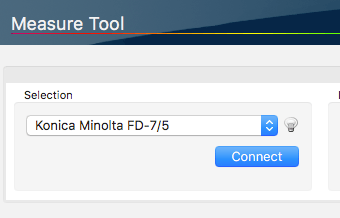
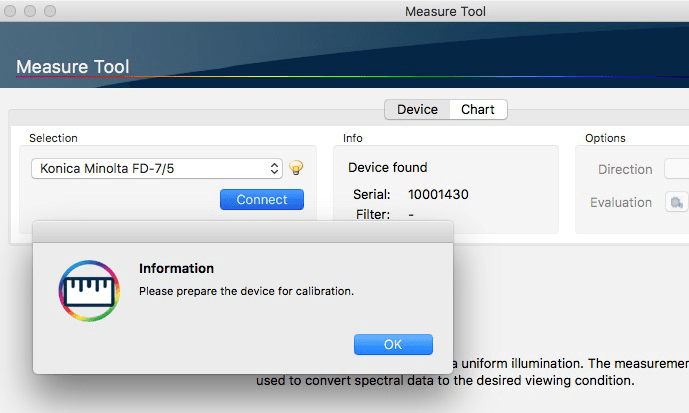
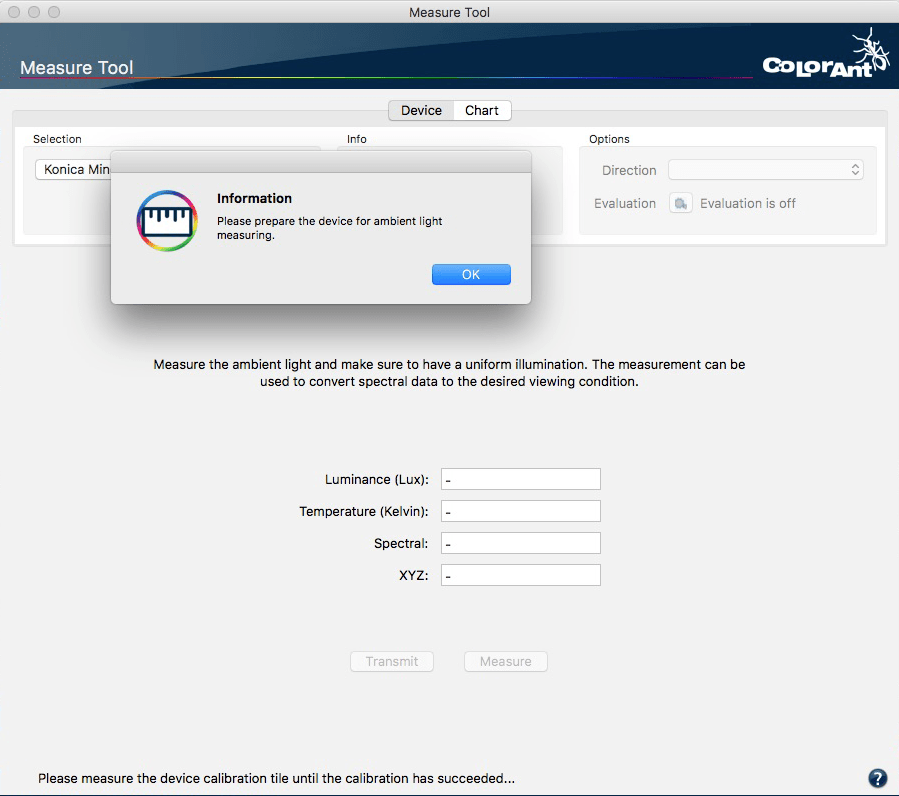
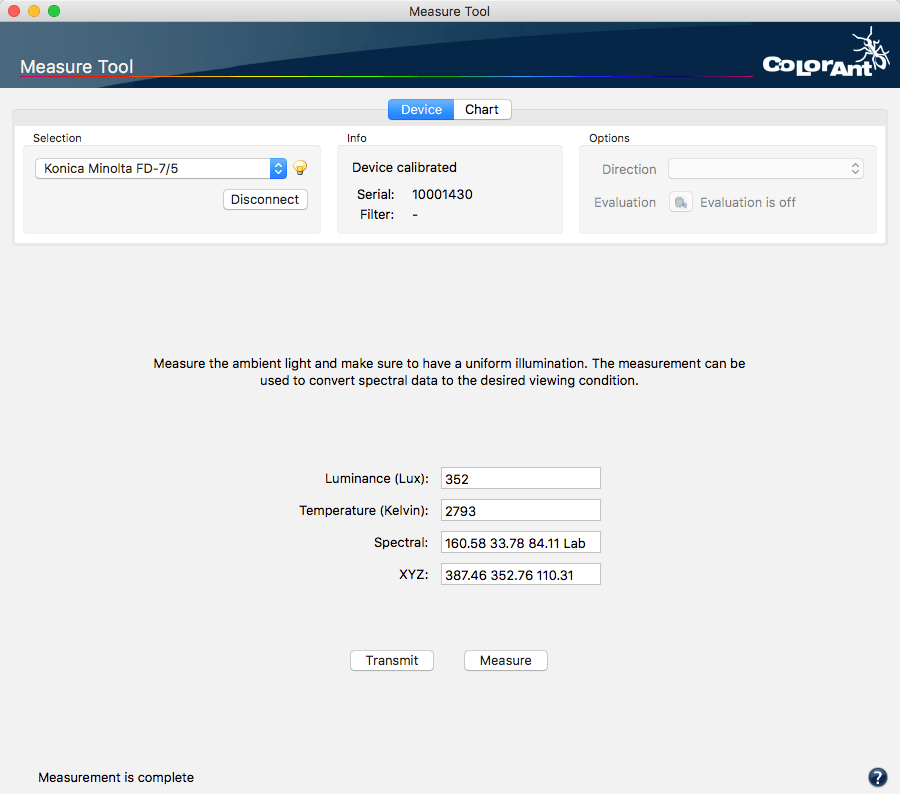
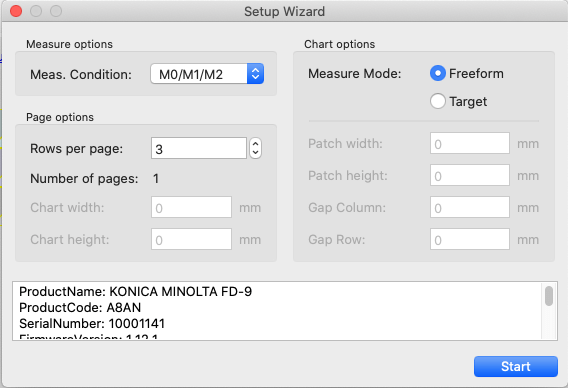
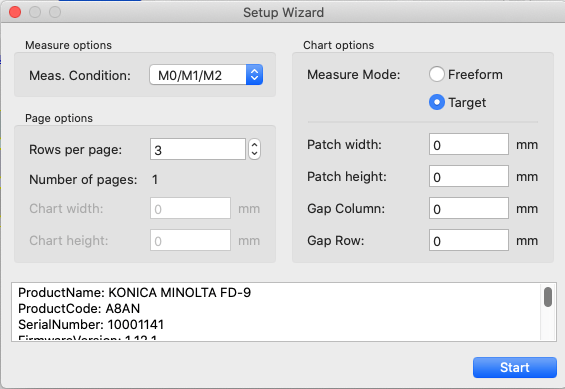
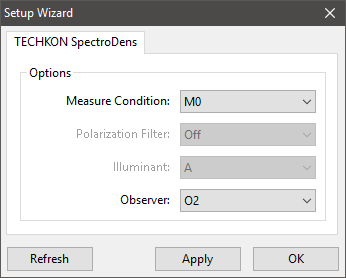
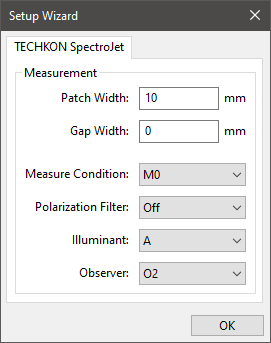
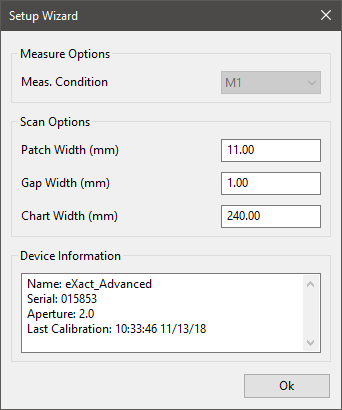
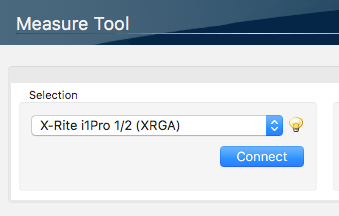
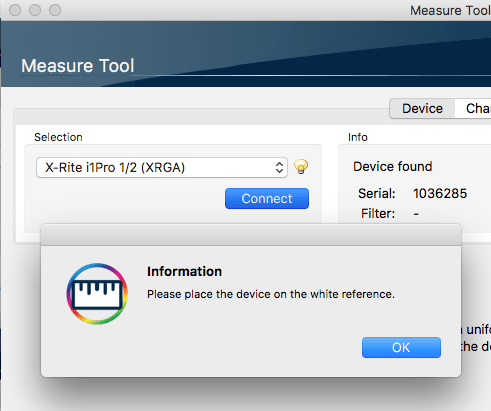
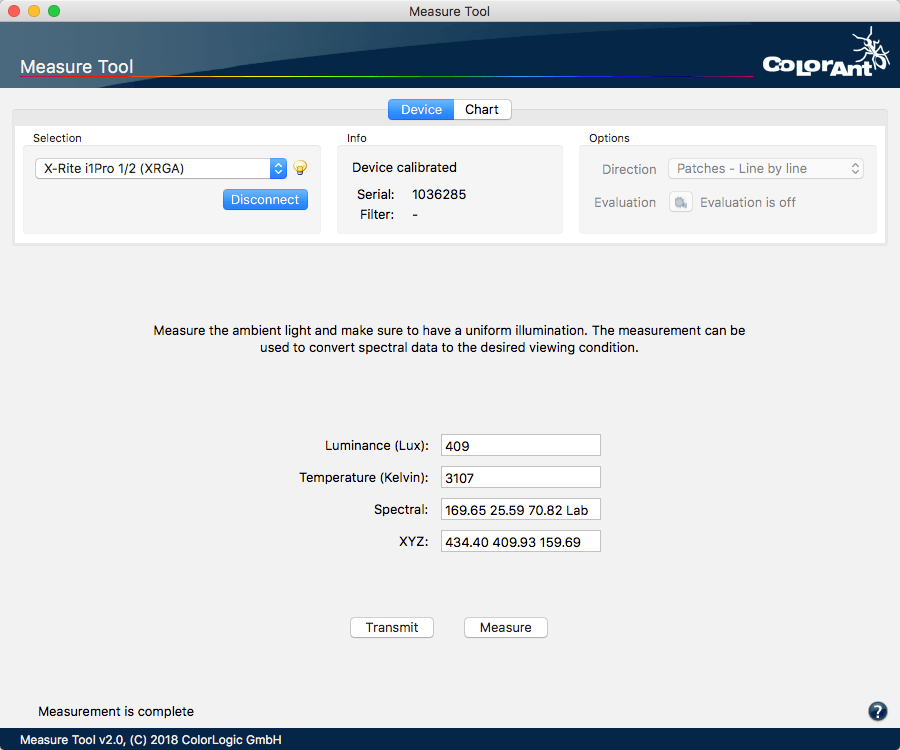
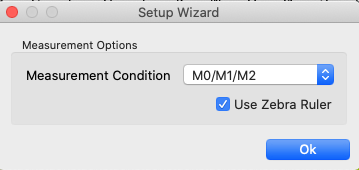
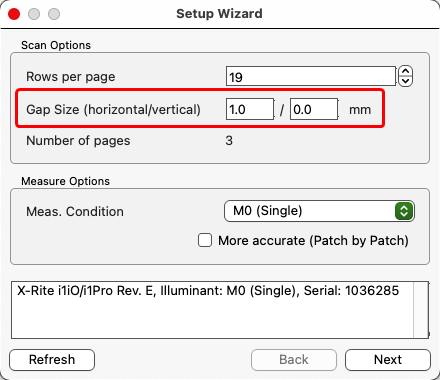
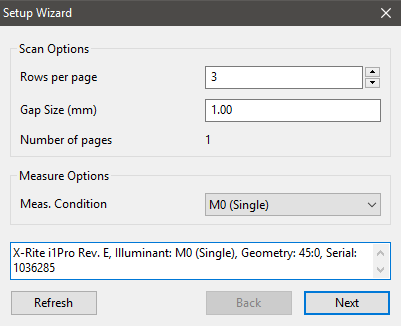
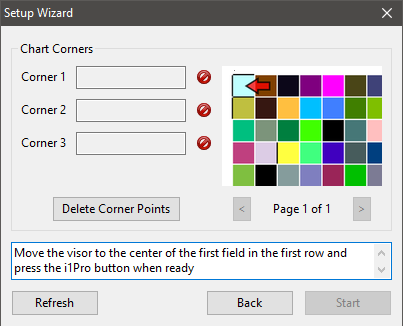
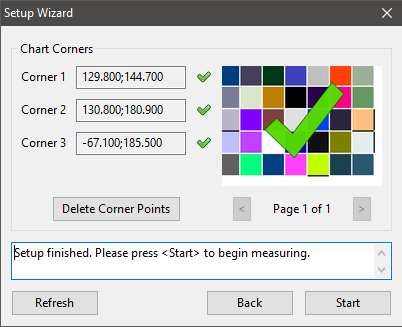
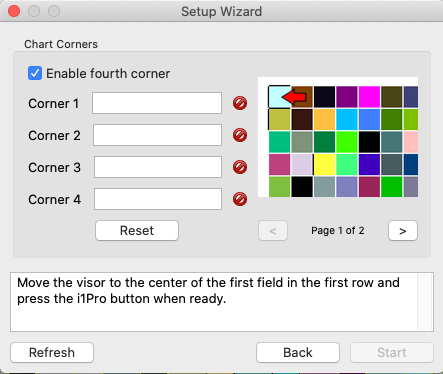
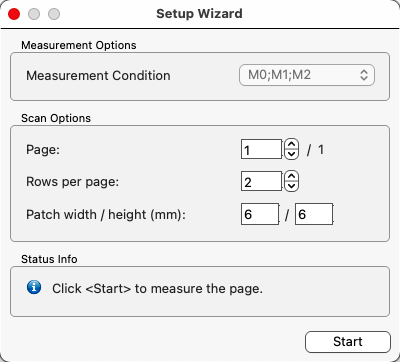
    2. Select Measure to measure the media wedge in the proof printout
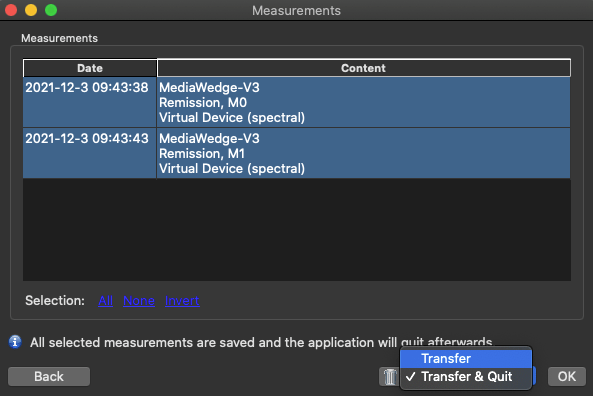
    3. Open the resulting measurement file and click the Evaluate button.
    4. Select the original reference file from ZePrA under Choose reference data in the Proof Evaluation window.
  • Choose reference ICC profile: This drop-down menu contains all ICC profiles that fit the selected proof measurement data as reference in terms of the same color space. Choose the reference ICC profile that you want to compare with the selected media wedge measurement data.
    Note: The ICC profile is used to create virtual reference values (absolute colorimetric). Depending on the accuracy of the ICC profile, the quality of the reference data can vary from very exact (e.g., CMYK profiles created by CoPrA) to less exact (e.g., small Multicolor profiles).  

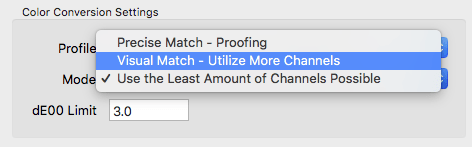
Evaluation method: Select a method to either evaluate a Contract Proof according to the ISO 12647-7 standard, a Validation Print according to the ISO 12647-8 standard, to evaluate your data according to Fogra’s PSD standard (ProcessStandard Digital), or to check the measurement data for G7® conformity. The PSD standard is based on the tolerances defined by Fogra and provides guidelines to increase process stability in digital printing. Further information can be found on the Fogra website.

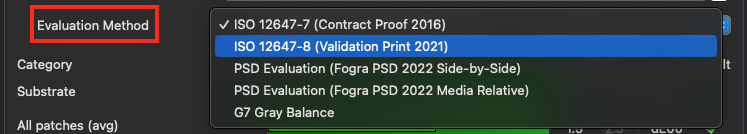
ISO 12647-7 (Contract Proof 2016): For the evaluation of a binding contract proof use this method. 

ISO 12647-8 (Validation Print 2021): Checks the conformance of printing systems that produce a hard-copy validation print, directly from digital data, which is intended to simulate the expected appearance of material printed per a characterized printing condition. The method considers the latest tolerances published in 2021.

G7 gray balance: This method checks the measurement data for G7® conformity to ensure accurate and consistent color reproduction. G7® is an internationally recognized method for calibrating printing presses and proofing systems.

Notes

  • Recently, other visualizations of the final printed product have found a place in the printing/proofing workflow because designers and print buyers prefer not to go to the expense of using an ISO 12647-7 compliant contract proof any earlier in the process than necessary. In many situations, participants in the workflow require a hardcopy visual reference of lesser quality than a contract proof. In the past, those prints varied widely in quality and were often referred to as design proofs, concept proofs, layout prints, etc. That quality level is here being referred to as a validation print.
  • The All Patches ratings do not include Boundary Patches for wedge evaluations.
  • Wedge evaluation: For small charts with less than 150 patches, such as Media Wedges, all Boundary Patches are omitted.
  • Chart evaluation: For larger charts with more than 150 patches, such as the IT-8, the Boundary Patches are taken into account.

PSD Evaluation

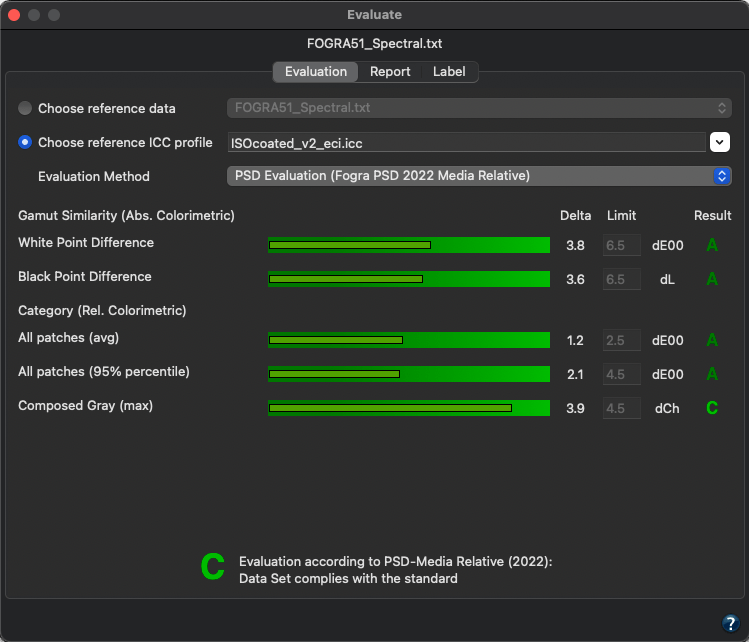
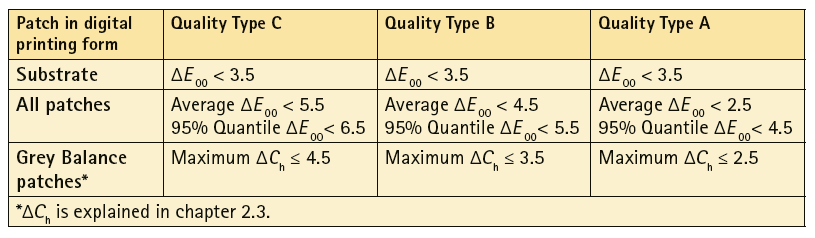
The PSD reflects the different customer requirements for the degree of color match with three different quality levels, the quality types A, B and C. Here, A represents a better approximation than B, which in turn is better than C. The overall rating depends on the lowest rated Category. If a value exceeds the tolerance limit, a red X indicates that the evaluation has failed. Quality types A to C thus indicate that all values are within the respective tolerances and that the evaluation has passed (shown in shades of green).

This gradual evaluation of the quality with regard to color reproduction can be achieved with two different evaluation methods: Side-by-Side or Media Relative.

PSD Evaluation (FOGRA PSD 2022 Side-by-Side): Side-by-side is a long-established method based on simultaneous and immediately adjacent color matching. The deviation tolerances apply to the comparison of the target values, defined by the color reference, and the measured values of the OK sheet.

From the Fogra PSD Handbook: Deviation tolerances for Side-by-Side reproductions. Version: PSD 2022

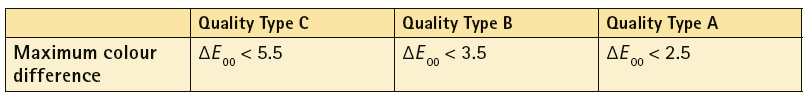
From the Fogra PSD Handbook: CIEDE2000 tolerances for spot colors. Version: PSD 2022

PSD Evaluation (FOGRA PSD 2022 Media Relative): The media-relative evaluation consists of two steps. First, the similarity between the reference and the current output color gamut is checked using the white and black points. A similarity is mandatory to perform the colorimetric evaluation in the second step.

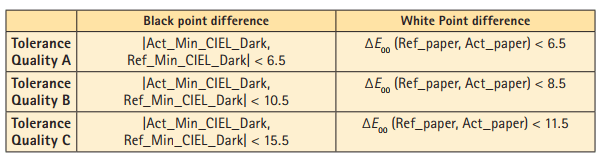
From the Fogra PSD Handbook: CIELAB tolerances for gamut differences to check if media-relative is applicable. The color differences for the white color are very similar when using ΔE ab or CIEDE2000. The CIEDE2000 tolerances shall take precedence. CIELAB 1976 color differences are given in brackets. Version: PSD 2022

The calculation of the media-relative CIELAB color values only takes place if the criteria specified for the first step are met. They are the starting point for the final color evaluation based on all control patches in the second step.

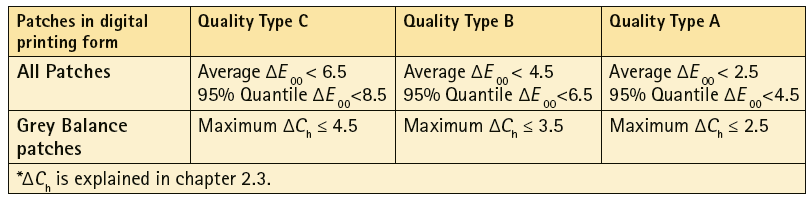
From the Fogra PSD Handbook: Deviation tolerances for media-relative reproductions. Version: PSD 2022

Note: Reliable results can only be achieved with absolute colorimetric measurement data, so please do not use relative or scaled (e.g., converted with perceptual rendering intent) measurement data.

Specify spot colors: When evaluating Multicolor measurement data, the additional colors can be evaluated as process colors or as spot colors. In most cases, with typical Multicolor media wedges, all colors are process colors, but with ZePrA-created dynamic media wedges, additional spot colors may also be included in the file.
Specify spot colors opens a dialog where you can define whether a color is included in the selected Evaluation Method calculation as a Process color or as a Spot color.

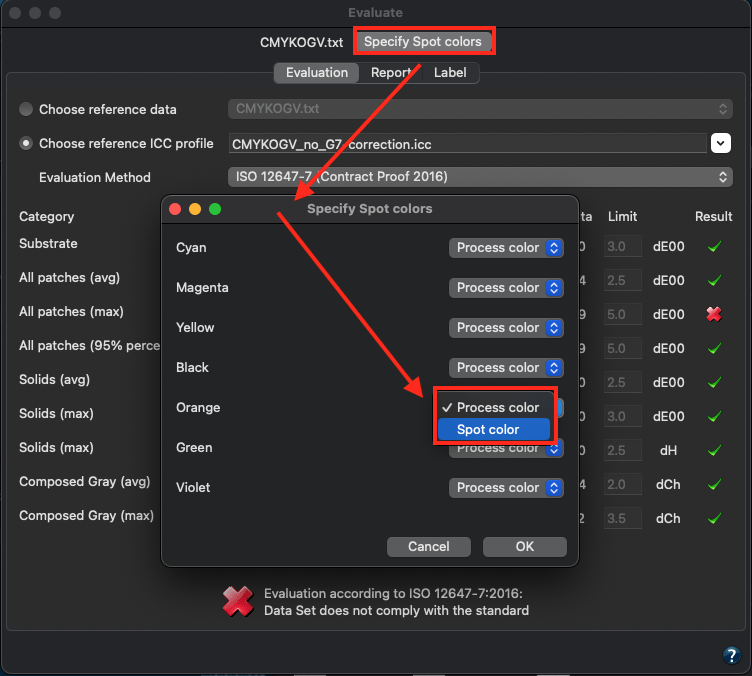
By default, all channels of Multicolor data are defined as process colors and included in the evaluation All Patches.

However, if spot colors are present and should not be treated as process colors, e.g., in the case of dynamic media wedges in ZePrA, they can be defined as spot colors. In this case, they are not included in the All Patches evaluation, but are evaluated separately and displayed in a separate Spot color evaluation line.

Note: The button for the Specify spot colors dialog is shown for Multicolor data only.

Report

The available input fields depend on the selected Evaluation method. Enter the required information according to the selected ISO standard.

Save Report: Saves the report in the location and format (PDF, HTML, XML) specified in Settings.

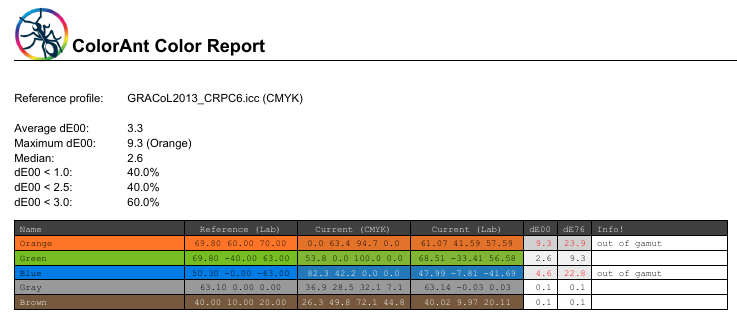
The report contains all the information that you have entered, the summary from the evaluation dialog, a list of all patches with their names or IDs, the device color space, the Lab reference values, the Lab measurement value and the delta.
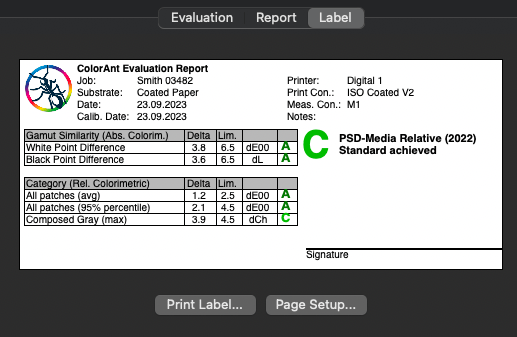
Label

Allows you to print a label with the evaluation results directly from within ColorAnt. The tab shows a preview of the label to be printed. The label contains the data entered in the Report tab and a table with the data from the Evaluation tab. It also indicates if the print is Accepted or if the evaluation has failed (X) and provides space for a signature.

Note: The label layout is optimized for DYMO 99012 labels (format 89mm x 36mm). For other formats, adjustments may be necessary to achieve optimum results.

Video Tutorial

How to Use the Proof Evaluation Tool in ColorAnt in combination with ZePrA

Learn step-by-step how to use the Proof Evaluation tool in ColorAnt for the evaluation of a proofing media wedge created with ZePrA. In this example, we will be demonstrating the special feature of ZePrA to create a dynamic media wedge using process and spot colors and how to use the supplied reference data from ZePrA for evaluation of a Contract Proof.

ColorAnt | Color Editor

Color Editor

Manual editing of patches and best possible spot color conversion

Color Editor

The Color Editor tool covers several applications:

  1. Best possible conversion of colors (usually spot colors) using ICC profiles.
  2. Saving spot colors converted with Color Editor in various color formats for use in other applications.
  3. Manually changing color names.
  4. Manually changing Lab values and device values assigned to a color patch.
  5. Adding or removing color patches.

Overview of the Color Editor

On the left side is a table with the colors of the loaded measurement file. It contains the following information:

  • Color: Name of the color
  • Measurement: Measured color values in Lab (spectral values are retained but shown as Lab)
  • Current (DCS): Specifies the current device values. Displays the device values after applying the settings and functions on the right side.
  • Profile (DCS): Displays the device values resulting from a conversion using the selected profile on the right-hand side.
  • dE00 (Current): Displays the absolute colorimetric DeltaE 2000 values, which result from the measured Lab values and the current device values.

Single, multiple or all color values can be selected in the table and then edited with the tools on the right. The color table can be sorted by Color or dE00 (Current) by clicking on the column headings.

Below the table are two buttons to Add or Delete patches as well as the Invert Selection button.

Invert Selection: Provides a quick and easy way to reduce a large number of displayed colors of a large data set to only a few colors. Simply select the desired color patches, click Invert Selection followed by the Delete button. Now you are working on your individual color selection.

Search: Helps to find and edit specific colors of large data sets. Type in the name of the desired color and the list will show only colors with those name components.

Tip: Combine the Search with Invert Selection

If, for example, you would like to edit all colors with the name component ‘Red’ of a Pantone library as a small list, enter ‘Red’ in the Search.

Select the colors found, then delete the search term and click on Invert Selection.

By pressing the Delete button, only the colors with the name component ‘Red’ remain in the list. All others are removed.

Spot Color Report: Generates a PDF report that can be used to check the conversion of spot colors before actually printing.

The spot color report shows the results achieved by a spot color conversion in relation to deltaE00, deltaE76, and the separation into process colors. This allows the accuracy of spot color conversions to be checked before processing or printing, and to determine in advance how spot colors (e.g., Pantone® or HKS and other colors) of specific PDF and image files are converted.

A spot color library with multiple spot colors such as Pantone, HKS or other colors can be color converted with a target ICC profile to check for the resulting process color breakdowns (DCS). The report provides the color name for each spot color, the process color breakdowns, the expected deltaE2000 and deltaE76 values, and an overall evaluation in terms of average and maximum deltaEs.  It also includes the median and how many colors are reproduced within a tolerance of 1 and 2.5 dE00 as well as within the user-defined dE00 limit.

The report also contains an information column that shows, among other things, whether a color is out of gamut.

Measurement Information

Shows the Name, the measured Lab value (CIE) and the current device value (DCS) including the color space for the selected color field.


Color Conversion Settings

After selecting an ICC Profile, first the DCS values are calculated using the Absolute Colorimetric rendering intent.

However, these are not always the best possible color values, neither with regard to the smallest DeltaE nor to printability.

Therefore, various optimization modes are available in the Color Conversion Settings, which can be applied to the colors selected on the left side of the table.

It is also possible to apply different modes and colors to individual colors.

Define the Profile and the Mode for the conversion of the measured values. Six modes are available for the color conversion:

  1. Precise Match – Proofing
    Spot colors are reproduced as accurately as possible on a proof printer. This method is not suitable for production as it may use all process colors for spot color simulation to achieve the best result (based on DeltaE 2000). The full tone is calculated with the aim of achieving the smallest possible DeltaE 2000 value. No channel reduction or print optimization is applied.
  2. Visual Match – Utilize More Channels
    Produces visually the best possible conversion with high color accuracy and with excellent printing properties. Full tones of spot colors are converted with as few channels as possible and still remain colorimetrically accurate. This method is suitable for digital printing, large format inkjet printing or offset printing with a fine screen ruling and good register accuracy.
  3. Use the least Amount of Channels possible
    A good method to convert full tones of spot colors with a minimum number of channels and still get colorimetric accurate results. Choose this method for packaging printing where pure colors are desired. One or two-color combinations are also included in the search for the best possible color combination.
  4. Use one Output Channel only
    Useful for print packaging production. The spot colors used for text and bar codes will be converted using a maximum of one process color.
  5. Use a Maximum of two Channels
    Uses one or two output channels. Best for one or two process colors providing the best colorimetric match selected for each spot color automatically. The results are very clean separations that are easily printed, but not necessarily very exact in colorimetric terms. It is recommended to only use this function for individual, manually created spot colors.
  6. Use a Maximum of three Channels
    Uses one to three output channels. Similar to the calculation method Use the least Amount of Channels possible. No more than a maximum of three channels should be used. Choose this method for packaging printing, where the purest possible colors are to be produced and not more than three process colors for spot color conversion must be used. Single-color and two-color combinations are also included in the search for the best color combination.

dE00 Limit: Colors exceeding the set threshold are marked with a warning symbol.


Optimize Output Values

Displays the current device values for the selected ICC profile.

By clicking on dE76 or dE00 the deltaE can be minimized for each color.

Automatic: Uses the selected ColorLogic calculation mode, typically reducing the number of channels for better printability.
Note: By deactivating the checkboxes for the color channels, the values displayed in the number fields are fixed (for example 0% or 100%) so that they are not changed when applying dE76 or dE00. However, this does not apply to Automatic, here, all channels are always taken into account.

Revert: Undoes all changes and reverts back to the original DCS values initially calculated using the selected ICC Profile.

Color Information

Displays various information about the selected color:

Reference: Measured Lab value of the color
Profile: Shows the color value calculated with the process colors of the target profile
Current: Optimized color value of the process colors
dE76: Expected color difference in DeltaE 76
dE00: Expected color difference in DeltaE 2000
Paper white simulation: Considers the coloration of the substrate for the target color space
Note: It is recommended to activate the Paper white simulation.
Divided color preview: The divided color preview shows how the original color (upper bar), the non-optimized color by means of the profile (left lower square), and the optimized color (right lower square) would look like when printing. The color preview is displayed in true colors on a calibrated and profiled monitor.

Comparison of original color (Reference), non-edited color (Profile) and edited color (Current)

Note: A warning message is displayed below the color preview when one of the three colors is out of the monitor’s gamut.

After editing the measured values, a file with the optimized device and/or measured values is created by clicking on Start.

Note: The Color Editor tool is grayed out if the file loaded under Data Sets does not contain any measured values. Once a single measurement file has been selected, it can be opened in the Color Editor (multiple files cannot be opened simultaneously).

Color Editor Use Cases

Example: Best possible conversion of (spot) colors

Measurement data from spot colors loaded into ColorAnt can be converted into any color space using the Color Editor and ICC profiles. All color spaces including RGB, CMYK and Multicolor are supported.

Note: The Conversion of Multicolor profiles requires an L license.

To convert a spot color to RGB, CMYK or Multicolor, follow these steps:

  1. Load the measurement data file including individual full tone spot colors (for example a spot color library as CxF file) under Data Sets in ColorAnt, select the file and then click Color Editor.
  2. Under Color Conversion Settings, select the desired ICC Profile from the drop-down menu.
  3. The table on the left side fills with the device values. Initially, the device values are identical for Current (DCS) and Profile (DCS), since no optimizations have yet been made.
  4. Select the color you would like to optimize from the table and a Mode under Color Conversion Settings.
    The calculation mode specifies how ZePrA should convert one or more spot colors to the target color space.
  5. Choose one of the three modes described above. Under dE00 Limit, enter the threshold value in DeltaE 2000 from which colors in the table are to be marked with a warning symbol.

  6. The control panel Optimize Output Values shows the device values (Current DCS) calculated with the selected ICC profile. The calculation is always absolute colorimetric.

  7. Now click on Automatic to convert the colors using the selected calculation mode. Alternatively, perform the calculation according to DeltaE76 (dE76) or DeltaE 2000 (dE00). However, these two methods do not include ColorLogics high-quality calculation modes. The device values are displayed immediately after application of the calculation.

    By clicking on Revert the changes can be undone.
  8. The Color Information panel shows the measured Lab value of the color under Reference, the color value calculated with the process colors of the target profile under Profile and the optimized color value under Current. Additionally, the expected color difference is displayed in dE76 (DeltaE 76) and dE00 (DeltaE 2000). Activating the checkbox Paper white simulation takes the coloration of the substrate for the target color space into account. The calculation of the Lab values for Current and the color distance (DeltaE) are performed accordingly.
    Note: It is recommended to activate the Paper white simulation.
    Divided color preview: The divided color preview shows how the original color (upper bar), the non-optimized color by means of the profile (left lower square) and the optimized color (right lower square) would look like when printing. The color preview is displayed in true colors on a calibrated and profiled monitor.

    Comparison of original color (Reference), non-edited color (Profile) and edited color (Current)

  9. If you want to make fine adjustments, manually optimize the percentages in the Optimize Output Values control panel and see the effects directly under Color Information.
  10.  If you are satisfied with the optimization, continue optimizing more colors. Optimized colors are updated directly in the table. With a click on Start the editing is completed using the device values shown under Current (DCS) and the dialog will close. Please note that colors that have not been optimized will only be converted using the normal profile conversion and may therefore not achieve the best possible result.

Specifics

  • If you would like to optimize several or all colors in the table at once, select the desired colors and click on the desired calculation (Automatic, dE76 or dE00).
  • If two or more colors are selected, device and color values are grayed out in the panels Optimize Output Values and Color Information.
  • If a file previously optimized with an ICC profile in the Color Editor is re-opened in Color Editor, the previously used ICC profile is preselected automatically.
  • If you change the ICC profile, typically, the device values have to be recalculated. To do so, activate the checkbox Recalculate DCS values and confirm with OK.

Confirm recalculation of the DCS values

Example: Saving color-converted spot colors to other formats
Spot colors converted with Color Editor can be saved in various color formats supported by ColorAnt and used in other applications.

  •    CxF or CxF/X-4 for use in many modern applications
  •    Adobe Swatch Exchange (ASE) for use in Adobe Illustrator and InDesign
  •    ACO for use in Adobe Photoshop
  •    ICC Named Color Profiles for use in programs that support this special ICC format.

The complete list of supported formats can be found here.

Note: Spot colors converted with Color Editor contain the original color values (Lab or spectral values) and the optimized device values for the selected ICC profile.

Example: Manual Editing

The Color Editor also allows to manually change color patch names or color names, to manually change the measurements and device values associated with a color patch, and add or remove individual color patches. Make the appropriate changes in the topmost control panel Measurement Information.

Under Name change the name of (spot) colors or color patches of test charts.

Under
CIE edit the measured values of the color, under DCS edit device values (if present). Typically, DCS values are not available in a pure spot color measurement file.

Using the buttons below the table (Add, Delete), selected colors can be removed or one or more colors can be added. Added colors are placed at the end of the table. A default name and a medium gray are preselected, which can be changed under Measurement Information as required.

Specifics

  • Measurements of profiling test charts often have no name designations. For such measurements, the Color Editor automatically adds an identifier, for example #1 for the first patch.

  • Spectral measurement data can also be edited in the Color Editor. They are then displayed as Lab values with D50/2 degree standard observers. In the final file, however, the spectral values are preserved.
  • If the CIE values of spectral measurements are edited as Lab values, the spectral properties of the color are retained.
  • We recommend not to change or optimize DCS values in test charts if the data is used for profiling purposes.
  • When selecting an ICC profile, typically, the device values don’t have to be recalculated. Deactivate the checkbox Recalculate DCS values and confirm with OK.

Recalculating colors without changing the DCS values

ColorAnt | Embed CxF X-4

Embed CxF/X-4

Embed CxF/X-4 data in a PDF file

Embed CxF/X-4

Embed CxF/X-4 allows to embed spectral measurement data of spot colors (compliant with CxF/X-4) in a PDF file so that other CxF/X-4 compatible tools (e.g. ZePrA) are able to extract or use this data. The embedding is in accordance with PDF 2.0 and CxF/X-4 specifications.

Note: Only available in ColorAnt L

Procedure

  1. Select the CxF/X-4 measurement data in the Data Sets panel in ColorAnt and open the Embed CxF/X-4 tool from the sidebar. Single or multiple measurement data files can be selected.
    Note: If the measurement data file is not compliant with CxF/X-4, the tool is grayed out.
  2. Select a PDF/X file with spot colors to embed the selected measurements into. Only a single PDF file can be selected.
  3. Once the PDF/X file is opened, the tool lists all spot colors of the PDF file, checks for spot color names that fit those of the CxF/X-4 measurement data and warns in case of conflicts. The data will only be embedded if the spot color names of the PDF file fit those of the CxF/X-4 file.
  4. Click Start.

Note: The spectral data needs to be compliant with the three CxF/X-4 spot color conformance levels:

  •    CxF/X-4b single patch characterization (if only the full tones of spot colors are available)
  •    CxF/X-4a single background characterization (full tone and gradient on white)
  •    CxF/X-4 full characterization (full tone and gradient on white and black)

Embed CxF/X-4 data in PDF files

Replace already existing CxF/X-4 measurement data: Is only enabled when CxF data is already available in the PDF file, otherwise, it is grayed out. If the checkbox is activated, existing CxF data in the PDF will be replaced by new data.

Requirements

  1. Spectral measurement data must be available for the selected spot colors. Lab data is not supported in the CxF/X-4 format.
  2. At least the full tone has to be available. Otherwise, the tool is grayed out.
  3. Test chart files with typical CMYK, RGB or Gray color spaces are not supported.
  4. Only PDF files with Output Intent are allowed as the CxF data will be embedded in the output intent.

Note: PDF files can have an output intent without being PDF/X compliant. If a selected PDF file has no output intent a warning message will indicate that this file is not suitable and the Start button will be disabled.

5. The PDF file must contain spot colors otherwise embedding is not be possible (e.g. the Start button is disabled).

ColorAnt | Creating test charts and measurement data for X-Rite i1iO and iSis

Creating test charts for the X-Rite iSis

As of ColorAnt 8, the iSis is supported directly; the workaround described here is then no longer necessary.

For older ColorAnt versions, test charts can be created for the X-Rite iSis based on our reference files using the X-Rite i1Profiler application. In the following example we are generating a test chart and measurement data with an iSis for a 6 color printer. The procedure is the same for any other color space, such as RGB, CMYK, 5 or 7 colors.

Note: Generating test charts and measurement data can be done with the demo version of the software. Make sure to always use the most recent software version.

Procedure

1After starting the i1Profiler software select the color workflow you want to create the test chart for under Device selection. For a 6 color test chart select CMYK+2. After that click the Profiling button.

2In the Patch Set section click Load, select the CGATS files option under Files of type and navigate to the ColorLogic reference TXT file for 6 colors.

Reference files are stored in the Testcharts/Multicolor folder inside the CoPrA installation folder. With ColorAnt L you can generate the 6 color reference file using the Custom Chart tool and save the reference file to your desktop.

3The number of patches and a preview of the patches is displayed after loading the reference file.

4Ignore all information regarding Linearisation or Printer color setup and simply click on Next or click the Test Chart button at the bottom of the dialog.

5. Select the instrument (i1iSis 2) in the Test Chart section under Device setup and the page layout under Page setup (A3). Now a preview of the test chart layout and the number of pages is shown. Click on Save as and save the test chart to be printed on your printer.

6After printing the chart measure it in the Measurement section. Connect your instrument and the Measurement Mode (M0, M1, M2), then click on Measure.

7Once you are done with your measurement data acquisition click Save and select the i1Profiler CGATS Spectral text file format under Files of type and save the measurement data to disk.

8Now you are done with the i1Profiler and you can use the measurement data in either CoPrA for profiling or ColorAnt for further optimization (recommended).

ColorAnt | Export CxF/X4

Export CxF/X-4

Creating CxF/X-4 files with custom options

Exporting a CxF/X-4 file from ColorAnt

The function Export CxF/X-4 exports spectral data as a Color exchange Format (CxF/X-4) compatible file. It can be found under File > Export CxF/X-4.

CxF files are used to communicate colors in a vendor-neutral way. CxF/X-4 has been an ISO standard since 2015 and is designed to define spot colors by measuring and storing spectral information of inks and colors on the substrate or process black. These spectral definitions allow for better proofing and reproduction of spot colors in color management systems. CxF/X-4 files can be loaded as a spot color library in ZePrA.

Procedure

    1. Open the spot color measurement file to be exported as a CxF/X-4 file (e.g., spectral measurement data of a test chart or any other measurement data with spot colors).
      Note: The file must contain device data (DCS data) and CIE spectral data. Neither Lab data nor pure spot color measurements without any percentage values are sufficient.
    2. Select File > Export CxF/X-4 to open the CxF/X-4 export dialog.
    3. Specify all relevant data such as Substrate Name, Substrate Type, Print Process and Surface Finishing.
      Note: These metadata are optional, but can be advantageous when using the CxF/X-4 file in other programs.
    4. Click on Start to export the file in CxF/X-4 format.

    Notes:

    • CxF/X-4 only refers to the characterization of spot colors. Therefore, only the full tones of each primary color (except black), overprint information of the corresponding color on black and hues are considered. So, when exporting a complete IT8-4 CMYK test chart, it will result in 102 color patches for CMY.
    • Redundancies are automatically removed when the data is exported.

    Include black gradient in export: By activating the checkbox, the black gradient is also exported.
    Typically, when exporting CxF/X-4 data from a complete test chart, only 100% black and overprinting spot colors with 100% black are included, but not the black gradient. However, adding the black gradient can be convenient if the black information from the CxF/X-4 data is to be used in other tools (e.g., in Edit Primaries).

    Note: Although the CxF/X-4 specification does not explicitly prohibit including the black gradient, the original idea is to specify spot colors, not black. Therefore, activating the checkbox can lead to incompatibilities with programs from other manufacturers.

    CxF/X-4 relates to spot color characterisation only, the full tone of each primary color except black, tints and overprints of the respective color with black are saved.

    As a result, if you export a complete iT8-4 CMYK test chart it ends up with 102 patches for CMY.

    Remove redundant patches: A feature to automatically optimize and remove redundant color patches is available with the Export CxF/X-4 (to save CxF/X-4 compatible measurement values). If the checkbox Remove redundant patches is activated all required color patches will be saved only once in the exported CxF/X-4 file, avoiding duplicates.
    Note: Color patches within a gradient are automatically sorted according to their measurement values. This correction of “wrong” primary gradients is intentional since wrong primaries can lead to various other problems.

    Include black gradient in export: Also exports the black gradient. Typically, when exporting CxF/X-4 data from a complete test chart, only 100 % black and overprinting spot colors with 100 % black are included, but not the black gradient. However, including the black gradient can be convenient if you want to use the black information from the CxF/X-4 data in other tools (for example, under Edit Primaries).

    Note: The CxF/X-4 specification does not explicitly prohibit saving the black gradient, but the original idea is to specify spot colors, not black. Therefore, activating the checkbox can lead to incompatibilities with programs from other manufacturers.

    ColorAnt | Measure

    Measure

    Measure test charts

    Measure Tool

    The Measure Tool is ColorLogic’s own tool for measuring test charts and spot colors. It can be opened in ColorAnt by selecting Measure in the Sidebar.


    Measuring with the Measure Tool

    Selection

    Select your device and connect it to the Measure Tool by clicking Connect.

    Note: If a measuring device is not recognized or does not work properly, make sure that no other software or service is accessing the device in the background.

    Other applications that support measurement devices may be connected to them by default. This is because the connection application (e.g., X-Rites i1Profiler Tray) is started by default at system startup and runs continuously in the background. So, when these applications are running, the Measure Tool may not be able to detect and connect to the measurement device. The solution is to launch the Activity Monitor (on macOS) or Task Manager (on Windows) and close the connection application (see screenshot).
    In addition, devices must not have an existing Bluetooth connection, otherwise they will not be recognized and cannot be connected to the Measure Tool.

    Light bulb icon: The Light bulb icon is shown when an instrument (such as the X-Rite i1Pro or the Konica Minolta FD-7) supports the Ambient Light Measurement mode. Clicking on this icon will switch between Ambient Light Measurement and the standard Reflectance Measurement. The mode can also be switched in the file menu Measure Mode. More information can be found in the chapter Ambient Light Measuring in Measure Tool below.

    Info

    Shows the current device information (if the selected device was found, version number and if the built-in filter is active).

    Options

    Direction: Specifies how the chart is measured. Depending on the selected device, single field measurements or strip measurements in horizontal or vertical direction are available.

    Evaluation: Allows you to compare the measured data with a profile of your choice. Click on the Gear icon and select the comparison profile from the list of profiles available on the system. All patches with a DeltaE deviation higher than 20 are highlighted in red on the chart. By default, evaluation is disabled.

    Note: The Evaluation can be deactivated by selecting the first entry Deactivated in the profile selection.

    Opening charts

    Charts can be opened via the File menu via the Recently used files and Predefined Charts entries. You can add your own charts to the list by placing them in the ColorAnt Wedges folder (User\Documents\ColorAnt\Wedges).  The menu entry Open chart directory takes you directly to the Wedges folder.
    Alternatively, simply load a reference file or drag it onto the window.

    Note: The Measure Tool and ColorAnt can be used in parallel. Additional files can be sent from ColorAnt to the Measure Tool while it is running. These files are added to the Reference list.

    When measurement data is found in the loaded data, the user has the option to either use this data for remeasurement or to delete the measurement data and use the reference data for a new measurement.

    Chart display area

    The chart display area shows the selected chart with row and column numbers.

    The next patch or row to be measured is highlighted by a yellow frame. If Evaluation is turned on, measured patches with a high DeltaE variance are marked in red.

    Show reference data (accessible under View in menu bar): Allows a split view of the patches. One half shows the reference color value, the other the measured color value.

    Fit to width (accessible under View in menu bar): The chart expands to the width of the window. For larger charts, a scroll bar appears on the right.

    Add measurement: Manually adds completed measurements to the Measurements list. Usually, completed measurements are automatically added to the list. However, for re-measurements the data must be added manually to the Measurements list using the Add measurement button.

    Measurements: Opens a list with all measurements of the current measuring session. The chart selected in the list is shown in the Measure Tool main window. More details about the Measurements window are available below.

    Transfer and exit: Transfers all data to the Data Sets section in ColorAnt’s Main Window and closes the Measure Tool.

    Reference: Lists all reference files added to the Measure Tool in the current session.

    Info icon: Hover the mouse pointer over the icon to display information about the chart, such as the name of the reference, the number of patches, rows and columns of the chart. This information is useful for some devices, for example, to set them up quickly and easily.

    Patch information: When hovering the mouse over a color patch, information about the respective patch is displayed, such as the patch number, the color space including reference values and measured values. When comparing with a profile, information about the DeltaE deviation is also displayed.

    Show: Select the measurement condition to be displayed. Only available for datasets containing multiple measurement conditions.

    Delete icon: Deletes all data measured so far and displays the chart with the reference values.

    Notification messages: On the left below the display area you will see various notes and messages about the current measurement. For example, when measuring charts, there may be instructions about changing charts, or a message indicating a questionable measurement in a row (e.g., when the wrong row has been measured).

    Help icon: The help icon on the bottom right takes you to ColorAnts Online Help with a single click.

    Measurements window:

    Date: Shows the date and time of the chart measurement.

    Content: The name of the measured chart.

    All: Selects all entries.

    None: De-selects all entries.

    Invert: Inverts the selection.

    Back: Returns to the Measure Tool.

    Trash can icon: Deletes selected measurements.

    Transfer: Transfers the selected data to ColorAnt’s Data Sets section and returns to the Measure Tool.

    Transfer and Quit: Transfers the selected data to ColorAnt’s Data Sets section and closes the Measure Tool.

    General Information on measurement conditions

    The ISO-Norm 13655:2009 defines the various measuring conditions M0, M1, M2 and M3.

    M0: Does not define a specific light source but recommends illuminant A. This illuminant represents domestic lighting with tungsten filament at a colour temperature of approximately 2856 Kelvin. The UV content of the light is not precisely defined. Consequently, according to ISO 13655, M0 is unsuitable if the paper fluoresces or if measurement data must be exchanged between locations.

    M1: If the substrate contains optical brighteners, this measuring condition minimizes the fluctuations of the measuring results between different devices. D50 must be used as illuminant, i.e. a daylight simulation with a colour temperature of 5003 Kelvin. The radiation intensities of the wavelengths are precisely defined, even those below 400 nm, since these wavelengths excite fluorescence.

    M2, also known as “UV-cut”: Applies only radiation energy above 400 nm wavelength to the sample, either through a filter advanced to the optics of the measuring instrument, or computationally. This ensures that fluorescence has no influence on the measurement results.

    M3: A polarizing filter is placed in front of the lens of the measuring instrument to suppress the effects of gloss effects on measurement data. Otherwise, the same requirements apply as for measurement condition M2.

    Ambient Light Measuring in Measure Tool

    The Measure Mode (in the menu bar) allows selecting either the Ambient Light Measurement mode (only for supported devices) or the standard Reflectance Measurement mode.

    If an instrument such as X-Rite i1Pro and Konica Minolta FD-7 supports both modes a light bulb button is shown in the user interface next to the instrument chooser. Clicking on this bulb button will switch between the modes. Alternatively users can switch the mode in the file menu Measure Mode.

    The Ambient Light Measurement mode allows measuring the spectral radiation of a light source as a single color patch.

    To measure, follow the instructions for the instrument calibration and preparation. An ambient light head must be placed on the instrument to measure the light source accordingly (see instruments manual). Depending on the instrument you may use the button on the instrument to measure or click the Measure button in Measure Tool.

    Once the measuring is finished the Luminance, Temperature (in Kelvin), Spectral and XYZ values are shown. If you wish to transmit the current measurement to ColorAnt click the Transmit button.

    Ambient light measurements are called Emission in the CIE Data Sets column in ColorAnt. They can be used in the CIE Conversion tool in ColorAnt or in the Viewing Condition section in CoPrAs printer profiling module.

    Instruments with Setup Wizards

    All supported instruments with Setup Wizards (e.g. the i1iO, Konica Minolta FD-9 and the Barbieri devices) can automatically import the Scan Options (chart size, Rows per page, Gap Size) from the reference file if available. Since these values no longer have to be entered manually, a major source of error during setup and subsequent measurement is eliminated. However, the Scan Options are ONLY stored in the reference file if it was created with the Export Chart tool of ColorAnt 5 (and higher). If this information is not contained in the reference file, it must – as before – be entered manually.

    Measuring multiple charts

    Multiple charts can be measured in a single session (without closing/opening the Measure Tool after each measurement). Measured charts are automatically added to the Measurements list. The number in brackets indicates the number of measurements. A previously measured chart can be added to this list by using Add measurement which is only enabled when a complete measurement data set is available. Clicking on Measurements opens the list containing all measurements.

    If a device with a wizard (positioning) is used (e.g., the X-Rite i1iO) the next measurement can be started by clicking on the Gears icon to enter the wizard/device settings. By clicking the Transfer and Quit button the data is directly sent to ColorAnt’s Data Sets section and the Measure Tool is closed.

    Remeasure faulty patches/rows

    Existing measurement data with erroneous measurement data can easily be corrected by simply remeasuring only the faulty parts (rows or patches) of the chart.

    If you find that some patches or rows have not been measured correctly in a measurement, you do not need to remeasure the entire chart. It is sufficient to remeasure only the erroneous patches or rows.

    To do this, simply load the file with the faulty measurement data and it will automatically be added to the Reference list. Basically, the existing measurement data can be retained in order to remeasure only the parts to be corrected, or the existing measurement data can be deleted in order to use only the reference data of the file for a new measurement.

    To remeasure individual patches or rows of the chart, answer the QuestionRetain existing measurement data for re-measurement?” with Yes.

    Note: If a file with multiple measurement conditions is loaded, select the appropriate Measurement Condition in the import dialog.

    Connect the measurement device and measure only the part to be corrected – a row, a patch, or an entire page. This remeasured part will then replace the faulty part of the measurement data.

    Note: By default, the first row/patch is selected, but any row or patch can be selected for reassessment. If a device supports the chosen measurement condition only in a combined multi measurement mode, the data of the selected condition will be copied into all condition slots.

    Once the remeasurements are completed, the measurement data has to be added to the Measurements list using Add measurement. Select either Transfer to transmit the data to the Data Sets section and return to the Measure Tool, or select Transfer and Quit to send the data to the Data Sets section and close the Measure Tool.

    Note: If the Measure Tool is opened by an application that only requests one data set/measurement (such as CoPrA or ZePrA), it will start in Single mode. In this mode it is only possible to measure a single file. Once the measurement is complete, transmit the data and quit or return to the Measure Tool:

    Click Back to choose another file or remeasure and correct the data. However, in Single mode only one measured data set is shown in the Measurements window. Measuring multiple charts will always overwrite the last measurement (because only one file can be transferred).

    If the data is measured with a device that supports multiple measurement conditions, the calling application will display the Import dialog, so that only one of the data sets can be selected for transfer.

    Supported Devices

    Barbieri


    Barbieri Spectro LFP
    Barbieri Spectro LFP qb
    Barbieri Spectropad

    Konica Minolta


    Konica Minolta FD-5
    Konica Minolta FD-7
    Konica Minolta FD-9

    MYIRO


    MYIRO-1
    MYIRO-9

    Techkon


    SpectroDens (Windows only)
    SpectroJet (Windows only)

    X-Rite


    X-Rite eXact
    X-Rite eXact2
    X-Rite i1Pro 1
    X-Rite i1Pro 2
    X-Rite i1Pro 3
    X-Rite i1iO
    X-Rite iO3
    X-Rite i1iSis 2/XL

    Important: Please make sure to install the latest device driver from the manufacturer, as missing or faulty drivers may cause problems. Some devices require Visual C++ Redistributable. Verify that the version required for your device is installed.

    Virtual Devices

    ColorAnt’s Measure Tool includes three Virtual Devices, the Virtual Device (manual), Virtual Device (spectral) and the Virtual Device (printer). The Virtual Device (spectral) is used for demonstration purposes. The Virtual Device (manual) allows you to manually enter Lab values for selected patches. For example, this is helpful if the device that measured the values is not connected to the Measure Tool or if an older device is used that only displays the measured values on the device itself.
    With the Virtual Device (printer) a typical offset printing behaviour can be simulated for test purposes.

    Virtual Device (spectral)

    Measurements using the Virtual Device (spectral)

    Step 1: Select the device from the drop-down list Selection.

    Step 2: Click on Connect.

    Options: Are available once the Virtual Device is connected. Select the Direction of the scan.

    Condition: M0, M1, M2, M3.

    Step 3: Start a measurement by double-clicking on the first patch of the first row.

    Step 4: When the measurement is complete, click on the Transfer icon to transfer all measurement data and return to the calling application (ColorAnt, CoPrA or ZePrA).

    If several measurement conditions have been used, the results/measured values of the individual conditions can be selected and viewed in the drop-down menu next to the Transfer icon.

    Note: The Virtual Device is for test purposes only and will simulate the same stored spectral data each time.

    Virtual Device (manual)

    Measurements using the Virtual Device (manual)

    Step 1: Select the device from the drop-down list Selection.

    Step 2: Click on Connect, a dialog with an input field for the Lab values appears.

    Condition: M0, M1, M2

    Step 3: Enter the appropriate Lab values and either press the enter key on your keyboard or click the Next button to select the next patch automatically. All required lab values can be entered in a single session.

    Step 4: Once editing is complete, click the Close button to finalize the manual measurement process.

    Step 5: When the measurement is complete, click on the Transfer icon to transfer all measurement data and return to the calling application (ColorAnt, CoPrA or ZePrA).

    Virtual Device (printer)

    Measurements using the Virtual Device (printer)

    Step 1: Select the device from the drop-down list Selection.

    Step 2: Click on Connect.

    Condition: M0, M1, M2, M0/M1/M2.

    Options: Are available once the Virtual Device is connected. Select the Direction of the scan.

    Step 3: Start a measurement by double-clicking on the first patch of the first row.

    Step 4: When the measurement is complete, click on the Transfer icon to transfer all measurement data and return to the calling application (ColorAnt, CoPrA or ZePrA).

    If several measurement conditions have been used, the results/measured values of the individual conditions can be selected and viewed in the drop-down menu next to the Transfer icon.

    Note: The virtual device is for test purposes only and simulates a typical offset printing behavior with always the same stored data.

    MYIRO

    MYIRO-1

    Measuring with the MYIRO-1

    Calibration

    Step 1: Select the device from the Selection drop-down.

    Step 2: Click Connect.

    Step 3: Make sure that the white reference head is mounted and click OK.

    Condition: Measurements are always carried out with the combined conditions M0/M1/M2. All available measuring conditions are always measured in a single step.

    Measure

    Step 1: Select the device from the Selection drop-down and perform the white calibration.

    Step 2: Under Options > Direction, select how you would like to measure the test chart. For measurements with the ruler we recommend the option Scan complete rows.

    Step 3: Place the instrument in front of the first patch of the row to be measured and press the measure button on the instrument. Keep the button pressed while moving the instrument across the strip and beyond the last patch. Release the button when done.

    Step 4: The data is transferred to the Measure Tool. Continue with the next row.

    Step 5: Once the measurement is complete, click on the Transfer icon to open the Transfer measurement dialog. Here the measurement data can be discarded or transferred to ColorAnt.

    ColorAnt allows the transmission of individual or all available measurement conditions. In the latter case, several data sets are transmitted. For easy differentiation, the measurement condition is appended to the file name of each data set.

    Ambient Light Measuring

    Ambient light measurements can be performed either using the Measure Tool 4.0 or from within the CIE Conversion tool.

    Note: Requires the separately available ambient light head for the MYIRO-1.

    Measure Tool: Select the Ambient Light Measurement mode from the menu Measure Mode or click on the light bulb icon next to the Selection drop-down menu.

    CIE Conversion: Select Emission (Measure) from the drop-down list Illumination. This will open the Measure Tool.

    Step 1: Select the device from the Selection drop-down list in the Device tab and perform the white calibration as described above. After calibration, confirm the message Please prepare the device for ambient light measuring.

    Step 2: Attach the ambient light head to the device.

    Step 3: Click on Measure.

    Step 4: Transfer the measured data to ColorAnt by clicking Transmit.

    The measured values will be displayed either in the panel Data Sets (when using the Measure Tool directly) or in the CIE conversion tool.

    Step 5 (CIE conversion only): Click on Start. The data of the ambient light measurement are used to convert the selected spectral data to the new viewing condition.

    MYIRO-9

    Measuring with the MYIRO-9

    Step 1: Select the MYIRO-9 from the Selection drop-down list in the Device tab.

    Step 2: Click on Connect.

    Using the MYIRO-9 over the network

    The MYIRO-9 can be connected to the local area network via Ethernet, which allows direct transfer of measurement data to computers on the same LAN/WLAN.

    Configure the network settings on the instrument according to the MYIRO-9 user manual.

    In the ColorAnt Measure Tool, select the MYIRO-9, click on the network icon and enter the IP address of the MYIRO-9 in the address field. Click OK to establish the connection.

    Note: A USB connection always has priority. If the device is to be used via LAN/WLAN, disconnect the USB cable.

    Device options

    Once the device is connected, the Setup Wizard opens:

    Settings

    Measurement condition: M0, M1, M2, M3.

    Rows per page: Define the number of rows on your chart. If the chart contains several pages, define the number of lines on the first page.

    Number of pages: Automatically calculates the number of pages.

    Freeform: Put the chart on the table of your MYIRO-9 and the device will recognize it automatically.

    Target: Requires the definition of the chart size, patches, etc., and the MYIRO-9 will search the page for a chart that fits the parameters.

    Measure

    Step 1: After connecting the device the Setup Wizard opens.

    Step 2: Define the settings and click Start.

    Step 3: The MYIRO-9 will display a message to insert the chart. Insert the chart and wait until the measurement process is completed.

    Step 4: Once the measuring is complete the data will be displayed in the Measure Tool. Save the data and continue.

    Barbieri Devices

    Barbieri SpectroPad

    Measuring with the Barbieri SpectroPad

    Step 1: Select the device from the Selection drop-down list in the Device tab.
    Step 2: Click Connect.

    Device Options

    Once the device is connected, the Barbieri Setup Wizard of the SpectroPad opens:

    Chart options

    Chart width: Specify the width of the chart in millimeters.
    Horizontal gap: Specify the width of a patch separator.
    Measurement condition: M0, M1, M2.
    Aperture: Choose between Default and 6.
    Once all settings have been made, you can specify in the main window under Direction how you want to measure the chart.

    Measure

    Step 1: After selecting and connecting the device, define the required settings and click Start.
    Step 2: Start the measurement with the row marked in the window.
    Note: With the SpectroPad, the charts are measured line by line from bottom to top so that the instrument does not run over the lines of the chart that are still to be measured.
    Step 3: When the measurement is complete, click on the Transfer icon to open the Transfer measurement dialog. Here the measurement data can be discarded or transferred to ColorAnt.

    Barbieri Spectro LFP

    Measuring with the Barbieri Spectro LFP

    Step 1: Select the device from the Selection drop-down list in the Device tab.

    Step 2: Click Connect.

    Device Options

    Once the device is connected, the Barbieri Setup Wizard of the LFP opens:

    Type of Measurement

    Choose between Remission or Transmission measurements. Be sure to use the appropriate sample holder (reflection or transmission sample holder) for the selected Type of Measurement!

    Chart options

    Start with page: Select the first page to be measured, e.g., when re-measuring pages.

    Rows on (first) page: Enter the number of rows on the test chart page. If the test chart consists of multiple pages, enter the number of rows on the first page.
    Horizontal patch gap: Specify the height of the horizontal patch separator in mm.
    Vertical patch gap: Specify the height of the vertical patch separator in mm.

    Measure options

    Measurement condition: M0, M1, M2, M3.
    Aperture: Choose between Default, 2, 6, 8 or manual.
    Calibration Mode:

    1. Fast: Calibrated at the beginning of each test chart page.
    2. Accurate: Calibrates every second line.

    Measure Mode:

    1. Fast (default)
      Fast measuring mode is the default mode of the Spectro LFP. In this mode the measuring head lies on the target and the
      surface is scanned.
    2. Up-Down
      In up-down mode the measuring head of the instrument moves up
      and down between each measurement. Use this mode for sensitive
      materials to avoid any scratches on the surface of the target.
    3. Contactless
      The contactless mode is similar to the above fast mode with a
      difference that the measuring head does not touch the surface
      of the target. This measuring mode is suitable for sticky and
      sensitive materials.

    Note: The fast measure mode Fast (default) always uses the same amount of
    light and can therefore measure dark and bright samples equally fast. However, the disadvantage is that dark samples in particular are not recorded with sufficient accuracy. The single contact measure mode Up-Down is advantageous here, because
    the required amount of light can be individually adjusted for each color patch. This leads to a better differentiation, especially with dark colors.

    Start: Starts the measurement of the chart.

    Positioning

    Use auto positioning: The Barbieri Spectro LFP has an automatic positioning feature. In this process, the camera searches for the auto-positioning lines on the test chart. Disable the checkbox to manually position the measuring head.

    Manual Positioning
    Use the controls for the manual positioning on the right side to position the measuring head exactly above the upper left corner using the arrow keys or by entering the x/y coordinates. The measuring head should then be positioned on the outermost corner of the marked patch.

    Use the four arrows to change the position of the measuring head (left, right, up, down). The head can be raised and lowered with the double arrow in the center.

    Tip: Change the position of the head with the corresponding arrow keys on your keyboard.
    Steps: Specifies the distance covered by the measuring head when an arrow is clicked.

    Position: Moves the measuring head to the entered x/y coordinates.

    Once you are finished, click Next to specify the upper right corner of the chart.

    Confirm with Next.

    On the last page, enter the position of the lower right corner and confirm with Next.

    Multipage test charts

    Manual positioning

    If the test chart has multiple pages, a message appears after measuring a page prompting to place the next page on the table:

    1. Place the next test chart page on the table.
    2. Recalibrate the table and use the manual controls as described above to indicate two corners of the chart. The third corner is calculated automatically.
    3. Click Start to measure the next page.

    Important: If the second page was placed EXACTLY where the first page was, you can continue without recalibrating. The previously set coordinates will then be used again.

    Automatic positioning
    When auto positioning is selected:

    The checkbox Use auto positioning is activated automatically.

    Click Start to autoposition and measure the next page.

    Important: In order to use auto positioning, the chart needs the appropriate margins and markings.

    Creating charts with Barbieri gateway and measuring using ColorAnt:

    To create ColorLogic charts within Barbieri Gateway’s chart generator, including the auto positioning feature, follow the procedure below:

    Copy the ColorLogic charts to the user directory: Myuser>Documents>Barbieri>Gateway
    Start the Barbieri Chart Generator and select the reference file from the CLReferencesBarbieri folder.

    Add the desired options to the chart, e.g. auto positioning markings, reference area, etc., and Save the target file.

    Load the reference file into ColorAnt by dragging and dropping the .ref file onto the Data Sets window. The target file can be found in the Gateway>Targets folder.

    If the patches do not match the printed chart, right-click on the reference in the Data Sets window and select Swap Rows with Columns. Check the patch arrangement again in the View tool.

    Select the reference file and  click Measure. Ensure that the correct chart has been selected. Select the Spectro LFP from the device list and click Connect.

    Once the device is connected, the Spectro LFP wizard will be displayed. Simply select auto positioning and click Start.

    Barbieri Spectro LFP qb

    Measuring with the Barbieri Spectro LFP qb

    Step 1: Select the device from the Selection drop-down list.

    Step 2: Click Connect.

    Once the device is connected, the Barbieri Setup Wizard of the LFP qb opens:

    Type of Measurement

    Choose between Remission or Transmission measurements. Be sure to use the appropriate sample holder (reflection or transmission sample holder) for the selected Type of Measurement !

    Chart options

    Start with page: Select the first page to be measured, e.g., when re-measuring pages.

    Rows on (first) page: Enter the number of rows on the test chart page. If the test chart consists of multiple pages, enter the number of rows on the first page.
    Horizontal patch gap: Specify the height of the horizontal patch separator in mm.
    Vertical patch gap: Specify the height of the vertical patch separator in mm.

    Measure options
    Measurement condition
    : M0, M1, M2, M3.
    Aperture: Choose between Automatic, 2, 6 or 8.

    Measure Mode:

    1. Fast (default)
      Fast measuring mode is the default mode of the Spectro LFP. In this mode the measuring head lies on the target and the
      surface is scanned.
    2. Patch by Patch (more accurate)
      In this mode the measuring head of the instrument moves up
      and down between each measurement. Use this mode for sensitive
      materials to avoid any scratches on the surface of the target.
    3. Contactless
      The contactless mode is similar to the above fast mode with a
      difference that the measuring head does not touch the surface
      of the target. This measuring mode is suitable for sticky and
      sensitive materials.

    Note: The fast measure mode Fast (default) always uses the same amount of
    light and can therefore measure dark and bright samples equally fast. However, the disadvantage is that dark samples in particular are not recorded with sufficient accuracy. The single contact measure mode Up-Down is advantageous here, because
    the required amount of light can be individually adjusted for each color patch. This leads to a better differentiation, especially with dark colors.

    Start: Starts the measurement of the chart.

    Positioning

    Use Auto Positioning: The Barbieri Spectro LFP qb provides three positioning options. Enable the checkbox to select one of the automatic positioning options or disable the checkbox to manually position the head.

    Auto Recognition: The camera automatically recognizes the chart without the auto-position lines (requires the camera).

    Auto Positioning: The camera automatically detects the chart using the auto-position lines (requires the camera).

    Manual Positioning: Enter the position of the test chart corners manually.

    Auto Recognition (Automatic positioning by using the camera)
    Autopositioning is done by capturing an image with the camera and calculating the corner points.
    Note: If the picture processing fails, the device switches to the automatic positioning where the camera is used to detect the auto-position lines and determine the corner points.

    Auto Positioning (Automatic positioning by using the camera)
    In automatic positioning, the camera searches for the auto-position lines. Therefore, this option requires the chart to have the necessary auto-position lines in place.

    Manual Positioning
    Use the controls for the manual positioning on the right side to position the measuring head exactly above the upper left corner using the arrow keys or by entering the x/y coordinates. The measuring head should then be positioned on the outermost corner of the marked patch.

    Use the four arrows to change the position of the measuring head (left, right, up, down). The head can be raised and lowered with the double arrow in the center.

    Tip: Change the position of the head with the corresponding arrow keys on your keyboard.
    Steps: Specifies the distance covered by the measuring head when an arrow is clicked.

    Position: Moves the measuring head to the entered x/y coordinates.

    Once you are finished, click Next to specify the upper right corner of the chart.

    Confirm with Next.

    On the last page, enter the position of the lower right corner and confirm with Next.

    Multipage test charts

    Manual positioning

    If the test chart has multiple pages, a message appears after measuring a page prompting to place the next page on the table:

    1. Place the next test chart page on the table.
    2. Recalibrate the table and use the manual controls as described above to indicate two corners of the chart. The third corner is calculated automatically.
    3. Click Start to measure the next page.

    Important: If the second page was placed EXACTLY where the first page was, you can continue without recalibrating. The previously set coordinates will then be used again.

    Creating charts with Barbieri gateway and measuring using ColorAnt

    To create ColorLogic charts within Barbieri Gateway’s chart generator, including the auto positioning feature, follow the procedure below:

    Copy the ColorLogic charts to the user directory: Myuser>Documents>Barbieri>Gateway
    Start the Barbieri Chart Generator and select the reference file from the CLReferencesBarbieri folder.

    Add the desired options to the chart, e.g., auto positioning markings, reference area, etc., and Save the target file.

    Load the reference file into ColorAnt by dragging and dropping the .ref file onto the Data Sets window. The target file can be found in the Gateway>Targets folder.

    If the patches do not match the printed chart, right-click on the reference in the Data Sets window and select Swap Rows with Columns. Check the patch arrangement again in the View tool.

    Select the reference file and click Measure. Ensure that the correct chart has been selected. Select the Spectro LFP qb from the device list and click Connect.

    Once the device is connected, the Spectro LFP qb wizard will be displayed. Simply select auto positioning and click Start.

    Konica Minolta Devices

    Konica Minolta FD-7

    Measuring with the Konica Minolta FD-7

    Calibration

    Step 1: Select the device from the Selection drop-down list in the Device tab.

    Step 2: Click Connect.

    Step 3: Set the device on the white reference with the Target Mask attached. Correctly place it on the calibration tile and press it down. Click OK and keep the device pressed down until the measuring mode can be selected in the upper left-hand corner of the measuring window.

    Device options

    Once the device is connected and calibrated, the measurement options become available.
    Condition: M0, M1, M2.
    Direction: Specify the mode of the measurement.

    Measure

    Step 1: Select the device from the Selection drop-down list in the Device tab and perform the white calibration as described above.

    Step 2: Place the instrument in front of the first patch of the line to be measured and press the measure button of the instrument. Hold down the button and move the device over the strip until after the last patch. Release the button.

    Step 3: The data is transferred to the Measure Tool and you can proceed to the next line.

    Step 4: Once the measurement is complete, click on the Transfer icon to open the Transfer measurement dialog. Here the measurement data can be discarded or transferred to ColorAnt.

    Ambient Light Measuring

    Ambient light measurements can be performed either using the Measure Tool 2.0 or from within the CIE Conversion tool.

    Measure Tool: Select the Ambient Light Measurement mode from the menu Measure Mode or click on the light bulb icon next to the Selection drop-down menu.
    CIE Conversion: Select Emission (Measure) from the drop-down list Illumination. This will start the Measure Tool.

    Step 1: Select the device from the Selection drop-down list in the Device tab and perform the white calibration as described above. After calibration, confirm the message Please prepare the device for ambient light measuring.

    Step 2: Attach the ambient light head to the device.

    Step 3: Click on Measure.

    Step 4: Transfer the measured data to ColorAnt by clicking Transmit.
    The measured values will be displayed either in the panel Data Sets (when using the Measure Tool directly) or in the CIE conversion tool.

    Step 5 (CIE conversion only): Click on Start. The data of the ambient light measurement are used to convert the selected spectral data to the new viewing condition.

    Konica Minolta FD-9

    Measuring with the Konica Minolta FD-9

    Step 1: Select the FD-9 from the Selection drop down list in the Device tab.

    Step 2: Click on Connect.

    Using the Konica Minolta FD-9 over the network

    The Konica Minolta FD-9 can be connected to the local area network via Ethernet, which allows direct transfer of measurement data to computers on the same LAN/WLAN.

    Configure the network settings on the instrument according to the Konica Minolta FD-9 user manual.

    In the ColorAnt Measure Tool, select the Konica Minolta FD-9, click on the network icon and enter the IP address of the FD-9 in the address field. Click OK to establish the connection.

    Note: A USB connection always has priority. If the device is to be used via LAN/WLAN, disconnect the USB cable.

    Device options

    Once the device is connected, the Setup Wizard opens:

    Settings

    Measurement condition: M0, M1, M2, M3.

    Lines per page: Define the number of lines on your chart. If the chart contains several pages, define the number of lines of the first page.

    Number of pages: Automatically calculates the number of pages.

    Freeform: Put the chart on the table of your FD-9 and the device will recognize it automatically.

    Target: Requires the definition of the chart size, patches etc., and the FD-9 will search the page for a chart that fits the parameters.

    Measure

    Step 1: After connecting the device the Setup Wizard opens.

    Step 2: Define the settings and click Start.

    Step 3: The FD-9 will display a message to insert the chart. Insert the chart and wait until the measurement process is completed.

    Step 4: Once the measuring is complete the data will be displayed in the Measure Tool. Save the data and continue.

    Techkon Devices

    Techkon SpectroDens

    Measuring with the Techkon SpectroDens

    Important: Techkon devices are only available under Windows.
    Techkon devices also require the TechkonDeviceServer service from Techkon GmbH for operation which is available for download here: http://www.colorlogic.de/Seiten/Download/TDService.2.0.0.8.exe

    Step 1: Choose the device from the Selection drop-down list in the Device tab.

    Step 2: Click Connect.

    Step 3: Place the device on the white reference patch. Confirm by clicking OK.

    White Reference Calibration

    Device options

    Once the device is connected the Setup Wizard of the SpectroDens opens:

    Settings

    Measurement condition: M0, M1, M2, M3.

    Polarization Filter: Depending on your instrument version, the polarization filter can be adjusted manually or automatically. If this is purely automatic, the selection is grayed out and dependent on the selection of the measurement condition.
    Illuminant: Choose between A, C, D50, D65, F2, F7 and F11. Illumination depends on the measure condition.
    Observer: Choose between O2 and O10.
    Select how to measure the chart in the main window under Direction.

    Measure

    Step 1: In the Device tab, select the device from the Selection drop-down list and start the white calibration.

    Step 2: Place the device on the first patch of the line. Press down the measure button of the device and move over the line of patches until crossing the last patch in line. Release the button.

    Step 3: Data will be transferred to the Measure Tool. Continue with the next line.

    Step 4: Once the measurement is complete, click on the Transfer icon to open the Transfer measurement dialog. Here the measurement data can be discarded or transferred to ColorAnt.

    Techkon SpectroJet

    Measuring with the Techkon SpectroJet

    Important: Techkon devices are only available under Windows.
    Techkon devices also require the TechkonDeviceServer service from Techkon GmbH for operation which is available for download here: http://www.colorlogic.de/Seiten/Download/TDService.2.0.0.8.exe

    Step 1: Choose the device from the Selection drop-down list in the Device tab.

    Step 2: Click Connect.

    Step 3: Place the device on the white reference patch. Confirm and click OK.

    White Reference Calibration

    Device options

    Once the device is connected, the Setup Wizard for the SpectroJet opens:

    Settings

    Patch Width: Specify the patch width in millimeters.
    Gap Width: Enter the width of the patch separator in millimeters.
    Measure Condition: M0, M1, M2, M3.
    Polarization Filter: Depending on your instrument version, the polarization filter can be adjusted manually or automatically. If this is purely automatic, the selection is grayed out and dependent on the selection of the measure condition.
    Illuminant: Choose between A, C, D50, D65, F2, F7 and F11. Illumination depends on the Measure condition.
    Observer: Choose between O2 and O10.
    Select how to measure the chart in the main window under Direction.

    Measure

    Step 1: In the Device tab, select the device from the Selection drop-down list and start the white calibration.

    Step 2: Place the device on the first patch of the row. Press the measure button on the device once. Move over the row of patches until the last patch of the row.

    M0 & M3: Measuring the row one time is sufficient for accurate measurement.

    M1 & M2: The device display prompts for a second measurement to complete the dual measurement.

    Tip: If a measurement fails, retry by adding more distance before the first patch and behind the last patch.

    Step 3: Data will be transferred to the Measure Tool and continue measuring the next line.

    Step 4: Save the data once all the rows have been measured.

    X-Rite Devices

    X-Rite eXact

    Measuring with the X-Rite eXact

    Step 1: Choose the device from the Selection drop-down list in the Device tab.

    Step 2: Click on Connect.

    Step 3: If asked to do a white calibration, confirm by clicking on OK. White calibration is done by the device internally.

    White Reference Calibration

    Device options

    When the device connects, the eXact Setup Wizard opens:

    eXact Setup Wizard

    Settings

    Patch Width (mm): Automatically calculates the width of a single patch.

    Gaps Width (mm): Specify the gaps width in millimeters.
    Chart Width (mm): Specify the chart width in millimeters.
    Measurement Condition: M1 and M0/M2/M3. Use the slide switch on the unit to switch between the two available conditions – M1 and M0/M2/M3. In M0/M2/M3 mode, all available measurement conditions are measured in one pass.

    Once all settings have been made, you can select how the chart is to be measured in the main window under Direction.

    Measure

    Step 1: In the Device tab, select the device from the Selection drop-down list and start the white calibration.

    Step 2: Place the device on the first patch of the row and press down the folding mechanism of the device. This will start the measurement. Wait for the beep and, with the instrument pressed down, move over the strip to the last patch in the row. The measurement will stop automatically. Release the device.

    Step 3: The data will be transferred to the Measure Tool. Continue with the next line.

    Step 4: When the measurement is complete, click on the Transfer icon to open the Transfer measurement dialog. Here the measurement data can be discarded or transferred to ColorAnt.

    If several measurement conditions have been used, the results/measured values of the individual conditions can be selected and viewed in the drop-down menu next to the Transfer icon.

    Measure (single patch mode)

    To measure in single patch mode without the scan attachment, proceed as follows:

    Step 1: Select the device from the Selection drop-down list in the Device tab and start the white calibration.

    Step 2: After closing the settings dialog with OK, select the direction Patches – Line by Line under Options in the upper right corner of the main window.

    Step 3: Place the device on the first patch of the row and press down the folding mechanism of the device. This will start the measurement. After you hear the beep, you can lift up the instrument.
    Step 4: The data is transferred to the Measure Tool and you can continue with the next patch.

    Step 5: When the measurement is complete, click on the Transfer icon to open the Transfer measurement dialog. Here the measurement data can be discarded or transferred to ColorAnt.

    If several measurement conditions have been used, the results/measured values of the individual conditions can be selected and viewed in the drop-down menu next to the Transfer icon.

    X-Rite eXact2

    Measuring with the X-Rite eXact2

    Step 1: Choose the device from the Selection drop-down list in the Device tab.

    Step 2: Click on Connect.

    Step 3: If asked to do a white calibration, confirm by clicking on OK. White calibration is done by the device internally.

    White Reference Calibration

    Using the X-Rite eXact2 over the network

    The X-Rite eXact2 can be connected to the local area network via Ethernet, which allows direct transfer of measurement data to computers on the same LAN/WLAN.

    Configure the network settings on the instrument according to the X-Rite eXact2 user manual.

    In the ColorAnt Measure Tool, select the X-Rite eXact2, click on the network icon and enter the IP address of the eXact2 in the address field. Click OK to establish the connection.

    Note: A USB connection always has priority. If the device is to be used via LAN/WLAN, disconnect the USB cable.

    Device options

    When the device connects, the eXact2 Setup Wizard opens:

    eXact2 Setup Wizard

    Settings

    Measurement Condition: In M0/M1/M2/M3 mode, all available measurement conditions are measured in one pass.

    Patch Width (mm): Automatically calculates the width of a single patch.
    Gaps Width (mm): Specify the gaps width in millimeters.
    Chart Width (mm): Specify the chart width in millimeters.

    Once all settings have been made, select how the chart is to be measured in the main window under Direction.

    Measure

    Step 1: In the Device tab, select the device from the Selection drop-down list and start the white calibration.

    Step 2: Place the device on the first patch of the row and press the measuring button at the side. Press once in patch mode for single field measurement or keep pressed for strip measurement. Move over the strip to the last patch in the row. The measurement will stop automatically. Release the measuring button.

    Step 3: The data will be transferred to the Measure Tool. Continue with the next line.

    Step 4: When the measurement is complete, click on the Transfer icon to open the Transfer measurement dialog. Here the measurement data can be discarded or transferred to ColorAnt.

    If several measurement conditions have been used, the results/measured values of the individual conditions can be selected and viewed in the drop-down menu next to the Transfer icon.

    Measure (single patch mode)

    To measure in single patch mode without the scan attachment, proceed as follows:

    Step 1: Select the device from the Selection drop-down list in the Device tab and start the white calibration.

    Step 2: After closing the settings dialog with OK, select the direction Patches – Line by Line under Options in the upper right corner of the main window.

    Step 3: Place the device on the first patch of the row and press the measuring button of the device. This will start the measurement.

    Step 4: The data is transferred to the Measure Tool and you can continue with the next patch.

    Step 5: When the measurement is complete, click on the Transfer icon to open the Transfer measurement dialog. Here the measurement data can be discarded or transferred to ColorAnt.

    If several measurement conditions have been used, the results/measured values of the individual conditions can be selected and viewed in the drop-down menu next to the Transfer icon.

    X-Rite i1Pro 1

    Measuring with the X-Rite i1Pro 1

    Step 1: Choose the device from the Selection drop-down list in the Device tab.

    Step 2: Click Connect.

    Step 3:  Place the device on the white reference and click OK.

    White Reference Calibration

    Device Options

    As soon as the device is connected define the Measurement Condition.

    Settings

    Measure Condition: M0 (Single), M0/M1/M2 (Dual).
    Note: The measure condition can only be selected with the i1 Pro-2.
    Once all settings have been made, you can select how the chart is to be measured in the main window under Direction.

    Measure

    Step 1: Choose the device from the Selection drop-down list in the Device tab and perform white calibration.

    Step 2: Place your device in front of the first patch of the first row and press the measure button of your device. Keep the button pressed and move over the entire row. Release the button.

    Step 3: The data will be transferred to the Measure. Continue with the next row.

    Step 4: After measuring all rows save the data in Measure Tool.

    Step 5: When the measurement is complete, click on the Transfer icon to open the Transfer measurement dialog. Here the measurement data can be discarded or transferred to ColorAnt.

    If several measurement conditions have been used, the results/measured values of the individual conditions can be selected and viewed in the drop-down menu next to the Transfer icon.

    Dual Mode: If dual mode was selected each row needs to be measured twice. After measuring in one direction, the LED on the device indicates the direction to be measured next.

    X-Rite i1Pro 2

    Measuring with the X-Rite i1Pro 2

    Calibration

    Step 1: Select the device from the Selection drop-down list in the Device tab.

    Step 2: Click Connect.

    Step 3: Set the device on the white reference. Correctly place it on the calibration tile and click OK. The instrument will be calibrated.

    Device Options

    When the instrument has been connected, the Setup Wizard opens, showing the Measurement Options for the instrument.

    Use Zebra Ruler: Using the ruler improves the M0 single scan measurement, but is not required and can be deactivated with the checkbox. The ruler allows a more precise control of the position/speed of the measuring device, which reduces the risk of measurement errors.

    Ambient Light Measuring

    Ambient light measurements can be performed either using the Measure Tool 2.0 or from within the CIE Conversion tool:

    Measure Tool: Select the Ambient Light Measurement mode from the menu Measure Mode or click on the light bulb icon next to the Selection drop-down menu.

    CIE Conversion: Select Emission (Measure) from the drop-down list Illumination. This will open the Measure Tool.

    Step 1: Select the device from the Selection drop-down list in the Device tab and perform the white calibration as described above. After calibration, confirm the message Please prepare the device for ambient light measuring.

    Step 2: Attach the ambient light head to the device.

    Step 3: Click on Measure.

    Step 4: Transfer the measured data to ColorAnt by clicking Transmit.

    The measured values will be displayed either in the panel Data Sets (when using the Measure Tool directly) or in the CIE conversion tool.

    Step 5 (CIE conversion only): Click on Start. The data of the ambient light measurement are used to convert the selected spectral data to the new viewing condition.

    X-Rite i1Pro 3

    Measuring with the X-Rite i1Pro 3

    Calibration

    Step 1: Select the device from the Selection drop-down list.

    Step 2: Click Connect.

    Step 3: Set the device on the white reference. Correctly place it on the calibration tile and click OK. The instrument will be calibrated.

    Measurement Options

    When the instrument has been connected, the Setup Wizard opens, showing the Measurement Options for the instrument.

    Use Zebra Ruler: Using the ruler improves the M0 single scan measurement, but is not required and can be deactivated with the checkbox. The ruler allows a more precise control of the position/speed of the measuring device, which reduces the risk of measurement errors.

    Measurement Condition: M0/M1/M2 or M3. With the combined conditions M0/M1/M2 all available measurement conditions are always measured in a single step. To be able to measure in M3 mode, the corresponding polarisation filter head must be mounted to the instrument before connecting the instrument. The Measure Tool automatically detects which head is currently in use and sets the Measurement Condition accordingly.

    When all settings have been made, define how the chart is to be measured under Direction in the main window.

    Measure

    Step 1: Select the device from the Selection drop-down and perform the white calibration.

    Step 2: Under Options > Direction, select how you would like to measure the test chart. For measurements with the ruler we recommend the option Scan complete rows.

    Step 3: Place the instrument in front of the first patch of the row to be measured and press the measure button on the instrument. Keep the button pressed while moving the instrument across the strip and beyond the last patch. Release the button.

    Step 4: The data is transferred to the Measure Tool. Continue with the next row.

    Step 5: Once the measurement is complete, click on the Transfer icon to open the Transfer measurement dialog. Here the measurement data can be discarded or transferred to ColorAnt.

    ColorAnt allows the transmission of individual or all available measurement conditions. In the latter case, several data sets are transmitted. For easy differentiation, the measurement condition is appended to the file name of each data set.

    Ambient Light Measuring

    Ambient light measurements can be performed either using the Measure Tool or from within the CIE Conversion tool:

    Measure Tool: Select the Ambient Light Measurement mode from the menu Measure Mode or click on the light bulb icon next to the Selection drop-down menu.

    CIE Conversion: Select Emission (Measure) from the drop-down list Illumination. This will open the Measure Tool.

    Step 1: Select the device from the Selection drop-down list in the Device tab and perform the white calibration as described above. After calibration, confirm the message Please prepare the device for ambient light measuring.

    Step 2: Attach the ambient light head to the device.

    Step 3: Click on Measure.

    Step 4: Transfer the measured data to ColorAnt by clicking Transmit.

    The measured values will be displayed either in the panel Data Sets (when using the Measure Tool directly) or in the CIE conversion tool.

    Step 5 (CIE conversion only): Click on Start. The data of the ambient light measurement are used to convert the selected spectral data to the new viewing condition.

    X-Rite i1iO

    Measuring with the X-Rite i1iO

    Step 1: Choose the device from the Selection drop-down list in the Device tab.

    Step 2: Click Connect.

    Device options

    Once the device is connected the Setup Wizard of the i1iO opens:

    Settings

    Rows per page: Specify the number of rows. If the chart contains several pages, specify the number of rows of the first page.

    Gap Size (horizontal/vertical): Specify the width of vertical and horizontal gaps as required.

    Number of pages: Automatically calculates the number of pages.

    Measurement condition: M0 (Single), M0,M1,M2 (Dual).

    Note: M0 (Single) measurements support a minimum patch size of 7 mm wide and 6 mm high. In this mode every row is measured once. The different Dual modes need patches that are at least 8 mm wide and 7.5 mm high. The rows will be measured twice.

    Note: If you are using an older i1Pro (up to RevD), only the M0 mode is available. The dual measurement is only supported by the newer i1Pro-2.

    Measure

    Step 1: After selecting and connecting your device the Setup Wizard starts.

    Step 2: Specify the rows and gaps, then click Next to proceed.

    Step 3: On the next page define the Chart Corners (1 top left, 2 bottom left, 3 bottom right).
    Note: To avoid small measurement errors, the fourth chart corner can also be defined.

    Step 4: To define a corner, place the crosshairs of the slide in the middle of the corresponding patch (in the respective corner) and press the i1 measuring button once.

    Step 5: The Setup Wizard now continues with the next corner. Repeat step 4 for the lower left corner and then for the lower right corner.

    Information: If you need to correct corners click on Delete Corner Points.

    Step 6: After defining the corners begin measuring with Start.

    Step 7: When the measurement is complete, click on the Transfer icon to open the Transfer measurement dialog. Here the measurement data can be discarded or transferred to ColorAnt.

    If several measurement conditions have been used, the results/measured values of the individual conditions can be selected and viewed in the drop-down menu next to the Transfer icon.

    Multipage Test Charts

    Step 1: When measuring multilateral test charts, the Setup Wizard reopens after measuring the first page.

    Step 2: Put the next page on the iO table and make sure that the right chart image is selected. Define the Chart Corners again and start the measuring process by clicking on Start.

    Step 3: Repeat these steps until all pages are measured.

    Step 4: After measuring all pages of the test chart save the data for further processing.

    X-Rite i1iO3

    Measuring with the X-Rite i1iO3

    Step 1: Choose the device from the Selection drop-down list.

    Step 2: Click Connect.

    Device options

    Once the device is connected the Setup Wizard of the i1iO3 opens:

    Settings

    Scan Options

    Rows per page: Specify the number of rows. If the chart contains several pages, specify the number of rows of the first page.

    Gap Size (horizontal/vertical): Specify the width of vertical and horizontal gaps as required.

    Number of pages: Automatically calculates the number of pages.

    Measure Options

    Measurement Condition: M0/M1/M2 or M3. With the combined conditions M0/M1/M2 all available measurement conditions are always measured in a single step. To be able to measure in M3 mode, the corresponding polarisation filter head must be mounted to the instrument before connecting the instrument. The Measure Tool automatically detects which head is currently in use and sets the Measurement Condition accordingly.

    When all settings have been made, define how the chart is to be measured under Direction in the main window.

    More accurate (Patch by Patch): By activating the checkbox, a step-by-step single patch measurement is performed instead of a strip measurement.

    Measure

    Step 1: After selecting and connecting your device the Setup Wizard starts.

    Step 2: Specify the rows and gaps, then click Next to proceed.

    Step 3: On the next page define the Chart Corners (1 top left, 2 bottom left, 3 bottom right).
    Note: To avoid small measurement errors, the fourth chart corner can also be defined. To do so, please tick the checkbox Enable fourth corner.

    Step 4: To define a corner, place the crosshairs of the slide in the middle of the corresponding patch (in the respective corner) and press the i1 measuring button once.

    Step 5: The Setup Wizard now continues with the next corner. Repeat step 4 for the lower left corner and then for the lower right corner.

    Information: If you need to correct corners click on Delete Corner Points.

    Step 6: After defining the corners begin measuring with Start.

    Step 7: When the measurement is complete, click on the Transfer icon to open the Transfer measurement dialog. Here the measurement data can be discarded or transferred to ColorAnt.

    If several measurement conditions have been used, the results/measured values of the individual conditions can be selected and viewed in the drop-down menu next to the Transfer icon.

    Multipage Test Charts

    Step 1: When measuring multilateral test charts, the Setup Wizard reopens after measuring the first page.

    Step 2: Put the next page on the iO table and make sure that the right chart image is selected. Define the Chart Corners again and start the measuring process by clicking on Start.

    Step 3: Repeat these steps until all pages are measured.

    Step 4: After measuring all pages of the test chart save the data for further processing.

    X-Rite i1iSis 2/XL

    Measuring with the X-Rite i1iSis 2/XL

    Step 1: Select the i1iSis measuring device from the Selection drop down list in the Device tab.

    Step 2: Click on Connect. Once the device is connected, the Setup Wizard opens:

    Measurement Options

    Measurement condition: M0, M1, M2.

    Scan Options

    Page: Automatically calculates the number of pages. Shows the current page.

    Rows per page: Define the number of lines on your chart. If the chart contains several pages, define the number of lines of the first page.

    Patch width / height: Define the size of a patch in mm.

    Status Info

    Indicates the current stage of the measurement process.

    Measure

    Step 1: After connecting the device the Setup Wizard opens.

    Step 2: Define the settings and click Start.

    Step 3: The i1iSis will move to it’s startposition. Insert the chart and wait until the measurement process is completed.

    Step 4: Once the measuring is complete the data will be displayed in the Measure Tool. Select either Transfer and Quit to send the data to the Data Sets section and close the Measure Tool or continue with further measurements.

    ColorAnt allows the transmission of individual measurement conditions or all available measurement conditions. In the latter case, several data sets are transmitted. For easy differentiation, the measurement condition is appended to the file name for each data set.