CIE Conversion
Overview
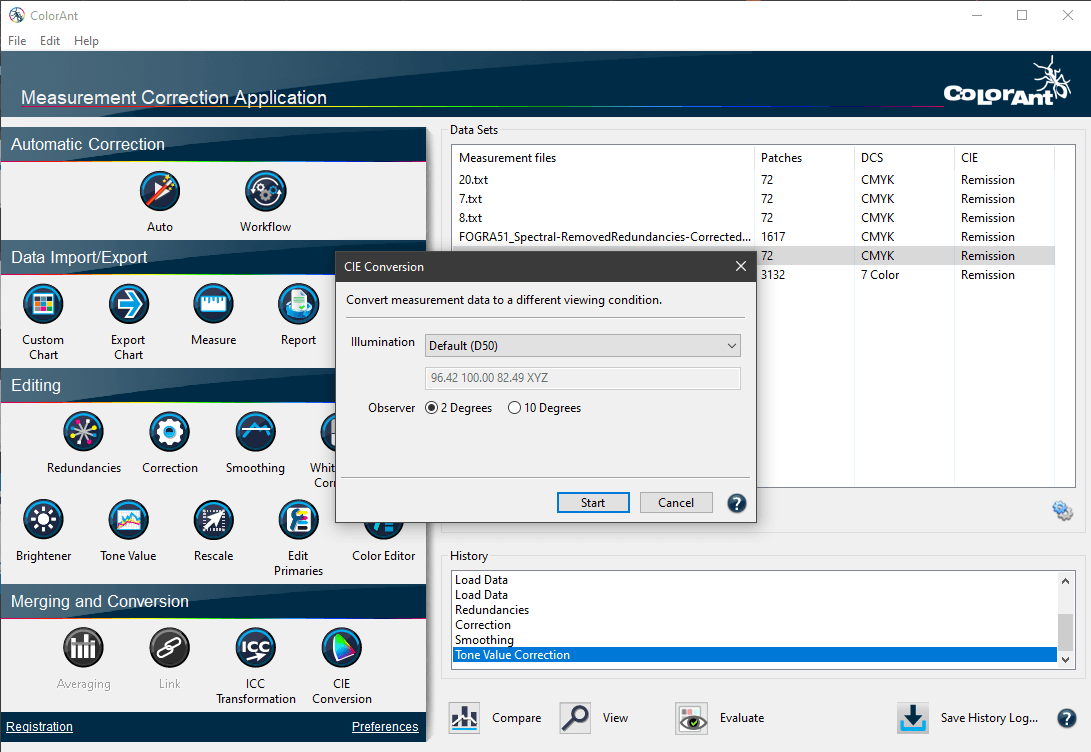
The CIE Conversion tool converts measurement data into another viewing condition.
Possible tasks can include the presentation of photos in a gallery under incandescent light (corresponds approximately to illuminant A) or displays under exhibition lighting, where the lighting consists of fluorescent light. Another task is to change the illumination and observer angle for the textile industry, where D65 and a 10-degree observer are used as standard.
The CIE Conversion can be applied to spectral or colorimetric data (XYZ or Lab). For colorimetric data it uses a Chromatic Adaption Transform (CAT) based on CIECAM02.
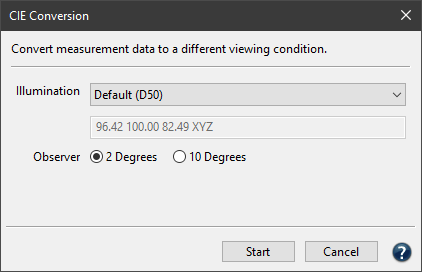
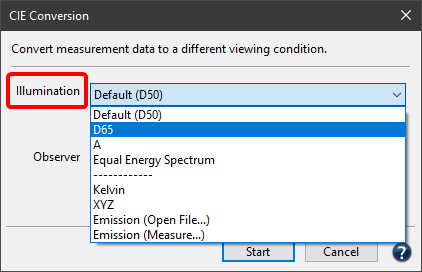
The Illumination/Source illumination/Target illumination drop-down menus contain the following options:
- A selection of a standard illuminant: D50, D65, illuminant A or the Equal Energy Spectrum. Typically, printer profiles are created for D50 viewing conditions.
- Manual input of Kelvin or XYZ values.
- Emission (Open File): Selection of spectral emission readings (as CxF or text file) of a specific light source. The data can be loaded or dragged and dropped onto the selection. ColorAnt can also extract data (the white point) from a measurement file and display these values.
- Emission (Measure): Opens the Measure Tool in Ambient Light Measurement mode. The ambient light can be measured directly from within the CIE Conversion tool using supported devices (e.g., X-Rite i1Pro, Konica-Minolta FD-7 and Myiro 1). For more information, see the Measure Tool help.
Observer: For spectral measurement data, the Observer can be changed from 2 degrees to 10 degrees. For colorimetric measurement data, the Observer cannot be changed.
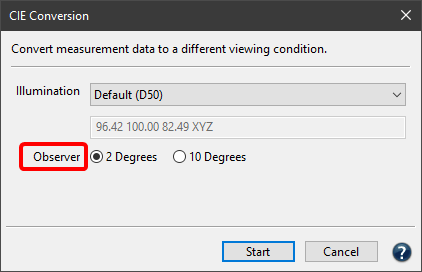
CIE Conversion with spectral measurement data
- Select a spectral measurement file of a test chart and open the CIE conversion.
- Under Illumination, select one of the predefined illuminants, or manually enter the measured illuminant as Kelvin value or XYZ value. You can also simply drag a measurement file (TXT and CxF3 file) of the measured light onto the value field. Alternatively, to select a spectral light measurement, select Emission (Open File) from the drop-down menu and select your measurement file in the subsequent dialog.
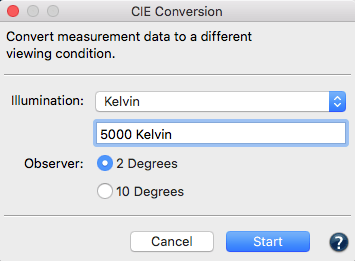
Note: If you choose to enter your own illumination, it is recommended to work with one of the two emission options, since spectral data is used throughout.
Multiple measurements of the same light source: If there are multiple measurements in a measurement file, it is best to use the Redundancy tool for averaging, to save the file and then use it as an Emission (Open File) in the CIE Conversion. - Under Observer, select the desired observer angle, 2 or 10 degrees.
- Click Start and the spectral measurement data are converted into colorimetric data for a specific viewing condition.
Resulting file: Spectral data are converted to Lab during CIE Conversion with the set Illumination and the selected Observer. The resulting measurement file contains only Lab values. You can then use this file to create profiles.
Note: Use the CIE Conversion as the last step due to the conversion of spectral data to Lab.
CIE Conversion with colorimetric data
- Select a colorimetric data file and open the CIE conversion.
- Set the illuminant of the measurement in the upper drop-down menu Source illumination and the desired viewing condition in the lower drop-down menu Target illumination.
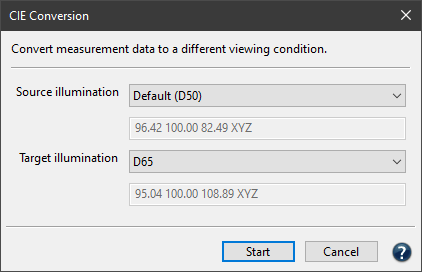
- The observer cannot be changed with colorimetric data.
- Click Start and the colorimetric data are converted into a different illumination using a color appearance model (Chromatic Adaption Transform (CAT) based on CIECAM02).
Note: Spectral measurement data achieve a better quality of the conversion, and, in addition, the observer can be changed.

