Tone Value
The Tone Value tool allows the correction of measurement data as well as the calculation of RIP compensation curves based on specific targets (e.g., G7®, ISO 20654 SCTV).
There are three different ways to ensure tone value correction is incorporated properly into measurement data. The curves created in this way are the final cut-back, compensation, calibration curves.
Note: It is not recommended to bend measurement data to a preferred standard without having printed so or without applying an appropriate RIP compensation curve.
Correction according to a tone value curve of an ICC profile:
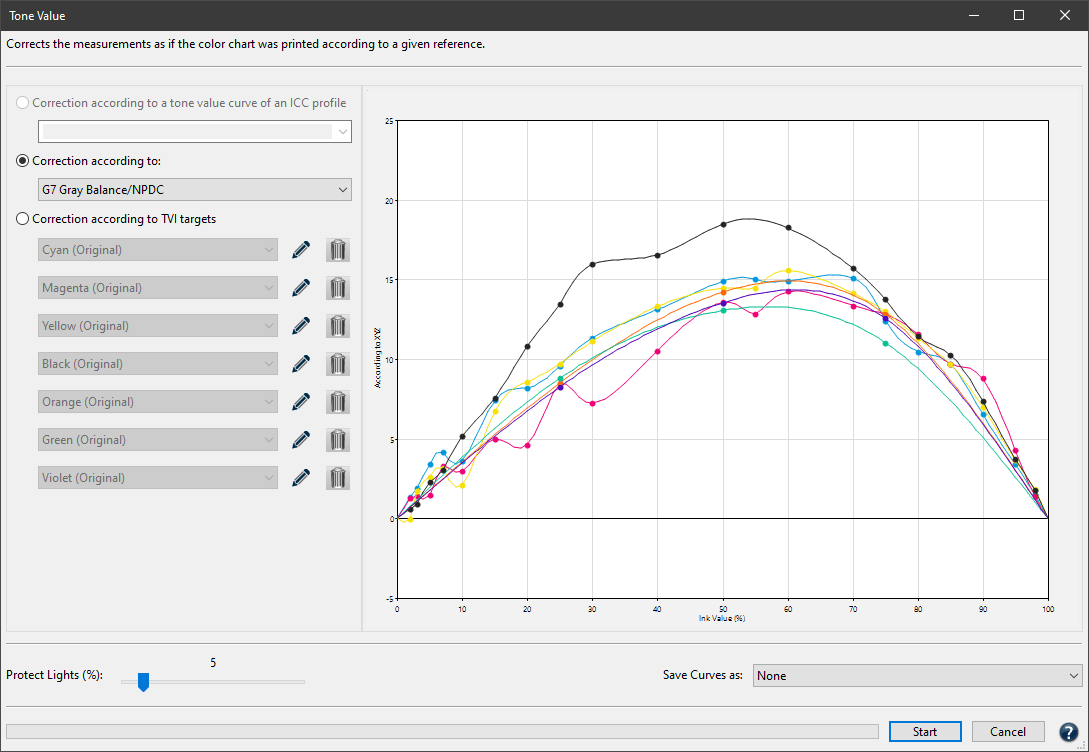
Specify a profile and the measured values or the RIP compensation curves are adjusted to achieve the same tone value increase curves as those of the selected profile.

Correction according to a profile
Note: Depending on the loaded measurement data only ICC profiles fitting the color space are shown (e.g., CMYK or multicolor. In this example a 7 inks multicolor profile is selected).
Correction according to:
Tone value curves are calculated to match the requirements of G7® Gray Balance or ISO 20654.

Correct Measurement data and RIP curves to given standards
G7® Gray Balance: The tone value curves are calculated to correspond to the gray balance conditions of the G7® method. The aim of the G7® method is to adjust the CMY curves in such a way that they result in as neutral a gray hue as possible with defined lightness over the entire gray balance.
ISO 20654: This method is based on colorimetric linearities and can be used instead of density calculations for spot colors. It can also be applied to CMYK and ensures that the gradations of all primary colors are colorimetrically linear. This can be checked in the View window under TVI or Curves.
Note: Density-based methods like Murray Davis do not work well with non-CMYK colors. The IS0 20654 method (also known as SCTV, Spot Color Tone Value) is an alternative method for handling the tone values of spot colors.
G7® + ISO 20654: G7 is defined to work with CMYK only. However, it is possible to apply the G7® method to the CMYK parts of a Multicolor measurement file and the additional (Multicolor) channels will be corrected according to ISO 20654. The G7® calibration method ensures that the CMY curves reach a neutral gray of defined lightness values throughout the entire gray balance curve.
ISO 20654 (Multicolor): Adjusts the Multicolor channels according to ISO 20654 and leaves the CMYK channels untouched. This is useful when the CMYK parts have been calibrated according to other standards, like PSO density curves or G7® and only the additional Multicolor channels need to match ISO 20654 (SCTV) requirements.
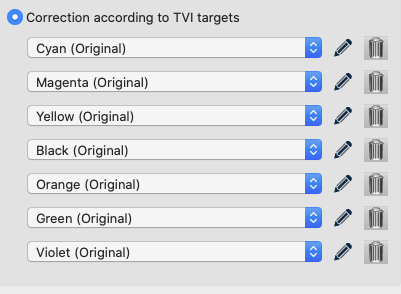
Correction according to TVI targets:
Manual editing of each channel allows predefining the increases in tone value to be incorporated in the measurement data.
This feature works for CMYK and multicolor color spaces. Depending on the data that was loaded into ColorAnt, additional or fewer channels are displayed.
Protect Lights (%): Leaves the highlights untouched when applying any of the three correction modes.
Specify the percentage up to which the highlights are to be protected. Review the measurement data to ensure a clean transition between the protected and unprotected area. This feature is especially helpful for Flexo printing as it avoids overcompensation of dot gain in the highlights.
Save Compensation Curves as: TVI correction curves can be saved as Text, ACV or XML files. Select None, if the curves are not to be saved.

Important: These curves have to be used in the RIP to implement the corrections. Further information can be found below in the chapter Combining Print Characterization and Compensation Curve Calculation.
Text: CGATS-compliant ASCII text. Used for direct import into RIP software or prepress workflows, e.g., HYBRID CLOUDFLOW.
ACV: Saves curves in the Photoshop ACV format.
XML: Saves curves as XML files according to ISO 18620.
Note: These curves are automatically saved in the folder /Users/USERNAME/Documents/ColorAnt/Linearity on macOS systems or C:/Users/USERNAME/Documents/ColorAnt/Linearity on Windows PCs. They can then be used in either Adobe Photoshop or any external RIP software that supports the ISO 18620 standard. ZePrA also supports the exported ACV or XML curve formats in the Gradations dialog.
Correction of Tone Value Increase Curves through Presetting
With the method Correction according to TVI targets, you can edit and smooth tone value increase curves, add or remove individual control points, and transfer curves from one channel to another. You can also compare the original and modified curves. You can save curves and apply them to other data and channels. The tone value curves are displayed according to the calculation method selected in the Settings.
Apply curves to other data or channels
Procedure:
- Open the measurement and click on Tone Value. The channel names correspond to the names of the measurement file or are determined automatically by ColorAnt if the channel names are undefined.
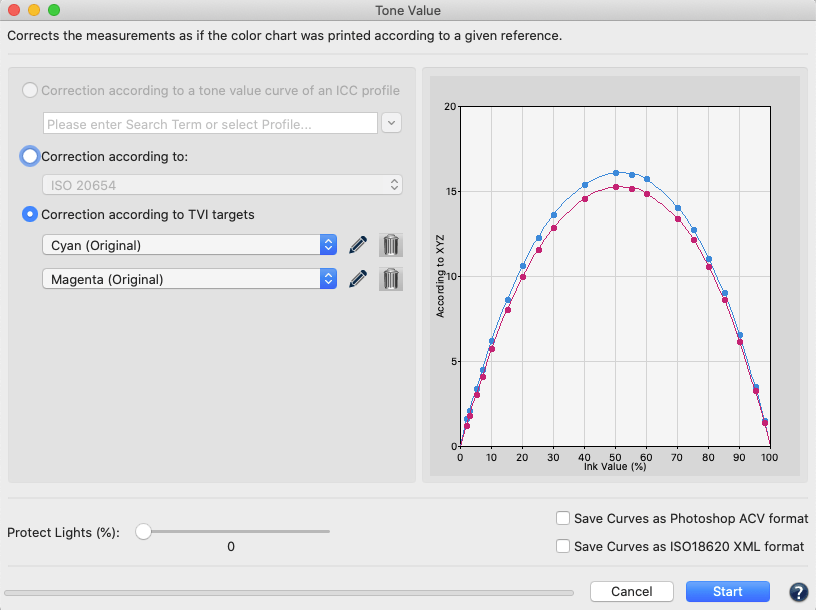
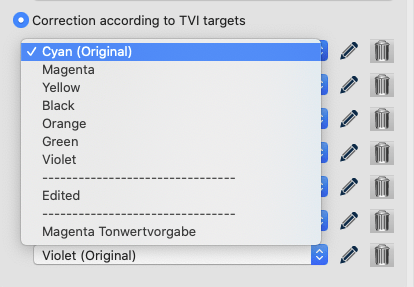
- To transfer a curve shape from one channel to another, simply select the desired curve from the drop-down list of the channel to be changed, for example Cyan, to apply the Cyan curve to the Magenta (original) channel. You can also apply a previously saved (and possibly optimized) curve from another data set to the Magenta (original) channel, here for example the Magenta Tonwertvorgabe curve.
- After curve transfer, you will see the curve shape of the new Magenta curve (colored) and the original Magenta curve (grayed out).
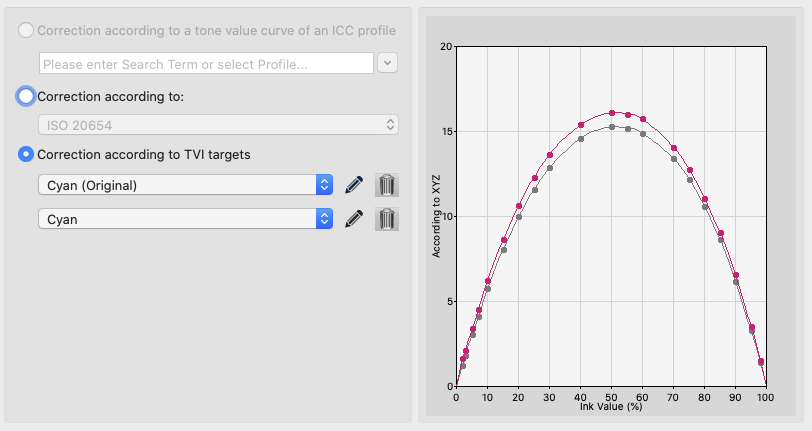
- To make further (manual) corrections to a channel, such as Smoothing, or to remove control points, or to change individual values, click on the pencil icon or select Edited from the drop-down menu. The Custom Tone Values – Edited window opens. For information on how to make manual corrections, see Custom Tone Value – Edited below.
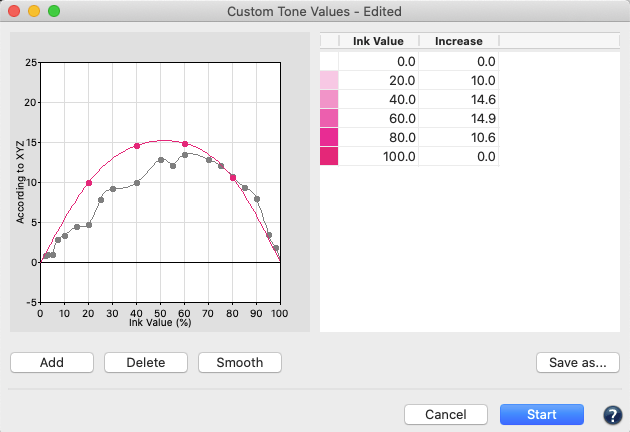
- To undo changes, select (in this example) the entry Magenta (Original) from the drop-down list.
When you have finalized your edits, apply them to the measurement data by clicking Start.
Custom Tone Value – Edited
ColorAnt’s Custom Tone Value feature is specifically designed for manual corrections such as smoothing, adding or deleting points or changing individual TVI values. In addition, save custom curves and apply them on other channels and data.
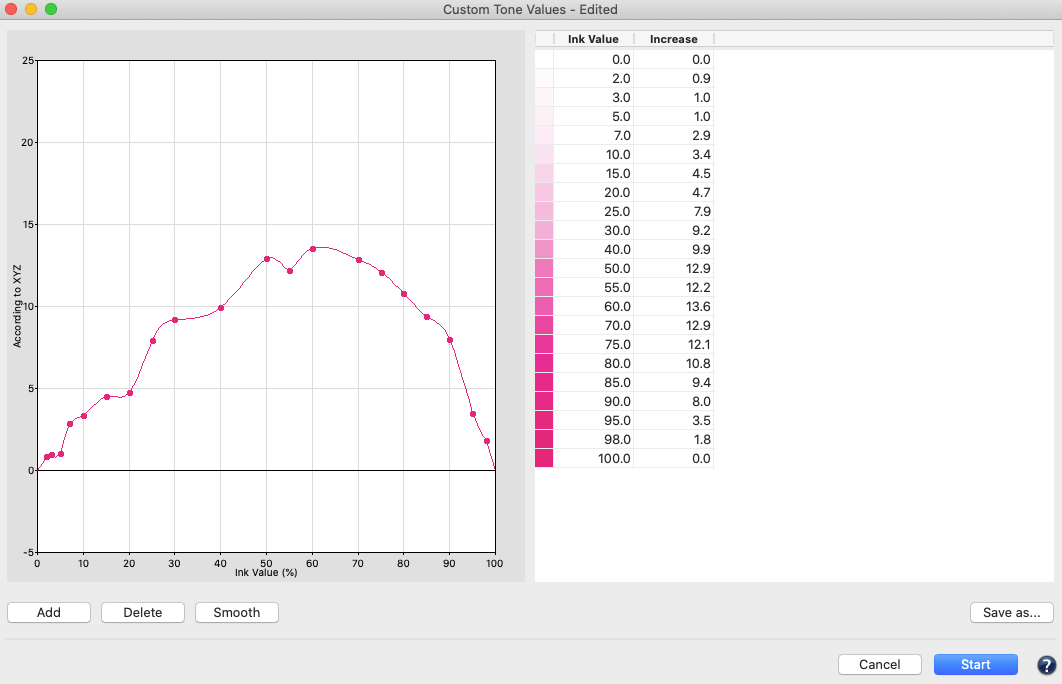
Procedure:
- Click on the Smooth button to smooth the curve. Only a few fulcrums are displayed after smoothing; ColorAnt does not delete any original fulcrums but helps to better optimize the data by reducing the number of values. Apply the corrections on the measurement data and all fulcrums will be adjusted to fit the smoothed curve.
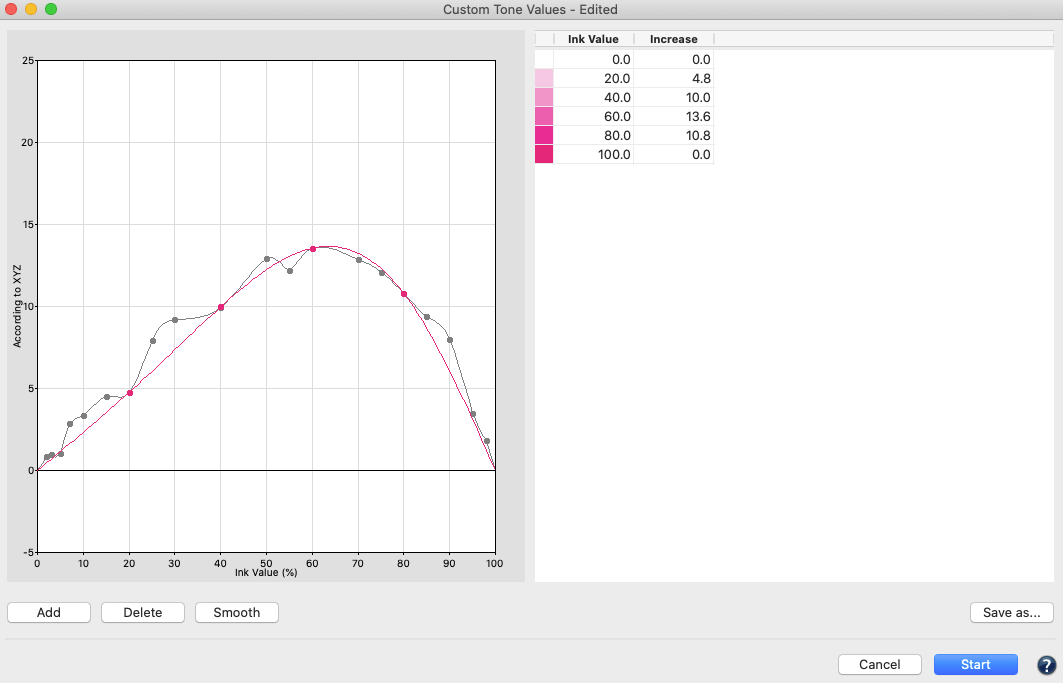
- In order to add any number of additional ink values, click on the Add button. Navigate to the new empty entry that will appear in the table and type in the desired Ink Value and the Increase value in dot percentage required. Apply the changes by hitting the tabulator or the enter key on the keyboard. The curve will be immediately updated.
Note: The original curve will be displayed in gray as a reference. - Change any of the existing Increase values in the table by simply selecting an entry and changing the numbers.
- To delete an Ink Value, select the desired entry in the table and click Delete.
- Save the curve for later use. Click on Save as and enter a name for the curve in the appearing dialog.
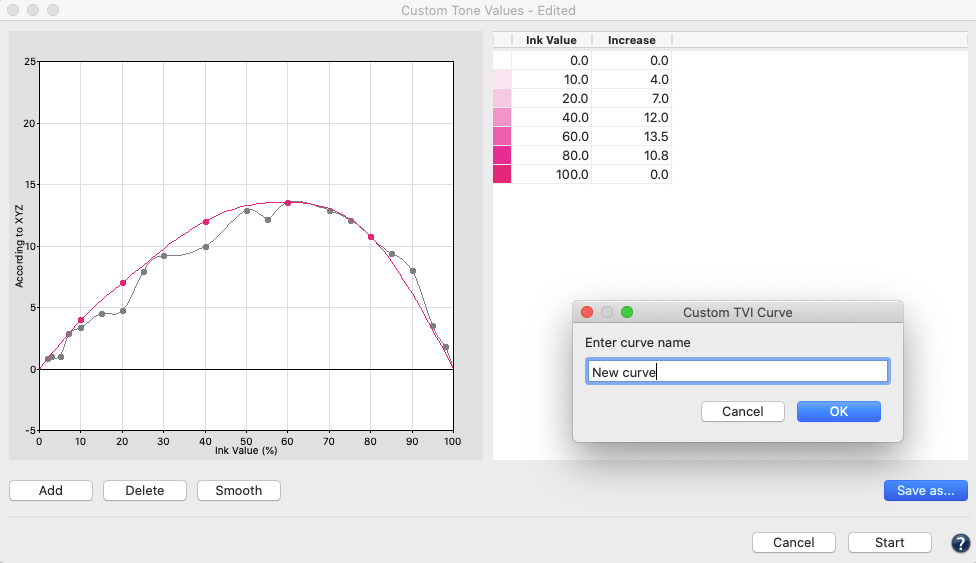
- To apply the manual editing, click on OK and return to the Tone Value dialog. The edited curve will be marked as Edited.
Combining Print Characterization and Compensation Curve Calculation
- The ColorAnt TVI correction can be used to combine RIP compensation curves and print characterization in a single print run.
- Print a test chart for characterization/linearization with the RIP in linear mode
- Measure the test chart (These measurement data represent the linear print process)
- Smooth the measurement data (with the Smoothing tool)
- Open the Tone Value TVI correction tool
- Choose Correction according to a tone value curve of an ICC profile and select the target curve for the printing process
- Export the compensation curve in the format the RIP can read (e.g., Text for HYBRID Cloudflow)
- Apply the TVI correction to the measurement data (the measurement data represent the compensated print)
- Load the compensation curve into the RIP
The corrected measurement data can be used, for example, to create a proofing profile that represents the compensated printing process instead of the linear printing process.


