

Updating a Profile
Overview
The Update Profile tool allows creation of optimized ICC printer profiles for RGB, CMYK and Multicolor color spaces, without the need to be a color management expert. Easily adjust the users current printing condition to any given print standard including both international and house standards. Generate an updated profile based on a printer profile with just a few color measurements quickly and easily. Soft and digital proofs will simulate how customer data will be reproduced on the users printing machine and digital printing will produce great color results as well. No matter how the printing variables change, be it a change in the substrate, a color or other parameters, the Update Profile tool and the professional conversion of print data via Correction DeviceLinks created with CoPrA provides a solution.
Profile Updating Examples
- Adapting to a different paper white
- Adjustment to a different tone value based on a different substrate
- Compensation of color shifts due to a different ink
- Creation of house standards based on standard profiles
- Optimizing color reproduction in digital printing
Principal Approach
- Select the printer profile to be updated.
- Print a small update test chart on the printer to be updated, followed by measuring the chart.
- Select the desired profile settings.
- Calculate the updated printer profile.
- Optional: Create a Correction DeviceLink Profile based on the printer and the updated profile to adjust print data to the color changes.
Note: Creation of DeviceLinks requires the tool DeviceLink which is included in the packages CoPrA L, XL and XXL.
Details on Updating Profiles
Detailed procedure for Updating Profiles
- Print an Update Profile test chart on the printer to be updated. Please use the included Update Profile test charts located in the folder Update Profile (menu Tools > Open Testcharts folder > Update Profile). Even though Update Profile test charts contain relatively few color patches, they are able to produce very accurate profiles.
Note: When printing the test chart please make sure to deactivate all color management conversions and use the same calibration, CtP or printer driver settings as those of the existing printer profile. - Alternatively, create a custom Update Profile test chart in ColorAnt (using the tools Custom Chart and Export Chart). Select the mode Profile Updating in the tool Custom Chart to ensure that the minimum required number of color patches is used.
Note: ColorAnt is included in the packages CoPrA M and higher, or standalone. - Select the tool Update Profile from the sidebar.
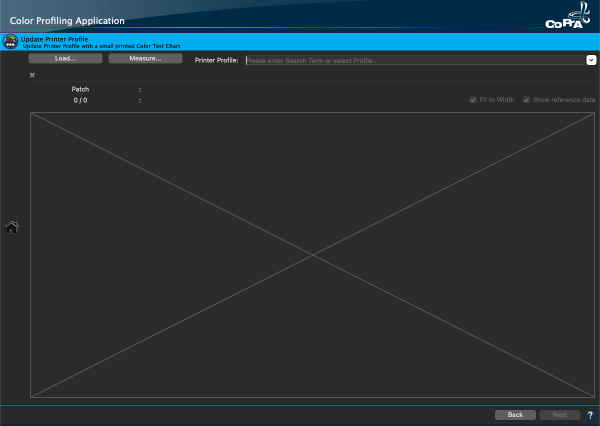
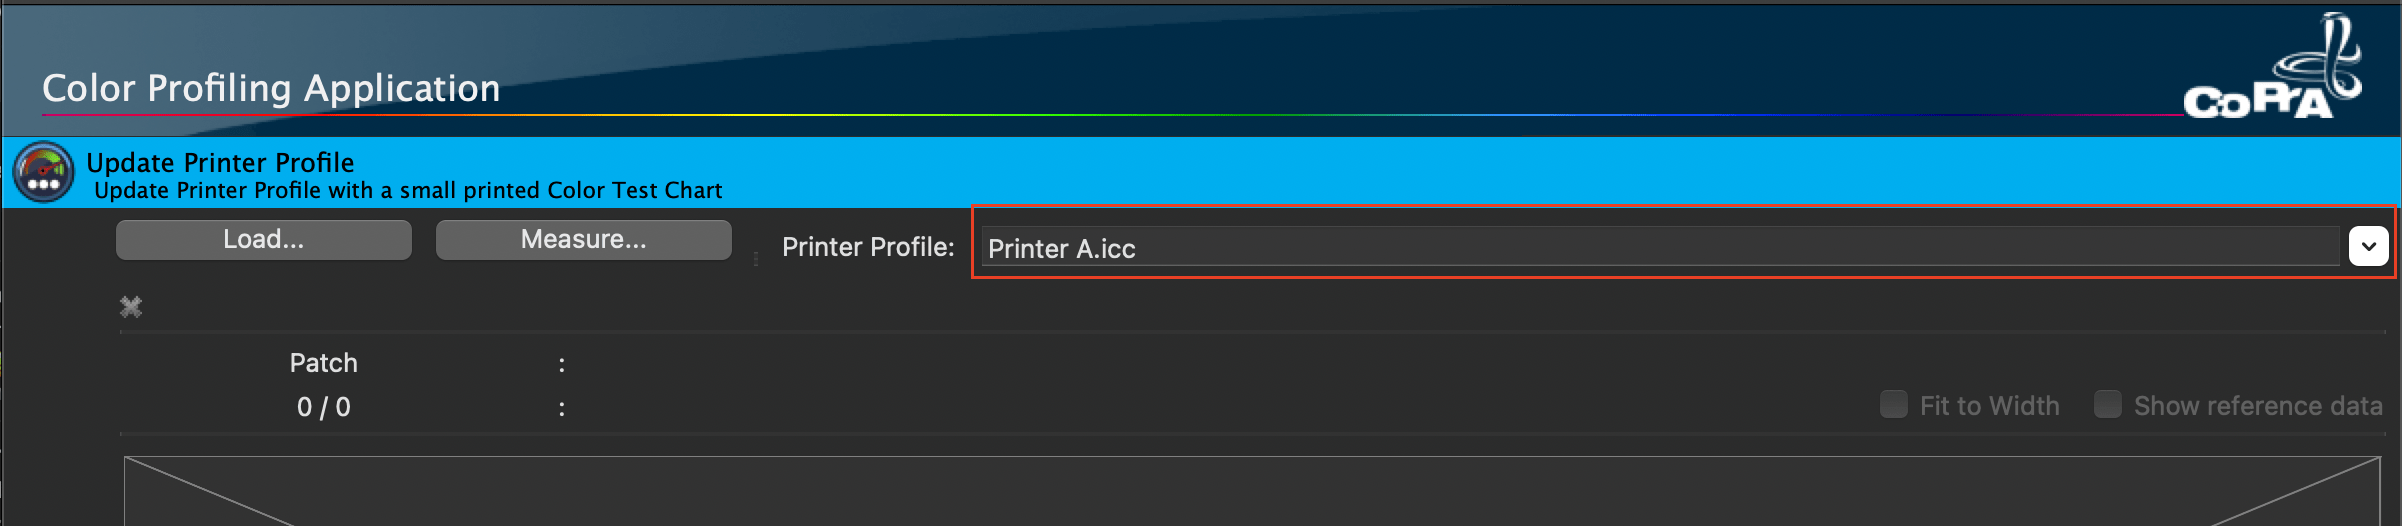
- Select the printer profile to be updated from the drop-down menu Printer Profile.
- Measure the printed Update Chart or click Load to import the measurement data of an Update Chart that has previously been measured and optimized.
- After the measurement data has been imported, a Match score is displayed in front of the selected profile name.
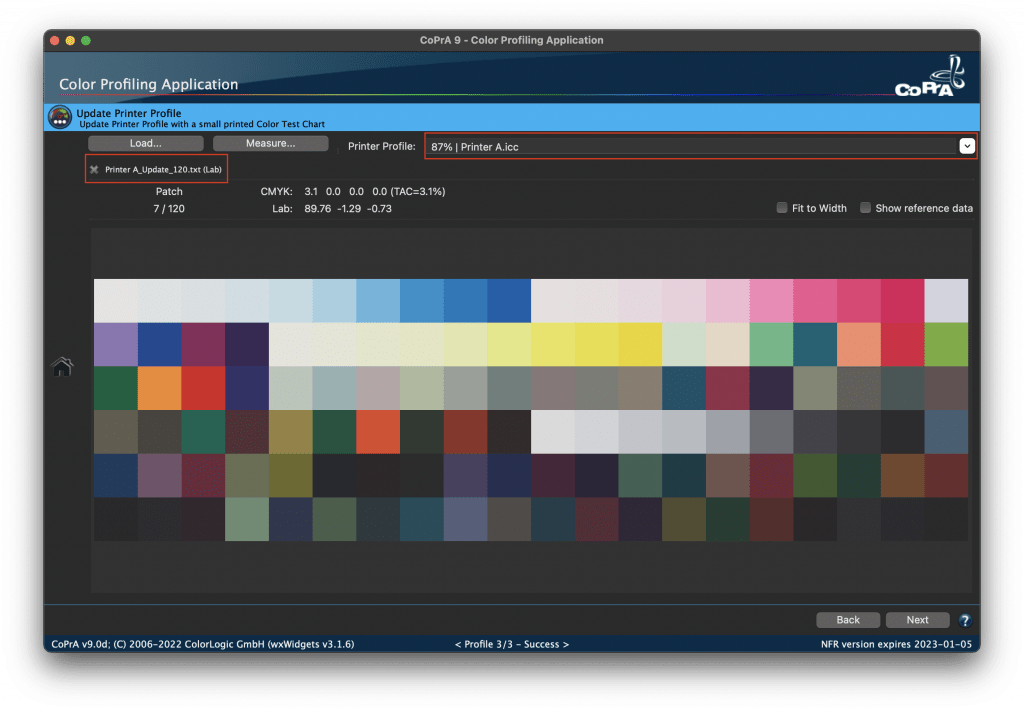
The Match between the measurement values and the gamut of the Printer Profile is specified in percentage for all profiles of the drop-down menu.
Note: Based on the selected measurement data only profiles with matching color space are displayed (RGB, CMYK, Multicolor). Please note that the best matching profile may not be the correct profile!
Note: All profile drop-down menus function like search fields. Simply type in some letters of the desired profile and only those profiles containing these letters will be shown in the list. To select a profile simply click on it.
Alternatively, you may open the drop-down menu and select a profile from the full list as usual. - Click Next to proceed.
- The 2D view of the gamut shows the measurement points of the Update Profile test chart and the gamut border of the selected reference profile. If there is a very high match of about 90 to 100%, the measurement values are in good agreement with the gamut of the original printer profile.
Note: If you are unsure whether you require an updated printer profile, simply print out an Update Profile test chart, measure it and check the Match between your printer profile and the measurement values. If there is a match of 90% or more a new printer profile is usually not required.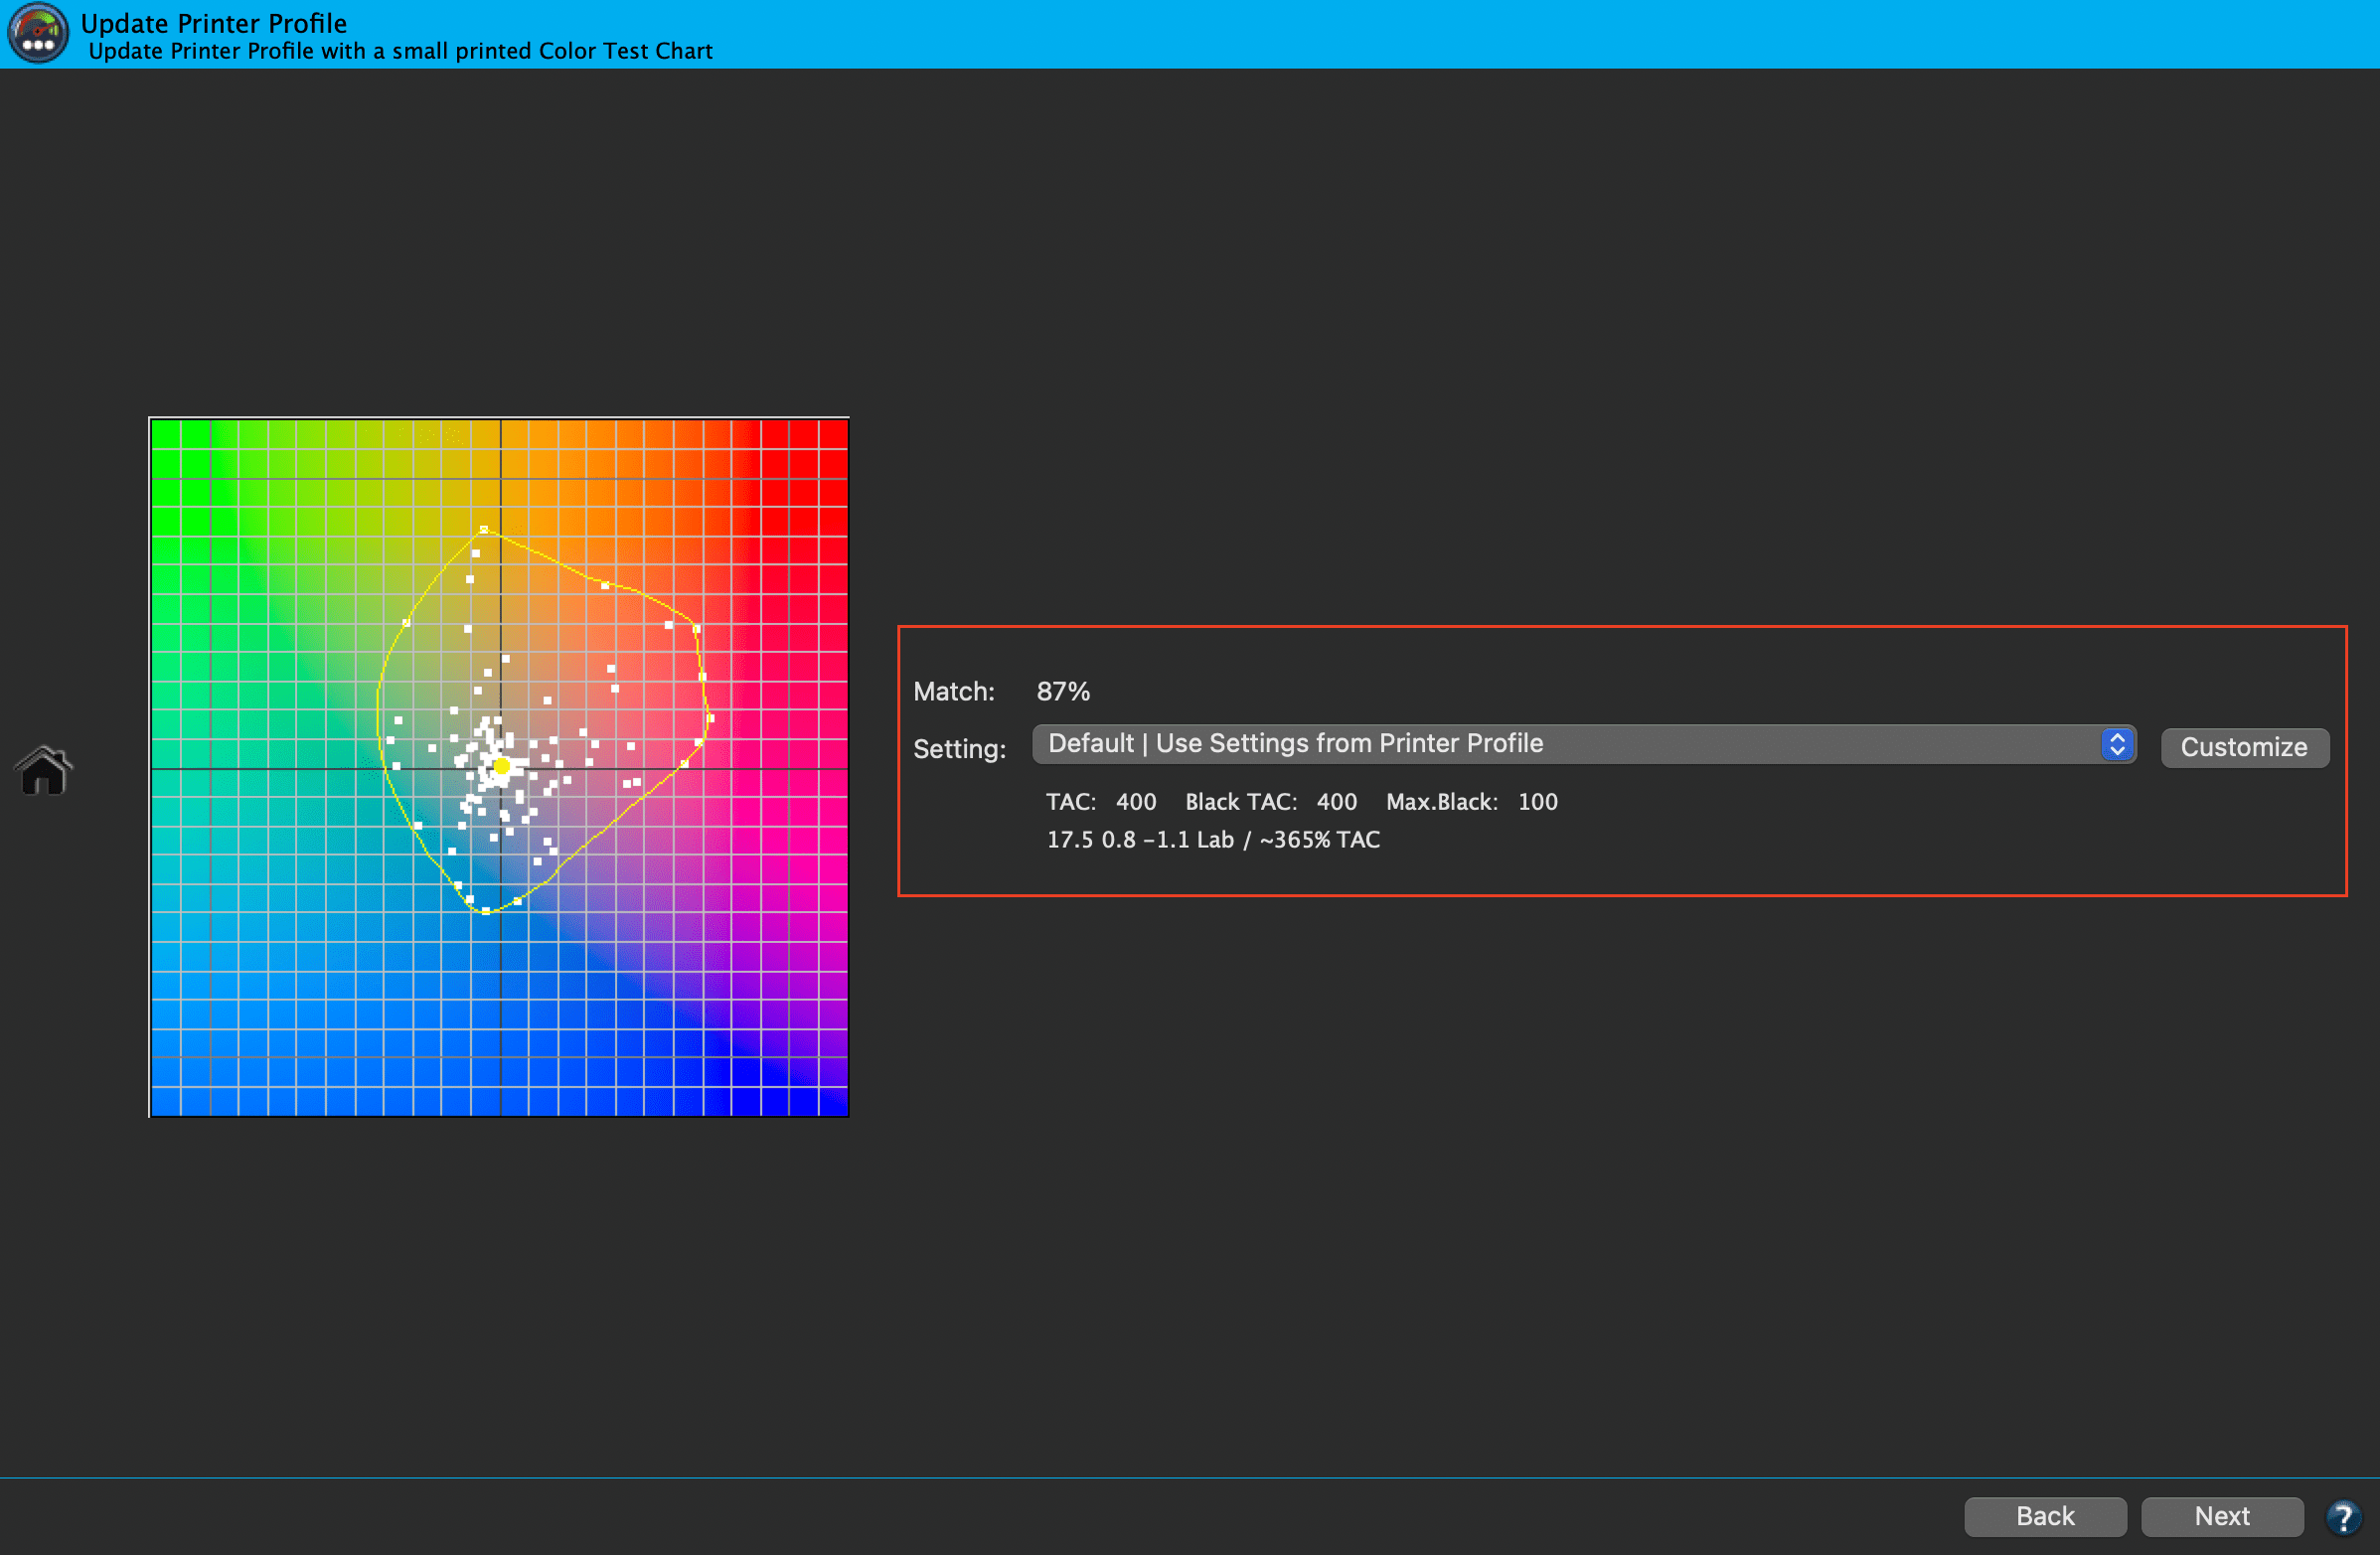
- Select a Setting for the printer profile to be updated from the drop-down menu. This Setting affects the gamut mapping, separation, total area coverage (TAC), Black Point (Black-TAC) and the Max.Black value (among others). The values for the last three profile parameters are shown below the drop-down menu. It is recommended to use the setting Default I Use Settings from Selected Printer Profile, as it will use same settings for the updated profile as in the original printer profile.
Note: The CoPrA Basic package allows the selection of the desired preset from the Setting drop-down menu. The CoPrA M and higher packages allow access to all parameters of the profile, which can then freely be changed. To adjust these profile parameters, select Customize. The tab General allows configuration of the settings for Perceptual Rendering, Measurement Processing, Viewing Condition and Highlights. In the tab Color Generation the settings for Color Generation, total area coverage (TAC), black point (Black-TAC) and the Max.Black value can be adjusted. - Click Next once the required settings have been applied.
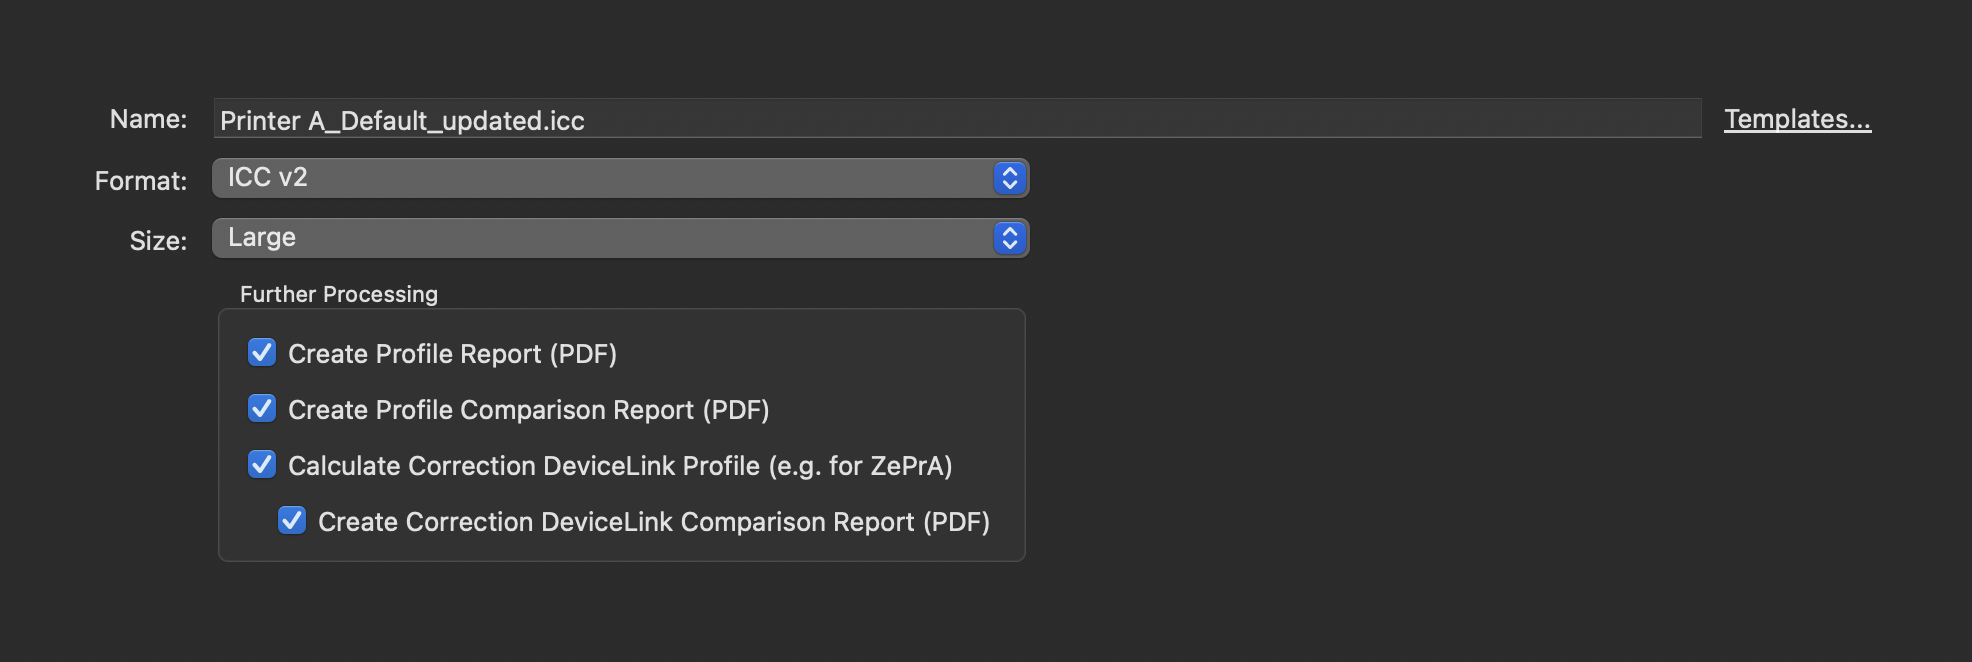
- Various settings for the profile calculation can be defined in the upcoming window, such as Name, Format, Size and Further processing. The identifier ‘updated‘ is added to the name to mark the updated profile as such.
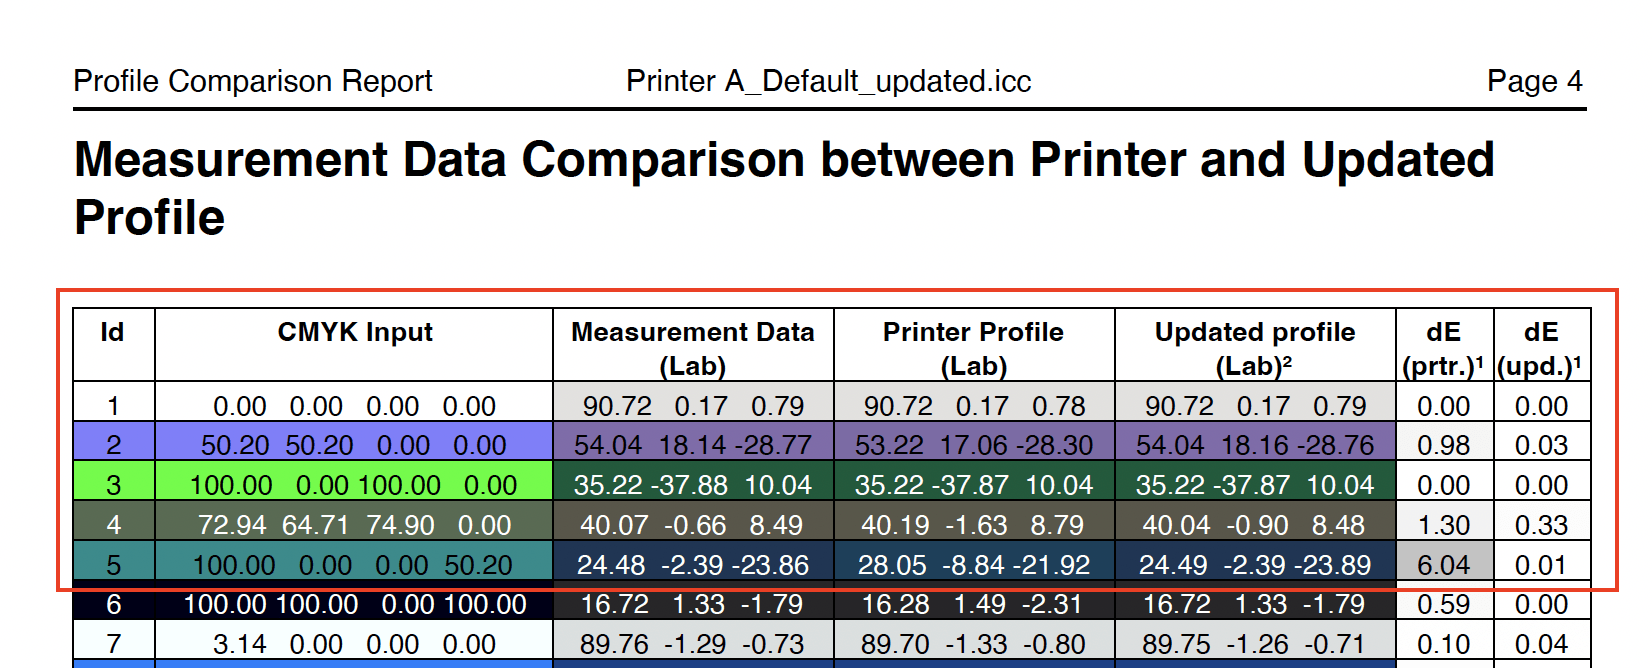
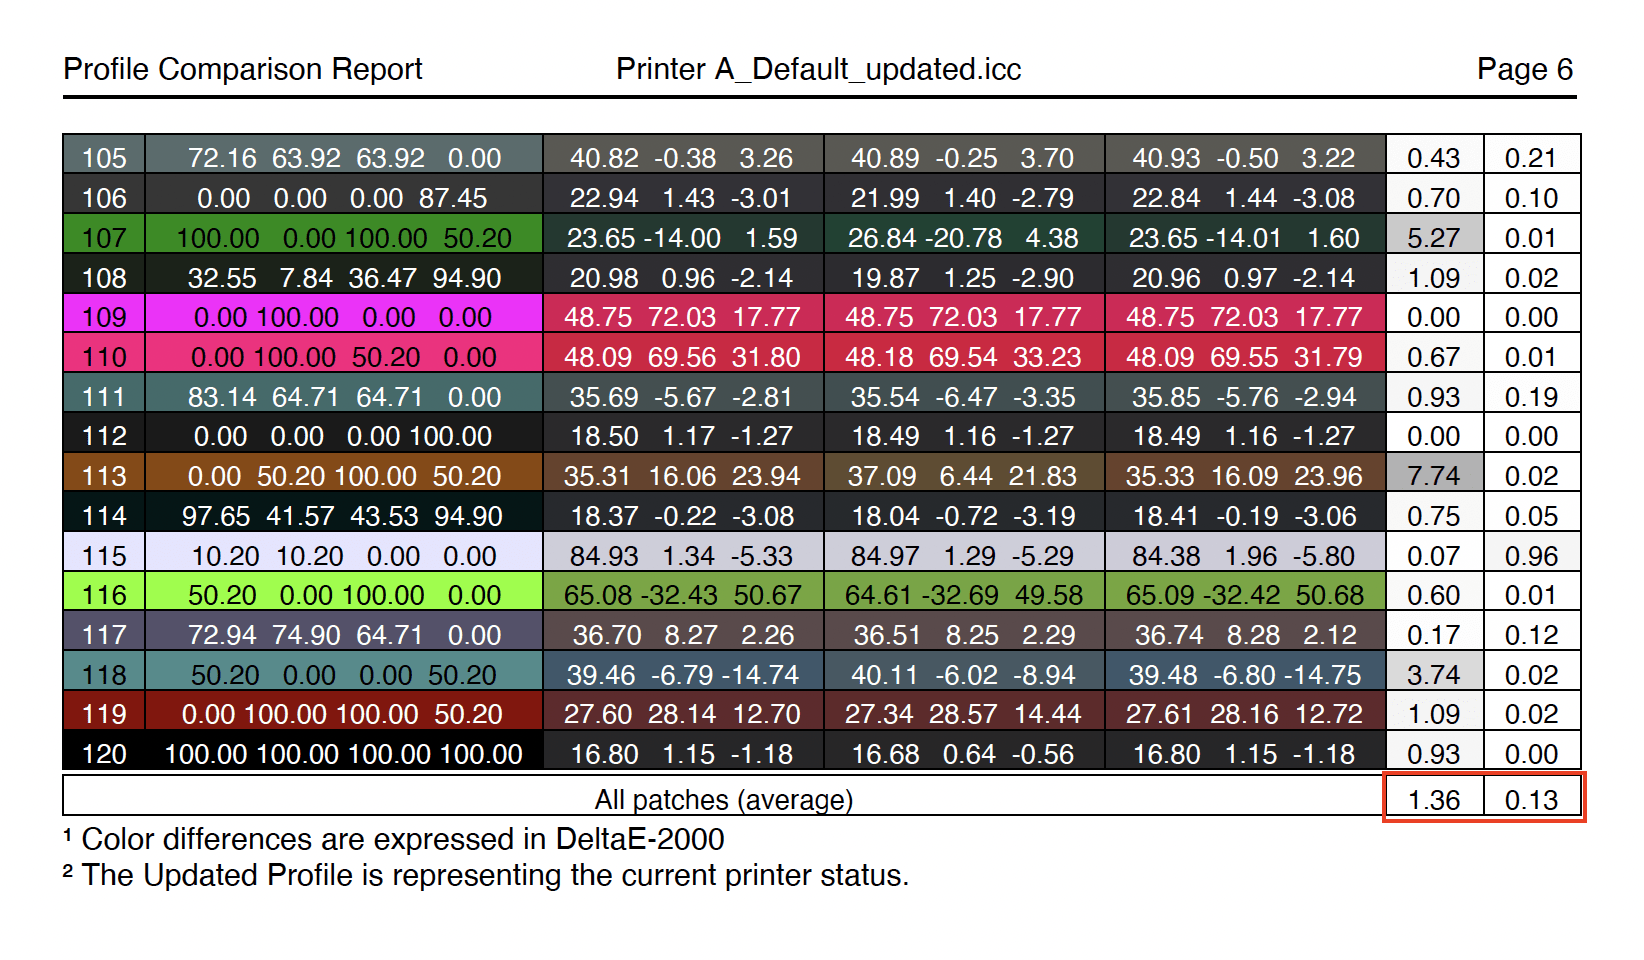
- A Profile Comparison Report can be created in addition to or as an alternative to a Profile Report. It provides information about the extent to which the printer profile and the updated profile reflect the measurement data and the improvements that can be achieved using the updated profile.
- A Correction DeviceLink Profile can be created for the updated printer profile at the same time. It allows the adjustment of the print data to compensate for color deviations and achieve a color reproduction that accurately reflects the reference profile before the color changes. Using a Correction DeviceLink Profile ensures a consistent color reproduction.
Note: The Correction DeviceLink Profile will be created automatically assigning the name automatically as well. The assigned profile name consists of the source and target profile and the name of the default setting (for example, Digital Printer, InkJet, etc.). If a different name is preferred, or if settings need to be edited, the Correction DeviceLink Profile can be created manually (using the tool DeviceLink Profiling). The Correction DeviceLink can then be selected in the color server ZePrA under Configurations in the tab Document/Target in the Target Color Space section as Correction DeviceLink Profile. - A Correction DeviceLink Comparison Report can be created in addition to the profile.
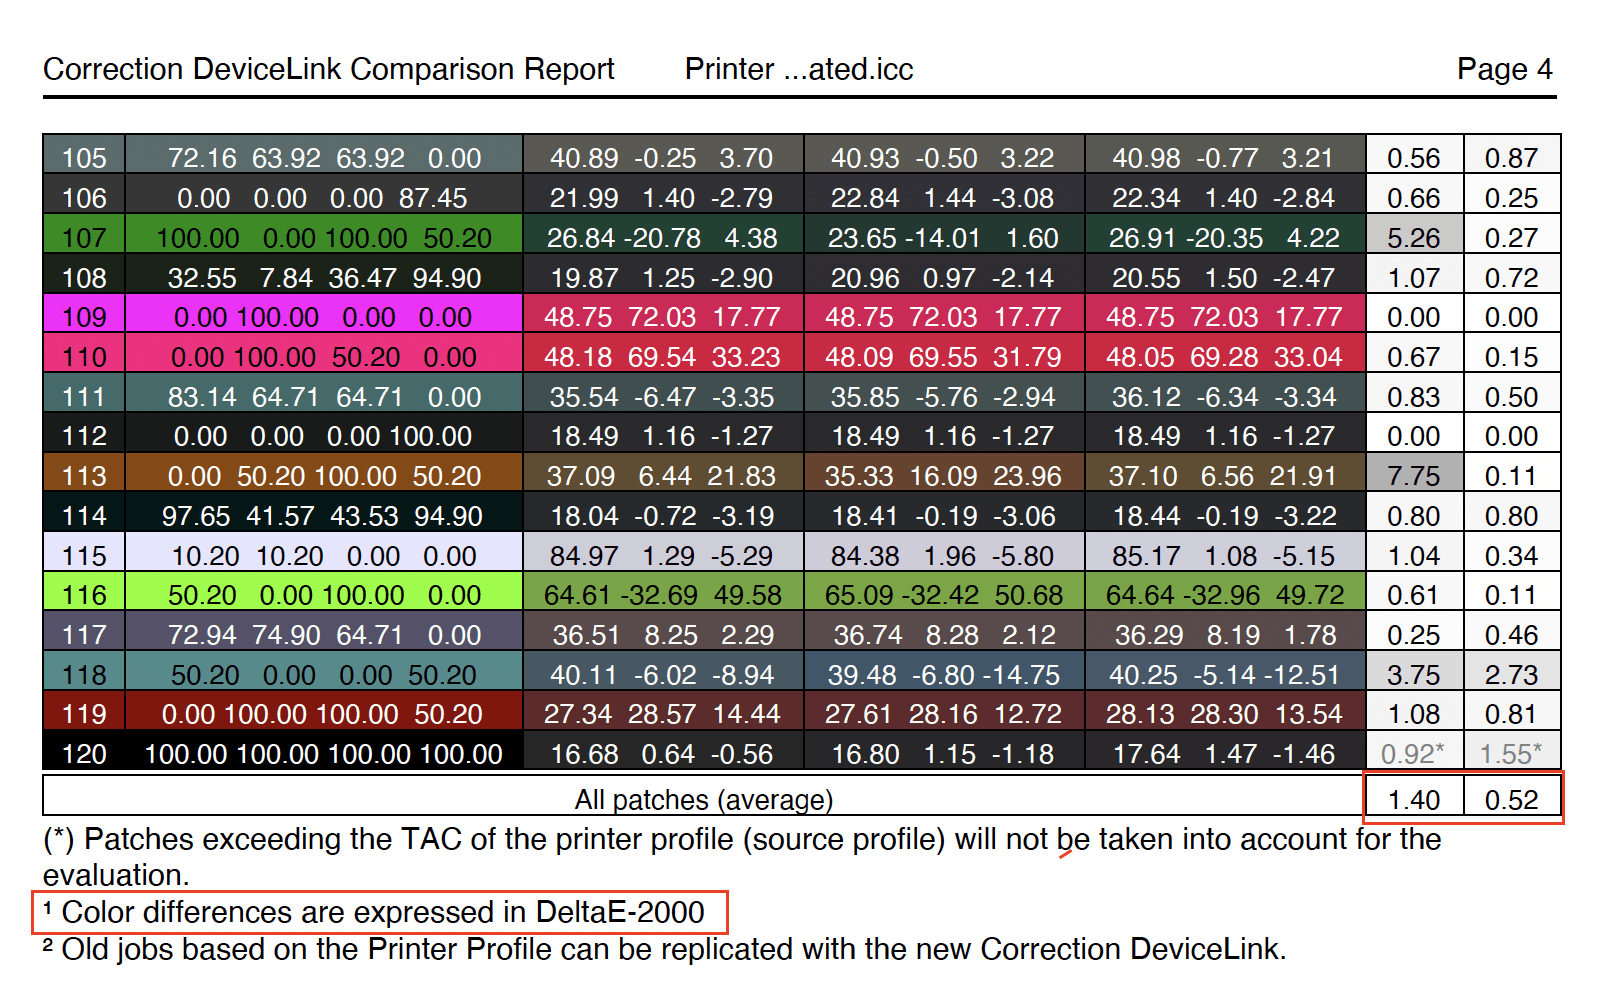
In the Comparison to Printer Profile (Updated Profile and Correction DLP) section of the comparison report, the Match score shows the quality of the Correction DeviceLink Profile to reproduce previous jobs with the new Correction DLP as well as possible.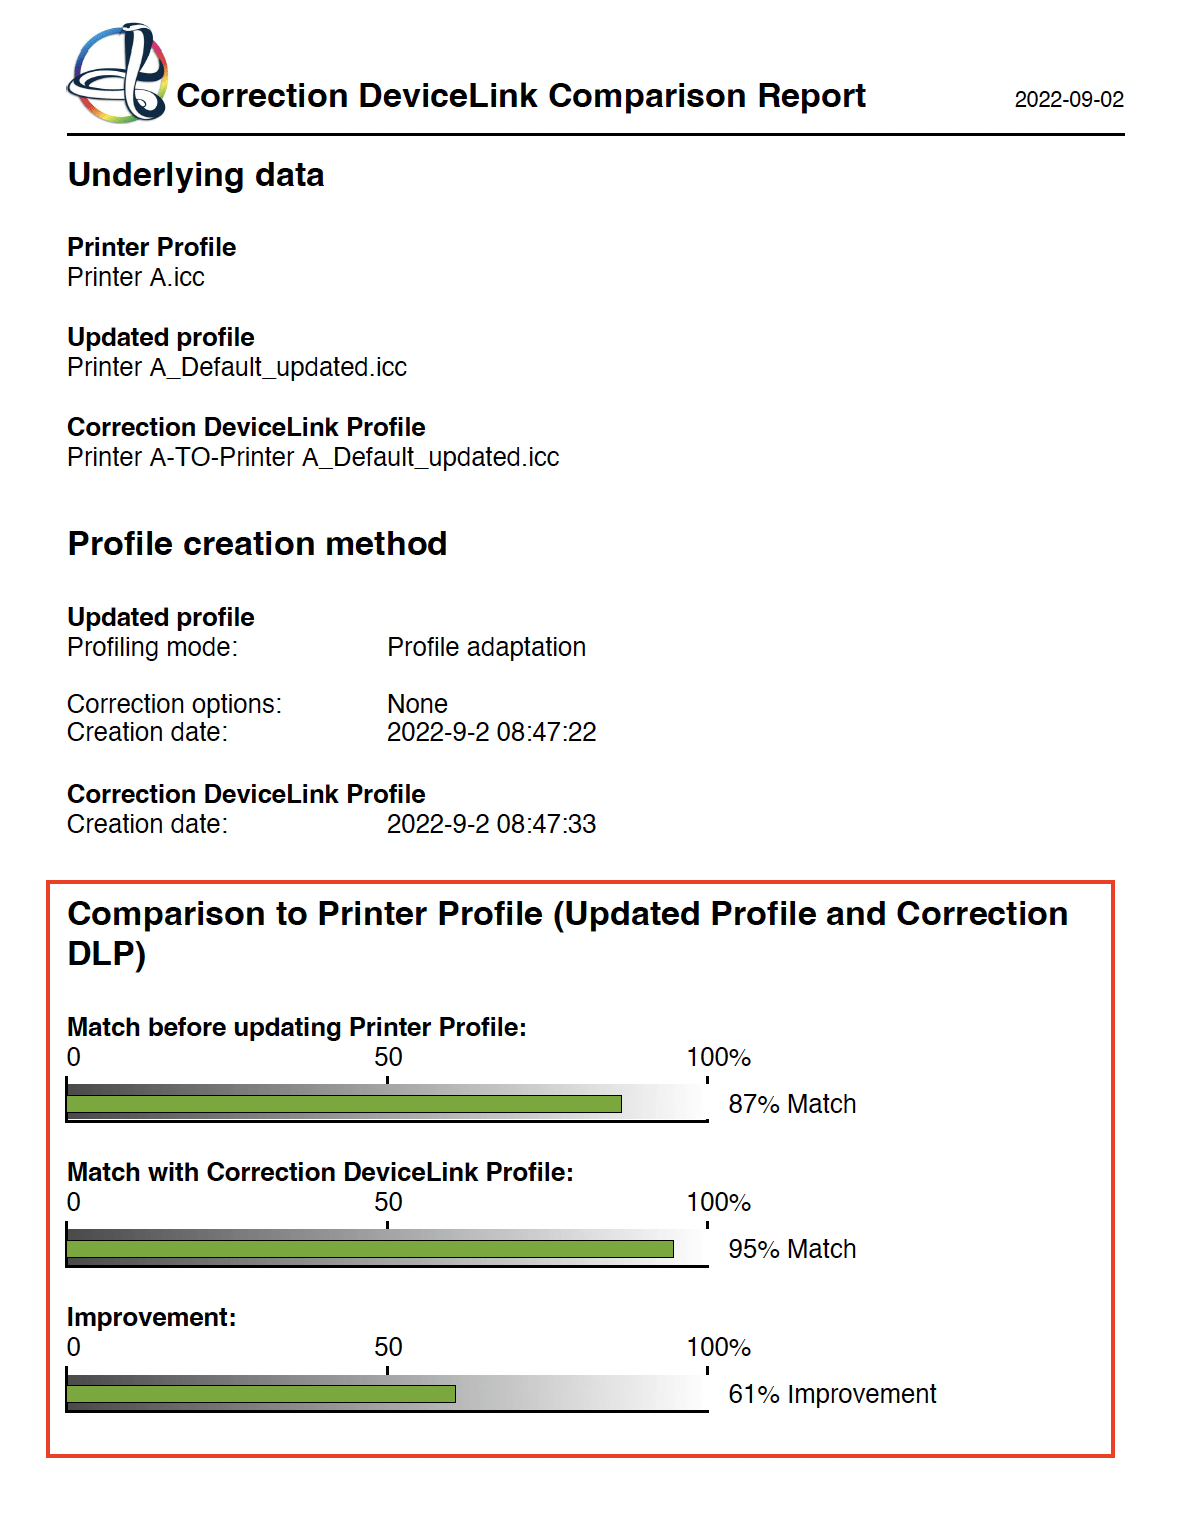
In addition, a detailed view of the measurement data is listed with an overall DeltaE evaluation comparing the Printer Profile with the Correction DeviceLink Profile.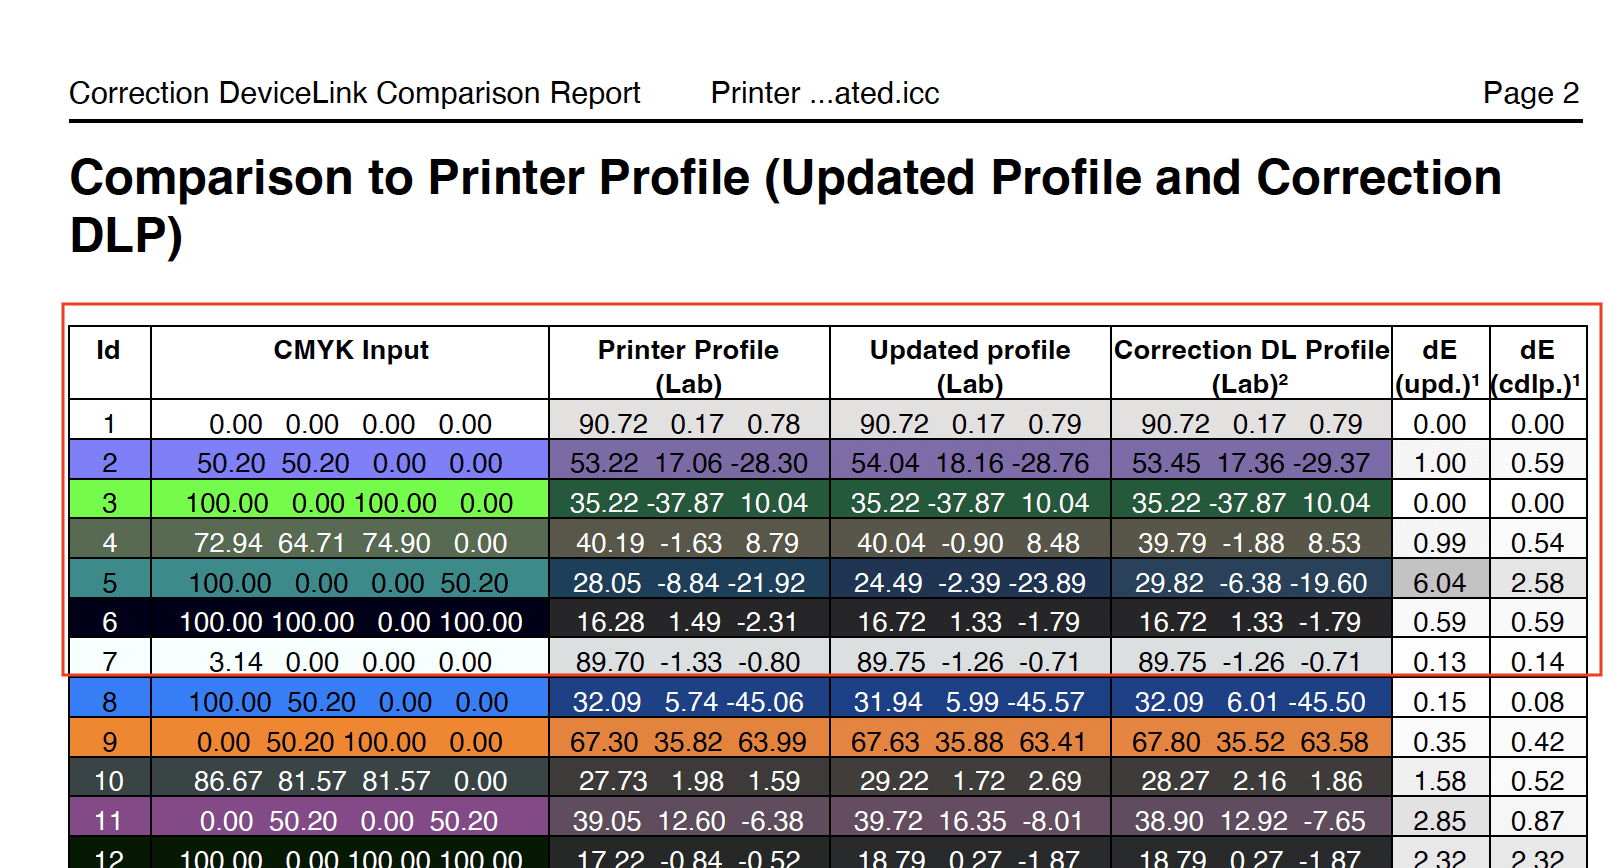
Load or Measure Data
Load or Measure
Load: Opens existing measurement data files.
Note: A right click on Load opens a list with recently used files and favorite files. Favorite files are displayed at the top of the list, separated from recent files by a dashed line. Selecting a file while pressing the CMD or Ctrl key takes you to the folder containing the file.
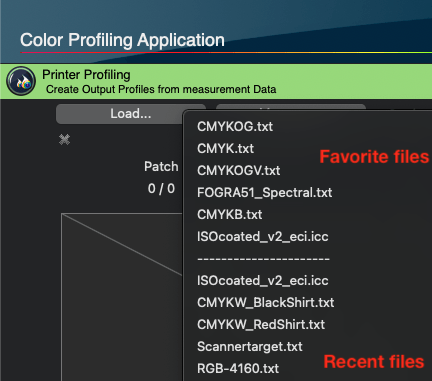
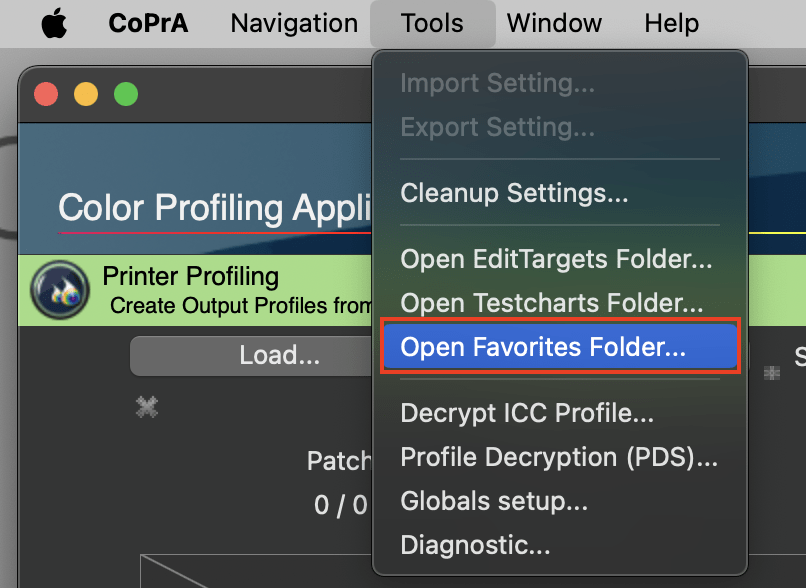
To make favorite files accessible in the list, store them in the FavoriteFiles folder which can be opened via the Tools menu.
All supported files of this folder are displayed in the list. As this list is shared by all ColorLogic applications, the files contained there are also available in ColorAnt and ZePrA.
Alternatively, open existing measurement data by dragging and dropping them into the Printer Profiling window; the measurement and reference data is then extracted and displayed.
CoPrA supports a variety of device manufacturer formats.
Measurement and reference data can be processed three different ways:
- Use reference data provided by organizations such as FOGRA, ECI or IDEAlliance®.
- Use data from a profile. Many manufacturers of profiling software save the measurement and reference files used for profiling within an ICC profile. Simply drag and drop the ICC profile to the Printer Profiling window and the data will be extracted and displayed. Alternatively, the profile can be opened and extracted using the button Load. If an error message pops up, the ICC profile does not contain measurement data.
- Measure test charts using ColorAnt or measuring tools from other instrument manufacturers, save the data and open in CoPrA.
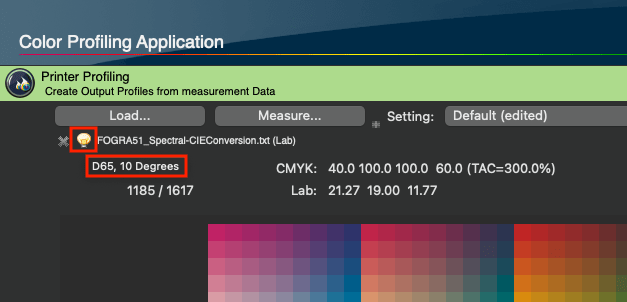
Note: For measurement data which has been converted, e.g., via the CIE Conversion tool in ColorAnt, a bulb icon is shown in front of the data name.
When hovering the mouse pointer over it, the Viewing Condition (e.g., D65, 10 degrees) is displayed. The light bulb icon only appears for non-standard viewing conditions.
Measure: As an alternative to working with pre-existing measurement data, test charts can also be measured using ColorAnt’s Measure Tool. Open Measure Tool by clicking Measure and measure with a supported device. Further information on the measurement of test charts can be found here.
Updating printer profiles – small control strips are sufficient
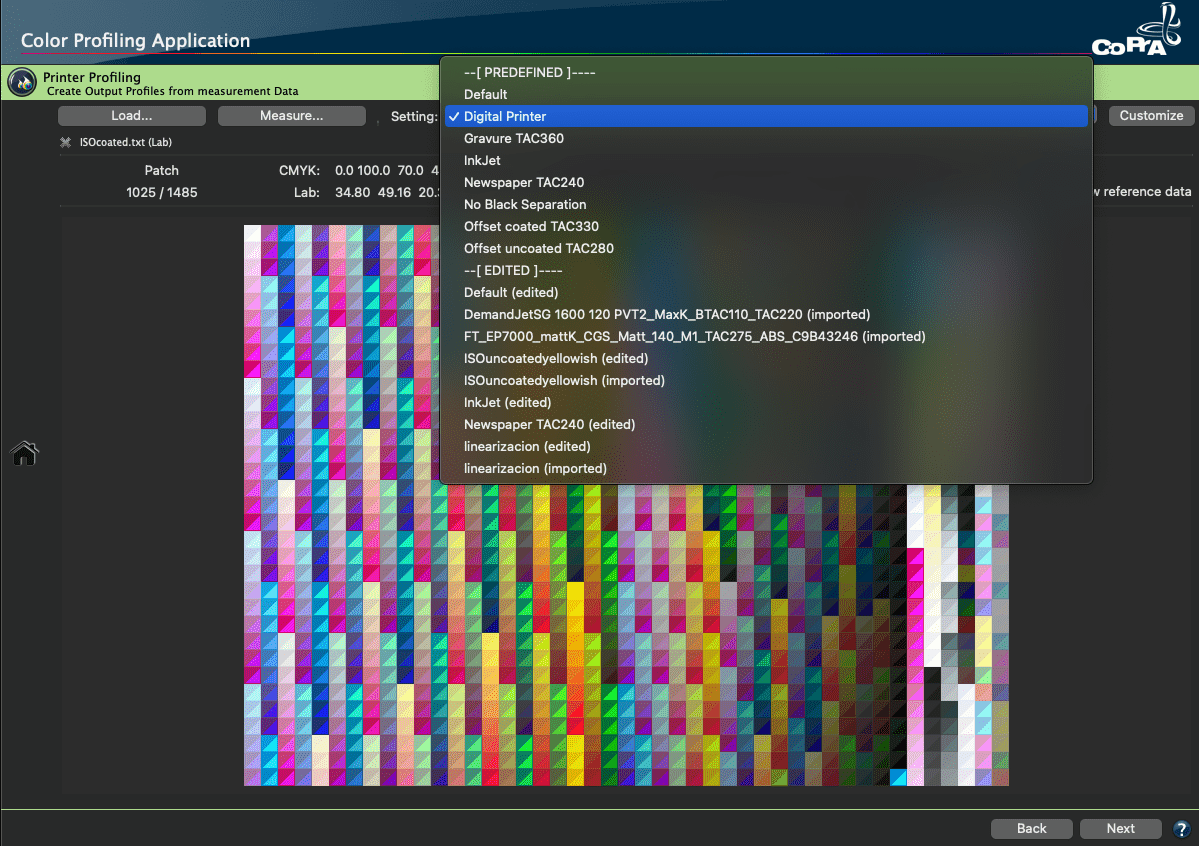
Setting: Select the applied printing method. CoPrA contains a large number of standard settings for common printing methods (e.g. digital and inkjet printing).
Chart preview area: The preview of the reference data of a profiling chart shows the correct colors. This allows for a visual comparison of the reference and the measured data.
Note: When previewing the reference data of a chart with White ink, the correct color of the white point is displayed.
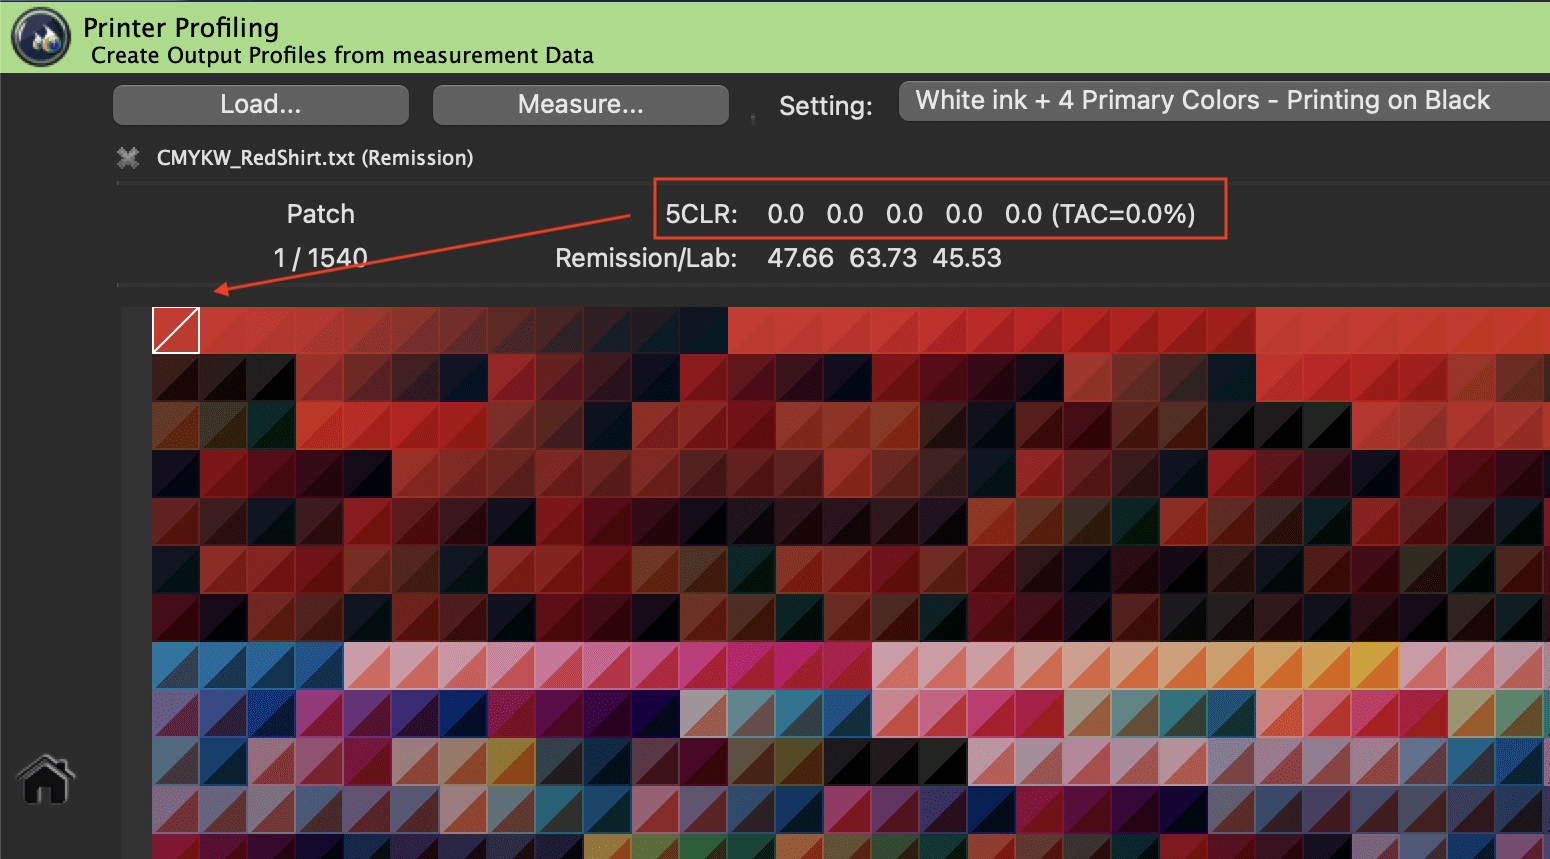
Data of red substrate such as a red shirt
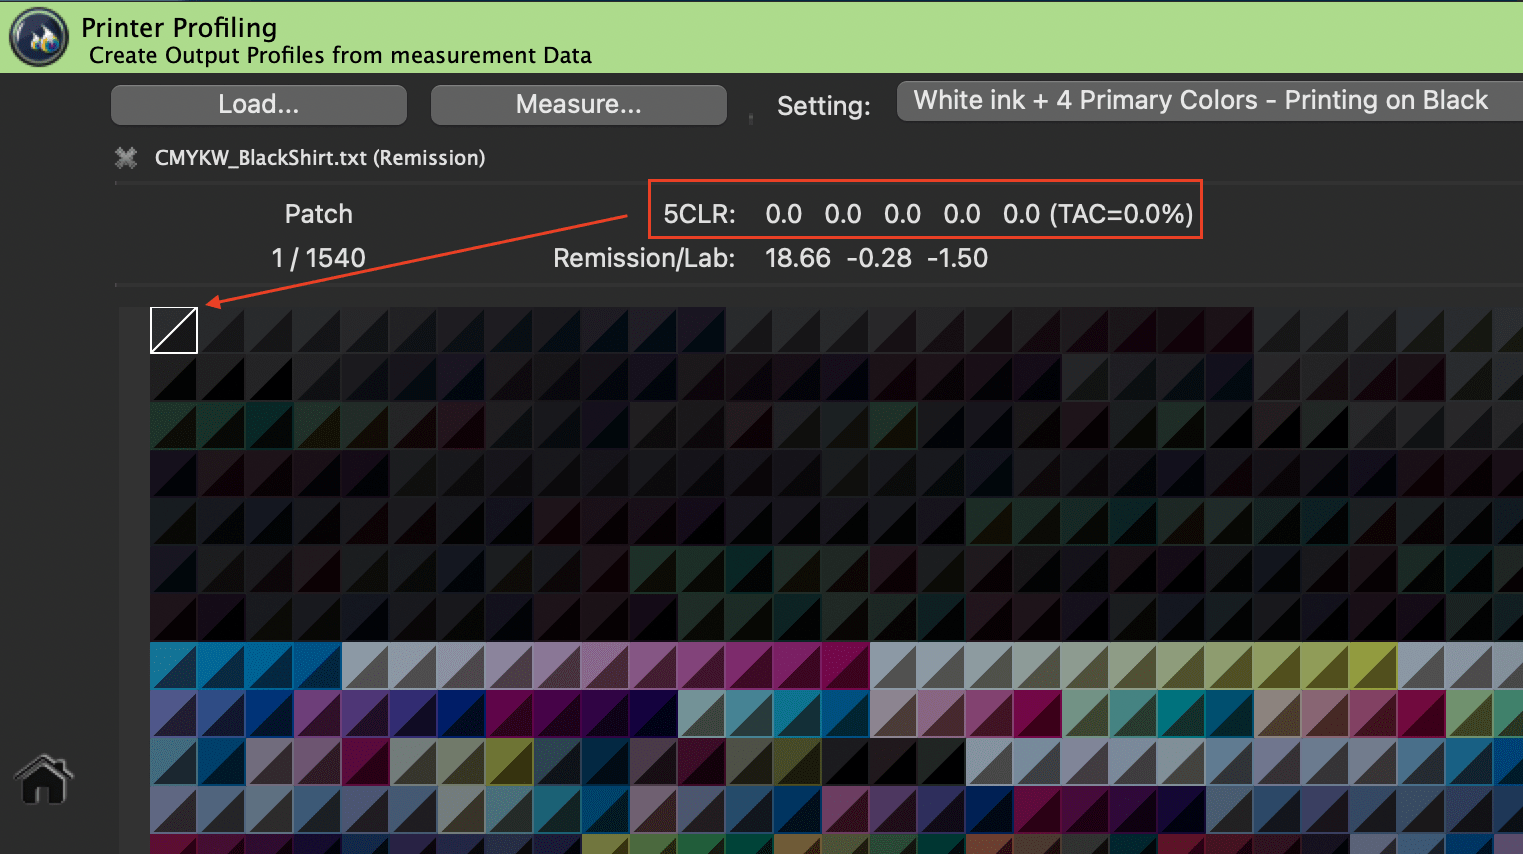
Data of black substrate such as a black shirt
Customize: In order to achieve the best possible profile quality, further settings can be adjusted under Customize, such as settings for Color Generation or the specification of the first printed tone.
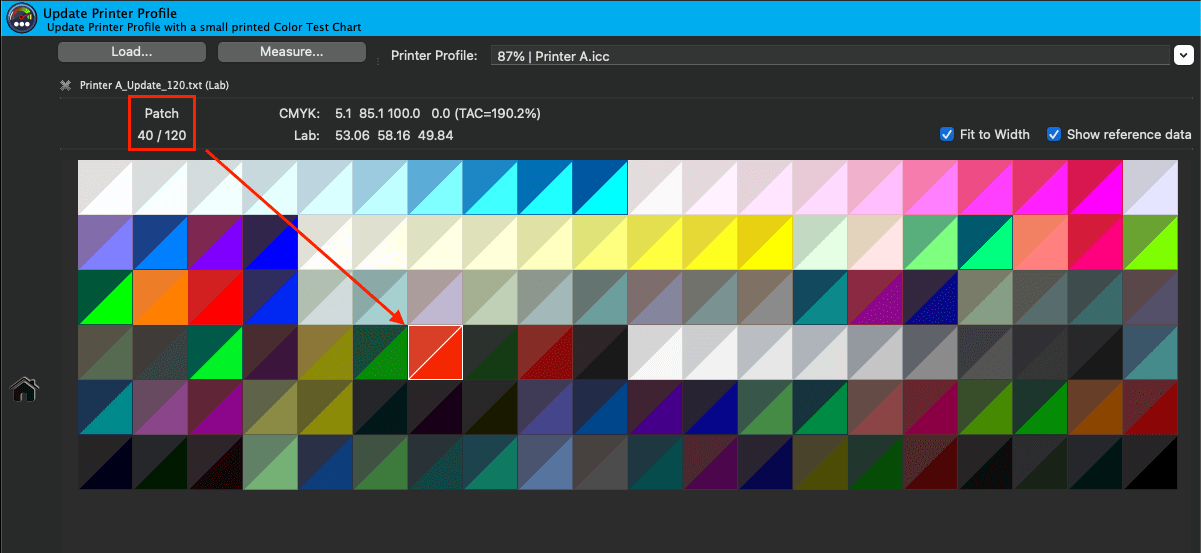
Fit to Width: By activating this checkbox the color patches of a row will be fit to the window width. Especially for large test charts with many color patches and many rows, the color patches will be displayed larger.
Show reference data: The device values such as CMYK or RGB and measurement data (i.e. Lab or spectral values) are shown on a split color patch. The data can be quickly compared for incorrect or faulty data.
Patch
Patch: Information is available for the selected color patch, such as the number of the patch, the total number of color patches, the color space and composition of the color and the XYZ value.
Working with Profile Settings
Import, Export or Cleanup of Profile Settings
Profile settings for Printer, DeviceLink and SaveInk profiling can be selected in the drop-down menu Setting.
The package CoPrA Basic allows selection of default predefined settings. The package CoPrA M and higher provides access to all the parameters of the profile which can be customized.
To adjust these profile parameters, select Customize. Custom settings can be saved, imported and exported which provides the ability to exchange personal profiling settings easily with other CoPrA users or make them available for support purposes.
Import setting: Settings can either be imported as configuration file via the Tools menu using the entry Import setting or by dragging an ICC profile with the desired settings on the drop-down menu Setting. The name of imported profiles receives the suffix (imported). If an inappropriate profile (for example an RGB profile for CMYK profiling) is dragged on the drop-down menu Setting, an error message appears.
Export setting: Customized profile settings can be selected in the drop-down menu Setting and exported as configuration file by using the entry Export setting from the Tools menu.
However, CoPrA's default settings cannot be exported. Standard settings are listed in the drop-down menu Setting under the entry [PREDEFINED] and can be customized, but they cannot be overwritten. After customizing any setting the name receives the suffix (edited). It is now a custom setting which is listed under the entry [EDITED] and thus can be exported. Edited settings can be saved under any name. Saved settings will be removed from [EDITED] and listed under [SAVED]. Saved and edited settings can be deleted manually.
Cleanup settings: All settings found under the entry [EDITED] will be deleted.
Presets
Default – Use Settings from Selected Printer Profile: Uses the same settings for the updated profile as in the original printer profile.
Digital Printer: Standard presetting, which provides a good starting point for adaptations to special requirements.
Gravure TAC360: Automatically selects appropriate Black Generation (GCR), GCR Amount, Black Start and Black Width settings for gravure printing. Limits the total area coverage to 360% in the printer profile.
InkJet: Standard presetting, which provides a good starting point for adaptations to special requirements.
Newspaper TAC240: For newspaper printing. Automatically selects appropriate Black Generation (GCR), GCR Amount, Black Start and Black Width settings. Limits the total area coverage to 240% in the printer profile.
No Black Separation: Creates a printer profile without black separation. Black Generation (GCR), GCR Amount, Black Start and Black Width settings are automatically selected and grayed out.
Offset coated TAC330: For offset printing. Automatically selects appropriate Black Generation (GCR), GCR Amount, Black Start and Black Width settings. Sets the Black Calculation to Balance CMY and limits the total area coverage to 330% in the printer profile.
Offset uncoated TAC280: For offset printing. Automatically selects appropriate Black Generation (GCR), GCR Amount, Black Start and Black Width settings. Sets the Black Calculation to Balance CMY and limits the total area coverage to 280% in the printer profile.
Default – Multicolor: Standard presetting, which provides a good starting point for adaptations to special requirements.
Digital Printer - Multicolor: Automatically selects the Multicolor Mode (Smooth) and appropriate Black Generation (MaxK), GCR Amount, Black Width and Black Start settings. Limits the total area coverage to 330% in the printer profile.
Industrial Printing and Packaging: Presetting for packaging printing.
Sparse Ink: This Setting is recommended for easier use of the Multicolor Mode “Generate Separations with sparse ink”.
White ink + 4 Primary Colors - Printing on Black: For color managed color prints on black substrates, such as textiles, white ink must be used first and colors must be applied on top of the white ink to obtain colorful graphics. This preset uses White for the separation. It automatically selects the appropriate Multicolor Mode - either CMY+White_on_Black or CMYK+White_on_Black - while all other Color Generation controls are disabled.
Note: To create profiles with White, special test charts are required, which can be found in the test charts subfolder Special for the two cases CMY+White_on_Black and CMYK+White_on_Black.
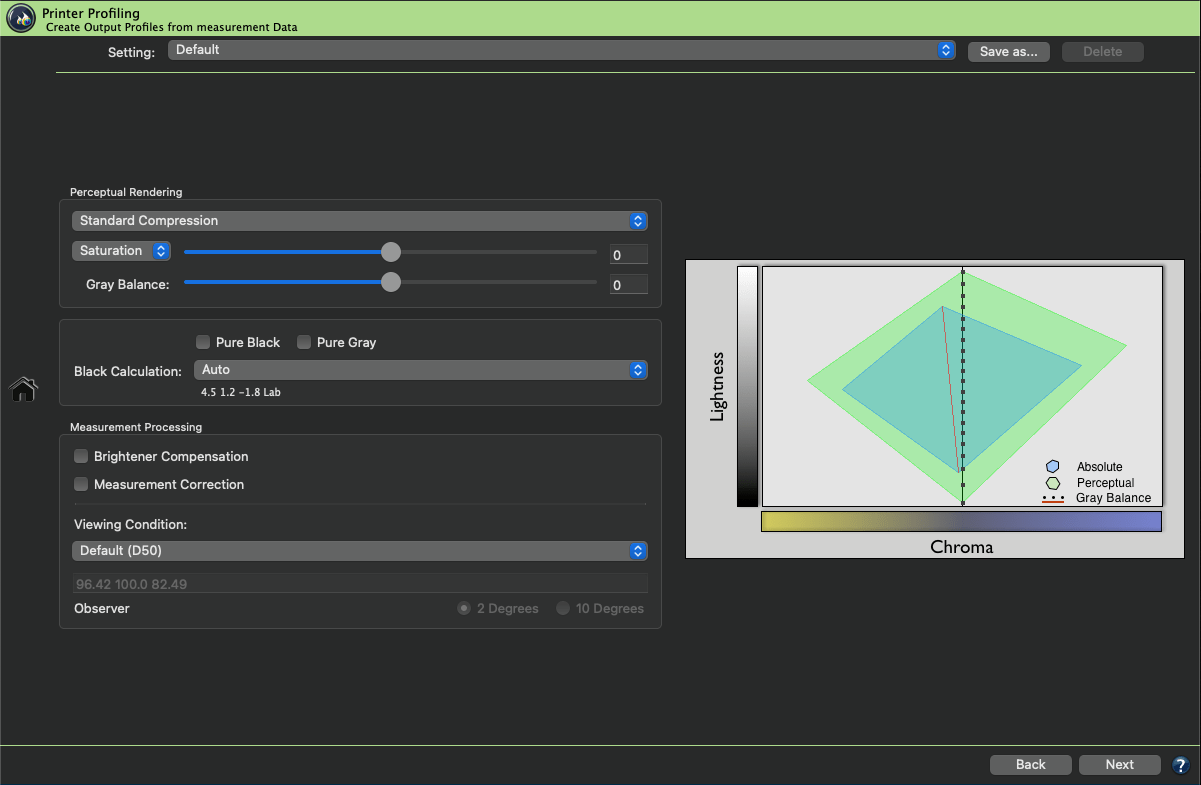
General
Perceptual Rendering
Compared to the ICC framework, which only supports perceptual rendering in applications, ColorLogic provides a choice of Perceptual Rendering options when creating profiles. In order to use a ColorLogic profile created with one of the special Perceptual Rendering options, the perceptual rendering intent must be set in the target application.
Note: All Perceptual Rendering options in the drop-down menu, including the Advanced Perceptual Rendering Options (such as Saturation, Chroma, Lightness, Gray Balance), are also applied to the Saturation Rendering Intent.
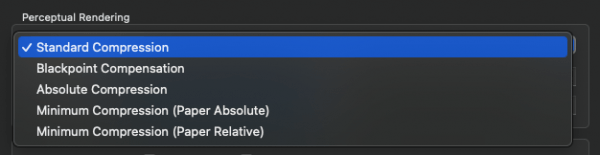
CoPrA offers the following methods in relation to perceptual rendering:
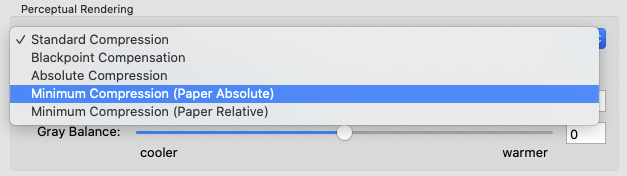
Standard Compression: This is the default method. It uses a perceptual conversion that is well suited for all types of gamuts, i.e., also for conversions between color spaces of different sizes. Neutral tones are converted using a relative colorimetric approach, and the appearance of the gray axis always depends on the paper white of the target profile. Therefore, the gray axis of the transformed file will appear yellowish on a very yellowish paper. The same gray axis will appear bluish on a bluish paper. For very small color gamuts, for example in newspaper printing, the dark tones are raised slightly to achieve more image definition in these areas.
Blackpoint Compensation: Use Blackpoint Compensation to achieve the same results with a perceptive conversion as with “Relative Colorimetric with Black Point Compensation”. When converting from large to small color spaces, the image definition is preserved in the highlights and shadows, unlike with a pure Relative Colorimetric conversion. Neutral tones are converted using the Relative Colorimetric intent. Out-of-gamut colors are cut off.
Absolute Compression: This method is based on the absolute colorimetric rendering intent in terms of color reproduction and is recommended when the paper tones differ significantly (the color gamuts can be similar or different). In contrast to the Standard Compression and Blackpoint Compensation, the paper tint is compensated in the gray balance. The rendering of neutral colors is based on the absolute colorimetric rendering intent, without paper tone simulation in the highlights. If, for example, the paper white is significantly more yellow than in the reference, the gray axis appears neutral despite the yellowish paper tone. This ensures that the color appearance of the original file is preserved as best as possible on a target medium with a different paper tint. The contrast range in the highlights and shadows is adapted to avoid any loss of image definition.
Minimum Compression (Paper Absolute): This method is largely similar to the absolute colorimetric intent and only compensates close to the black and the white point.
In addition, the white point of the source color space is not simulated, but scaled to the white point of the target color space, thus ensuring a pure paper white.
Use this rendering intent to achieve a close reproduction, for example when using print standards such as ISO Coated V2 or GRACoL2006 Coated1v2 on a digital printer.
Note: As for the absolute colorimetric rendering intent, ensure that the target color space is larger or has at least a similar size to avoid any loss of image definition. For color conversions from larger to smaller color spaces use Absolute Compression to maintain the gray balance of the source color space.
Minimum Compression (Paper Relative): This method is largely similar to the relative colorimetric intent and only compensates close to the black and the white point. It is similar to Minimal Compression (Paper Absolute) but uses relative colorimetric instead.
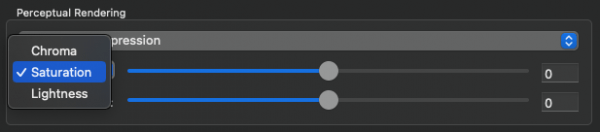
Advanced Perceptual Rendering Options: The drop down menu allows changes to the overall Chroma, Lightness or Saturation of the profile using a slider. Chroma can be used to reduce or increase the chroma of highly saturated colors in the range between -20 and +20. Saturation can be used when highly saturated colors are required. As with the setting Chroma, the gray balance is not affected when moving the slider. Saturation can be used especially for large color spaces such as gamut extending Multicolor in order to achieve more brilliant colors.
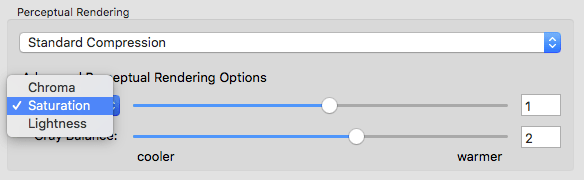
Notes: ColorLogic intentionally keeps the chroma effect moderate. However, when increasing the chroma, ensure that the setting neither causes a loss of image definition in highly saturated colors, nor adversely affects colors such as skin tones.
The effect of each of these settings is shown in the gamut graph on the right. Increasing the saturation results in higher chroma and lower lightness, so more saturation will slightly darken the colors and they will appear more vibrant. In contrast, more chroma can result in high chroma colors being out-of-gamut and these colors would not be rendered by the given profile.
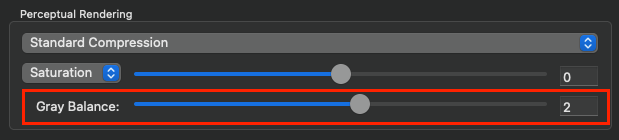
Gray Balance: Allows adjustment of the gray balance to create a cooler or warmer gray axis. cooler shifts the gray balance towards more bluish colors (negative b* values), warmer shifts it towards yellowish colors (positive b* values). The effect of the slider setting is visualized in the graphic.
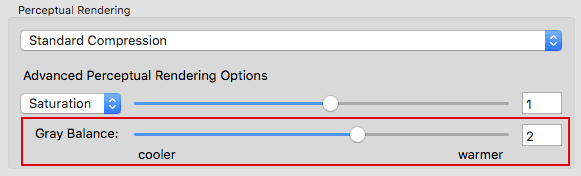
Note: The setting Gray Balance works independently from the selected Perceptual Rendering method which has already an effect on the gray balance and allows visual adjustments based on personal color preferences.
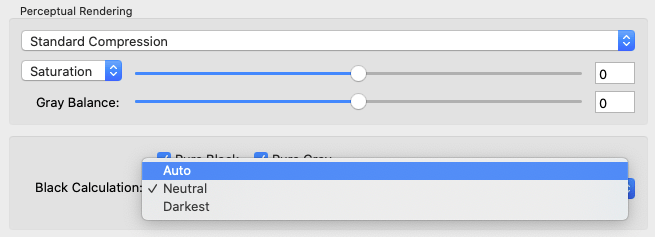
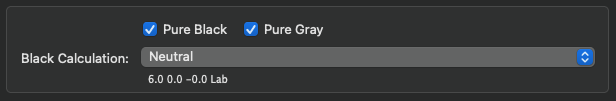
Black Calculation: Three different settings can be selected for black point calculation:
Auto: Sets the black point of the profile to the well-defined value of RGB=0/0/0.
Neutral: Calculates a neutral black point with a*=b*=0 taking the measured data into account. With non-neutral measured values, this can lead to the RGB values no longer being RGB=0/0/0 and possibly losing contrast.
Darkest: Calculates the darkest possible black point, which can also be colored depending on the measurement data. In many cases this option results in the same RGB black point as Auto.
CoPrA displays the calculated Lab value based on the values you entered for the Black Calculation. This enables you to immediately understand the color effect on the black point resulting from the option you have selected.
Gamut plot
The gamut plot illustrates two typical gamuts of a profile when converting from device color space to Lab. These plots show the gamuts for the two different rendering intents Absolute colorimetric (the blueish part) and Perceptual (the greenish part). Typically the perceptual gamut is larger because it is scaled from absolute white (Lab = 100/0/0) to absolute dark (Lab = 0/0/0) and the absolute colorimetric gamut is smaller as it represents the gamut based on the measurement data.
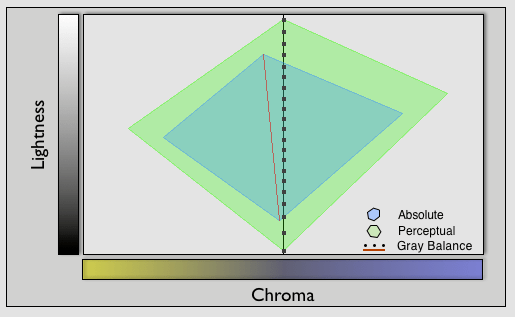
Note: The gamut plot is a graphical visualization based on virtual data, to show the effects of the ColorLogic Perceptual Rendering methods on the perceptual gamut. The gamut plot is not based on your actual loaded measurement data.
The plot of the absolute gamut does not change but the perceptive gamut plot changes depending on the chosen perceptual method. Besides the different sizes and shapes of the gamut, the gray balance is shown in the plot, too. For the absolute intent, the gray balance is shown as a red line and it is positioned in the yellowish part of the color space since the white point of this virtual data is also rather yellowish. The dotted line represents the gray balance of the perceptual gamut and depends on the selected perceptual method. Therefore, the perceptual gamut plot changes depending on the selected perceptual method.
If the perceptual method is rather paper relative, such as Standard Compression, Blackpoint Compensation or Minimum Compression (Paper relative), the dotted line remains in a neutral position, which means it does not take the yellowish-gray balance into account. If the perceptual method is rather paper absolute, e.g. taking the yellowish-gray balance into account, the dotted line converges to the red line of the absolute gamut. Paper absolute perceptual methods include Absolute Compression and Minimum Compression (Paper absolute).
Changes in the Advanced Perceptual Rendering Options such as Saturation, Chroma, Lightness or the Gray Balance are also visible in the perceptual gamut plot. More saturation results in a larger and slightly darker perceptual gamut and a warmer Gray Balance causes the dotted line to shift to the left to be more yellowish.
General Settings for RGB Profiling
Perceptual Rendering
ColorLogic provides a choice of Perceptual Rendering options when creating profiles compared to the ICC framework which only supports perceptual rendering in applications. To use a ColorLogic profile created with one of the special Perceptual Rendering options, the perceptual rendering intent must be set in the target application.
Note: All Perceptual Rendering options in the drop-down menu, including the Advanced Perceptual Rendering Options (such as Saturation, Chroma, Lightness, Gray Balance), are also applied to the Saturation rendering intent.
CoPrA offers the following methods in relation to perceptual rendering:
Standard Compression: This is ColorLogic’s standard method which is well suited for most applications. Neutral tones are converted using a relative colorimetric approach. If the paper white of the used printing medium is significantly more yellow than the reference, the gray axis will look more yellow as well. The contrast range will be adapted for small color gamuts to preserve image definition.
Black Point Compensation: Use Black Point Compensation to achieve the same results with a perceptive conversion as with "Relative Colorimetric with Black Point Compensation". When converting from a large to a small color space, the image definition is preserved in the highlights and shadows, unlike with a pure Relative Colorimetric conversion. Neutral tones are converted using the Relative Colorimetric intent. Out-of-gamut colors are cut off.
Absolute Compression: This method is based on the absolute colorimetric intent but with some differences. The contrast range in the highlights and shadows is adapted to avoid any loss of image definition. The rendering of neutral colors is based on absolute colorimetry without paper color simulation in the highlights. If the paper white of the used printing medium is significantly more yellow than the reference, the gray axis will look neutral despite the yellowish paper white.
Minimum Compression (Paper Absolute): This method is similar to the absolute colorimetric intent and only compensates close to the black and the white point.
In addition, the white point of the source color space is not simulated but scaled to the white point of the target color space, thus ensuring a pure paper white.
Use this rendering intent to achieve a close reproduction, for example when using print standards such as ISO Coated V2 or GRACoL2006 Coated1v2 on a digital printer.
Note: As for the absolute colorimetric rendering intent, ensure that the target color space is larger or has at least a similar size to avoid any loss of image definition. For color conversions from larger to smaller color spaces use Absolute Compression to maintain the gray balance of the source color space.
Minimum Compression (Paper Relative): This method is similar to the relative colorimetric intent and only compensates close to the black and the white point. It is similar to Minimal Compression (Paper Absolute) but uses relative colorimetric instead.
Advanced Perceptual Rendering Options: The drop-down menu allows changes to the overall Chroma, Lightness or Saturation of the profile using a slider. Chroma can be used to reduce or increase the chroma of highly saturated colors in the range between -20 and +20. Saturation can be used when highly saturated colors are required. As with the setting Chroma, the gray balance is not affected when moving the slider. Saturation can be used especially for large color spaces such as gamut extending Multicolor in order to achieve more brilliant colors.
Notes: ColorLogic intentionally keeps the chroma effect moderate. However, when increasing the chroma, ensure that the setting neither causes a loss of image definition in highly saturated colors, nor adversely affects colors such as skin tones.
The effect of each of these settings is shown in the gamut graph on the right. Increasing the saturation results in higher chroma and lower lightness, so more saturation will slightly darken the colors and they will appear more vibrant. In contrast, more chroma can result in high chroma colors being out-of-gamut and these colors would not be rendered by the given profile.
Gray Balance: Allows adjustment of the gray balance to create a cooler or warmer gray axis. Cooler shifts the gray balance towards more bluish colors (negative b* values), warmer shifts it towards yellowish colors (positive b* values). The effect of the slider setting is visualized in the graphic.
Note: The setting Gray Balance works independently from the selected Perceptual Rendering method which has already an effect on the gray balance and allows visual adjustments based on personal color preferences.
Pure Black: Sets absolute Lab Black to the RGB value 0/0/0.
Pure Gray: For RGB printer profiles, Pure Gray builds up the gray balance with equal amounts of color. This option can be useful for printer drivers that are driven by RGB if the printing system already prints mostly neutral in the gray axis and slight fluctuations with equally proportional RGB gray values are to be prevented.
Note: The options can change and even cancel the black calculation and the perceptual rendering. These two options should therefore only be used in justified and exceptional cases.
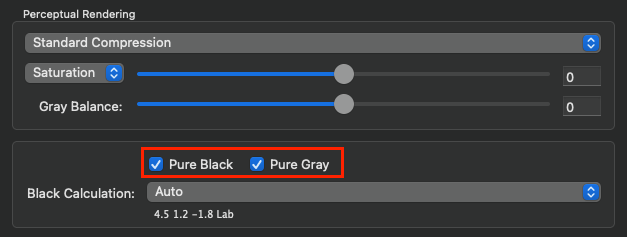
Black Calculation: Three different settings can be selected for black point calculation:
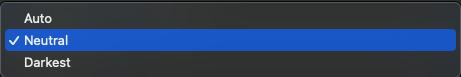
Auto: Sets the black point of the profile to the well-defined value of RGB=0/0/0.
Neutral: Calculates a neutral black point with a*=b*=0 taking the measured data into account. With non-neutral measured values, this can lead to the RGB values no longer being RGB=0/0/0 and possibly losing contrast.
Darkest: Calculates the darkest possible black point, which can also be colored depending on the measurement data. In many cases this option results in the same RGB black point as Auto.
CoPrA displays the calculated Lab value based on the values you entered for the Black Calculation. This enables you to immediately understand the color effect on the black point resulting from the option you have selected.
Gamut plot
The gamut plot illustrates two typical gamuts of a profile when converting from device color space to Lab. These plots show the gamuts for the two different rendering intents Absolute colorimetric (the blueish part) and Perceptual (the greenish part). Typically, the perceptual gamut is larger because it is scaled from absolute white (Lab = 100/0/0) to absolute dark (Lab = 0/0/0) and the absolute colorimetric gamut is smaller as it represents the gamut based on the measurement data.
Note: The gamut plot is a graphical visualization based on virtual data to show the effects of the ColorLogic Perceptual Rendering methods on the perceptual gamut. The gamut plot is not based on your actual loaded measurement data.
The plot of the absolute gamut does not change but the perceptive gamut plot changes depending on the chosen perceptual method. Besides the different sizes and shapes of the gamut, the gray balance is shown in the plot, too. For the absolute intent, the gray balance is shown as a red line and it is positioned in the yellowish part of the color space since the white point of this virtual data is also rather yellowish. The dotted line represents the gray balance of the perceptual gamut and depends on the selected perceptual method. Therefore, the perceptual gamut plot changes depending on the selected perceptual method.
If the perceptual method is rather paper relative, such as Standard Compression, Blackpoint Compensation or Minimum Compression (Paper relative), the dotted line remains in a neutral position, which means it does not take the yellowish-gray balance into account. If the perceptual method is rather paper absolute, e.g., taking the yellowish-gray balance into account, the dotted line converges to the red line of the absolute gamut. Paper absolute perceptual methods include Absolute Compression and Minimum Compression (Paper absolute).
Changes in the Advanced Perceptual Rendering Options such as Saturation, Chroma, Lightness or the Gray Balance are also visible in the perceptual gamut plot. More saturation results in a larger and slightly darker perceptual gamut, and a warmer Gray Balance causes the dotted line to shift to the left to be more yellowish.
Measurement Processing
When creating or updating printer profiles it may be necessary to optimize the measurement data. The Measurement Processing in CoPrA includes the optical Brightener Compensation, the Measurement Correction and the specification of a Viewing Condition.
Brightener Compensation: Recommended for bright white papers that contain optical brighteners. This correction weakens the effect of optical brighteners, which are evaluated differently by a measuring device compared to the human eye, and prevents negative accompanying effects such as a yellowish color reproduction.
Recommendation: Work with spectral measurement data whenever possible. When working with spectral measurement data, the function Brightener Compensation can achieve an optimum correction. The correction will only be executed,in contrast to colorimetric measurement data (Lab measurement data), if CoPrA recognizes the paper color as an optical brightener. However, it will not be carried out if CoPrA does not recognize the paper color as optical brightener, which, for example, is true for a blue-colored paper.
As a result of the viewing condition changes according to ISO 3664:2009, The updated standard makes it easier to spot the effects of optical brighteners (OBAs). So a minor correction is needed for devices using the M0 measuring method.
As a result of the viewing condition changes according to ISO 3664:2009, optical brighteners in papers are more strongly excited, a small correction is therefore also necessary for measuring instruments using the M0 measuring method.
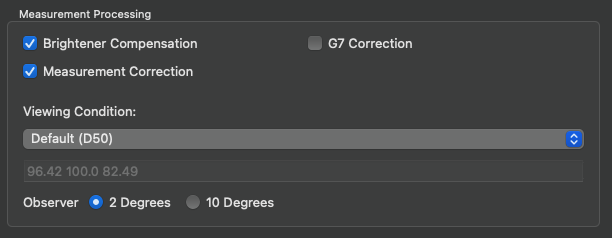
Selecting Brightener Compensation and Measurement Correction
Note: To specifically correct the effects of optical brighteners, use ColorAnt's Brightener tool before profile creation in CoPrA and disable the corresponding checkbox in CoPrA to avoid double compensation.
Measurement Correction: Identifies and resolves measurement errors without changing the printing behavior. Redundant measurement values, which occur in typical test charts such as ECI2002 or IT8.7/4, are taken into consideration for detecting consistent printing properties and will be intelligently included in the correction. Further corrections, like the removal of redundant measurement values or Smoothing, can be done in the separate measurement data processing program ColorAnt.
Recommendation: For your own measurement data select Measurement Correction as the default setting. However, this correction should be disabled for measurement values that have already been smoothed (such as FOGRA measurement values) or for measurement values that have already been processed with ColorAnt. If you have already made a correction in ColorAnt, CoPrA warns you of unnecessary double correction when activating the measurement data correction and/or brightener correction.
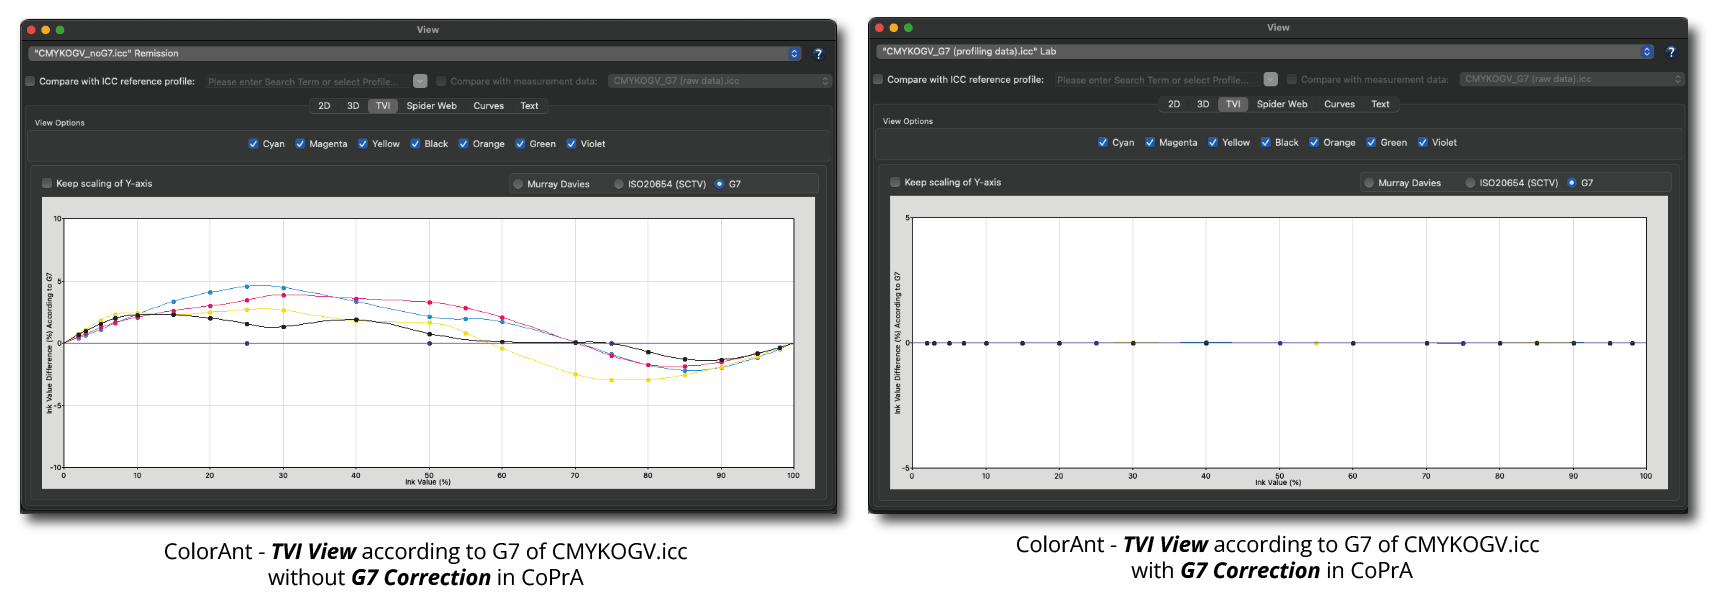
G7 Correction: Corrects the tonal value curves of the measurement data to correspond to the gray balance conditions of the G7® method and includes these adjustments in the resulting ICC profile.
Note: G7 Correction only works with G7 linearized data, i.e. G7 optimized printer profiles can only be achieved if the data has been G7 calibrated beforehand. Therefore, the data must have been linearized to G7 and a profiling chart, e.g. in ColorAnt, must have been measured before applying the G7 correction in CoPrA.
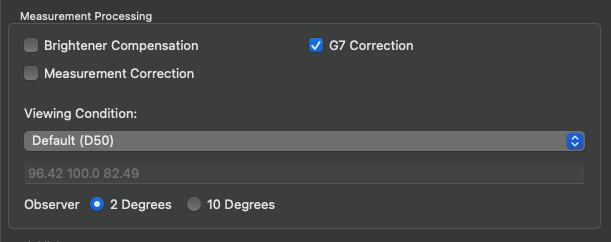
With the G7® method, the CMY curves are adjusted to produce the most neutral gray hue possible with defined lightness across the entire gray balance.
The G7 Correction is defined to work with CMYK only. However, it is possible to apply the G7® method to the CMYK parts of a Multicolor measurement file and the additional (Multicolor) channels will be corrected according to ISO 20654 (also known as SCTV, Spot Color Tone Value).
The G7 correction option is also included in the Profile Report.
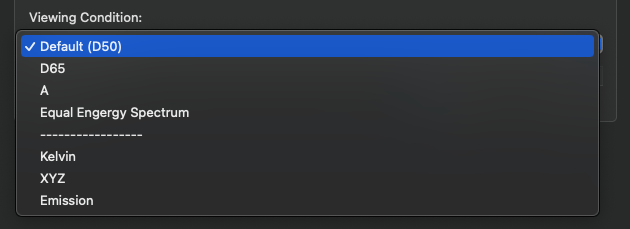
Viewing Condition
Viewing Condition: Typically, printer profiles are optimized for D50 viewing conditions and 2 degrees standard observer, however, for different tasks, e.g. textile printing with D65 and 10 degrees observer, photos in a gallery under incandescent light (roughly corresponds to viewing condition A) or presentation displays under a trade fair lighting with suboptimal lighting conditions (e.g., fluorescent light), the lighting conditions can be considered when creating the profile.

To do so, select one of the four predefined viewing conditions or manually enter the measured viewing condition as Kelvin value or as XYZ value and change the standard Observer if required.
Alternatively use the Emission option. To apply a spectral emission light measurement, select the entry Emission in the drop-down menu Viewing Condition and then select your measurement data file in the subsequent dialog (TXT, CXF or CSV file) or just drag and drop your measurement data file onto the value field. CoPrA extracts the white point from the file and displays the value.
If spectral data are available, CoPrA uses this information to calculate a printer profile that makes your prints (with the selected viewing condition) appear as if they had been profiled with D50 and viewed under the standard viewing condition D50.
When using spectral measurement data of a test chart and spectral data of a viewing condition (e.g., the options D50, D65, A, Equal Energy Spectrum, Kelvin or Emission), CoPrA will use a spectral color model to convert to Lab. If no spectral data is available a chromatic adaptation model according to CIECAM02 will be used, which in terms of quality is not the preferred method.
Changing the Observer is only possible for spectral data, so if the Observer options are disabled, this is an indication that spectral data is not available.
Note: CoPrA remembers the last used settings including the selected Viewing Condition. When creating new profiles, please check whether the selected viewing condition is in accordance with the purpose of the profile. If no specific viewing condition is required, always select the default D50 and 2 Degrees Observer.
Highlights
In flexo printing, the first printed tone is often subject to a rather high tone value increase. Additionally, in some flexo printing processes there is no transfer of tone values below a certain percentage in the highlight areas. However, the simulation of those process properties is particularly important for proofing applications to truly simulate the final print result in the highlights. It may also be necessary to increase the tone values in the highlights when using the profile for production or separation.
For that reason, we integrated four different settings in CoPrA to adjust the Highlights.
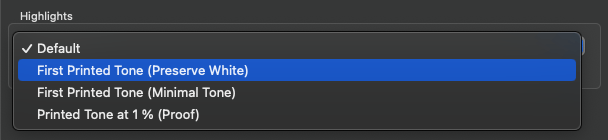
Default: Results in 'normal' profiling behavior in highlight areas. Use this setting for all printing processes that don't require any adjustment of the first printed tone.
First Printed Tone (Preserve White): Defines when the first printed tone of the profile will be considered and appear in the proof (hard copy or soft proof). When the profile is used for separation, the paper white is maintained and small tonal values are immediately increased to the set tonal value resulting in a strong slope.
First Printed Tone (Minimal Tone): Defines when the first printed tone of the profile will be considered and appear in the proof (hard copy or soft proof). When the profile is used for separation, a tonal value corresponding to the set percentage is already printed in the white of all channels.
Printed Tone at 1 % (Proof): This setting defines the tone value to be achieved at 1% in proof direction of the profile. In separation direction of the profile, the setting Default is used (in contrast to other highlight settings).
Based on data: If the loaded measurement data contains enough data points in the highlights, CoPrA also provides information about the start of the first printed tone (see screenshot). This information may be used as a guide to assess the value that should be entered in the input field to the right.
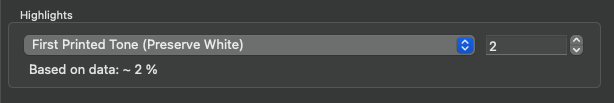
Note: The information Based on data will only be displayed when one of the Highlight settings is selected from the drop-down menu and the data allows a different recognition of the first printed tone compared to the Default setting. Before using the value for profiling, we suggest analyzing the data in ColorAnt.
The Highlights settings are not available for RGB profiling.
Color Generation
Color Generation for Multicolor Profiling
Multicolor Mode: Determines how colors will be built up in individual separations. Is only available when Multicolor measurement data has been loaded. A Multicolor license is required to use Multicolor features.
Note: Multicolor modes that are not recommended for the loaded measurement data are marked red in the drop-down menu.
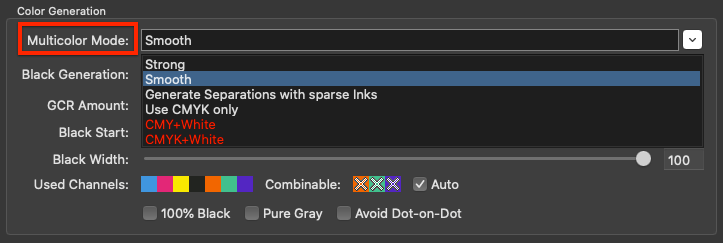
In some cases, a warning or information message is shown below at the bottom of the window in case the loaded data may require a different mode than the selected one.
In CoPrA, the first three channels represent primary colors (usually CMY). They should form a sound color space (gamut) and should also be able to create a gray axis. The fourth channel should be black if a separation with UCR/GCR is desired. If black is absent in the Multicolor measurement data while automatic Black Calculation is selected, it will be recognized by CoPrA and the separation will not be generated. Black separation is disabled if the value for Max. Black in the Black Point and TAC setting is 0%. Additional spot color channels (e.g., Orange, Green or Violet in a CMYK-OGV 7 color data set) are regarded as color space expanding colors. The Multicolor Mode determines how color space expanding colors are factored in together with primary colors.
Strong: As much spot color as possible will be applied. Accordingly, less primaries will be used in the highly saturated color areas. This results in a greater use of color space expanding spot colors and therefore in highly saturated colors in the printout.
Smooth: Use this method when more CMY is required and if a particularly smooth and harmonious separation with the extended colors is needed.
Note: The two Multicolor modes Smooth and Strong are similar but Smooth uses less color space expanding spot color channels.
Generate separations with sparse inks: This mode is of interest for the packaging market, as color separations are created in such a way that a certain hue uses as much as possible of a related spot color and very little or no primary colors. For example, in order to create a red hue, as much as possible of a reddish spot color is used, but very little to no magenta or yellow. A maximum of two or three colors are used for each color segment and, therefore, this Multicolor mode is practical to save process colors. However, black generation cannot be controlled and is based on the (separation) mode MaxK.
Note: The Setting “Sparse Ink” is recommended for easier use of this mode. In contrast to the Multicolor modes Smooth, Strong and Use CMYK only, the Multicolor mode Generate separations with sparse inks does not allow regulation of the Black Generation. Accordingly, these settings are grayed out.
Use CMYK only: Selecting this method results in a Multicolor printer profile that creates the desired number of channels (e.g., 7 channels) but is only composed of CMYK. The color space expanding spot color channels are not used for the separation but are used for the simulation of colors.
Notes:
- In package printing, there is sometimes a request for images and vectors composed of CMYK to be generated with only minimal changes to CMYK values and without spot colors - despite conversion into a Multicolor space. In this case, only spot colors, like Pantone colors, which are present as DeviceN in the PDF should be converted into the large Multicolor space. Such a workflow is possible in two easy steps:
(1) Creation of a separation-preserving CMYK-to-Multicolor DeviceLink profile in CoPrA using the Multicolor method Use CMYK only.
(2) Spot color conversion of the PDF using ColorLogic's color server ZePrA. - In CoPrA all settings of Color Generation (i.e. the entire tab) depend on black being present in the measurement data. Therefore, black must be present in the measurement data or ICC profiles as fourth channel.
If black is not present in the measurement data as the fourth channel, this channel will be treated as if it were the black channel. As an example, if blue is present as the fourth channel, then all settings in the tab Color Generation will still treat the fourth - now blue - channel as a black channel. In this situation, spot colors can be used for the calculation of the gray balance and the black point.
CMY+White: If the measurement data includes White as a color channel in addition to 3 primary colors, this Multicolor Mode must be selected. CMY refers to any 3 primary colors that form a sound color space and include a gray balance. This mode predefines the separation settings to use the color of the background (e.g., the black substrate) and the white ink within the separation. It automatically selects the optimal settings so that all other Color Generation controls are disabled and only the overall TAC can be adjusted under Black Point and TAC.
Please be aware that the resulting ICC profile is a Multicolor profile (4CLR profile).
CMYK+White: If the measurement data includes White as a color channel in addition to Black and 3 primary colors, this Multicolor Mode must be selected. CMY refers to any 3 primary colors that form a sound color space and include a gray balance. This mode predefines the separation settings to use the color of the background (e.g., the black substrate) and the white ink within the separation. It automatically selects the optimal settings so that all other Color Generation controls are disabled and only the overall TAC can be adjusted under Black Point and TAC. The assumed black point, e.g., the darkest color, uses a predefined combination of 100% Black printed on the black substrate.
Please be aware that the resulting ICC profile is a Multicolor profile (5CLR profile).
Background: For color managed color prints on black substrates, such as textiles, white ink must be used first and colors must be applied on top of the white ink to obtain colorful graphics.
Note: To create profiles with White, special test charts are required, which can be found in the test charts subfolder Special for the two cases CMY+White_on_Black and CMYK+White_on_Black.
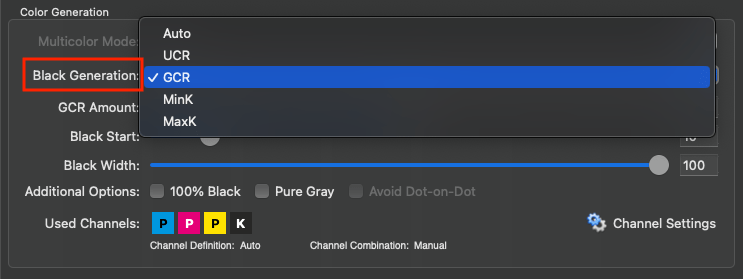
Black Generation: Defines the method for the generation of black in the target color space and therefore influences the separation comprehensively.
The following modes are available in the drop-down menu:
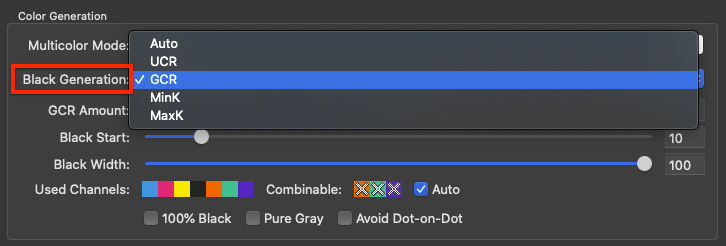
Auto: Uses a medium GCR amount which is based on the measurement data.
UCR: Allows adjustment of the settings Black Start and Black Width.
GCR: Additionally allows the adjustment of the setting GCR Amount.
MinK: Uses only a minimal amount of black and generates a separation using the maximum amount of CMY.
MaxK: Uses a maximal amount of black and generates a separation using the minimum amount of CMY.
The methods UCR, GCR, MinK and MaxK generate a new separation, regardless of the separation of the target profile.
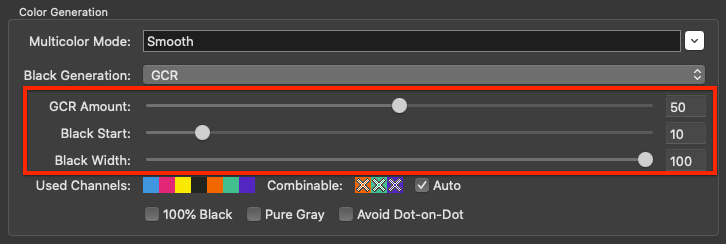
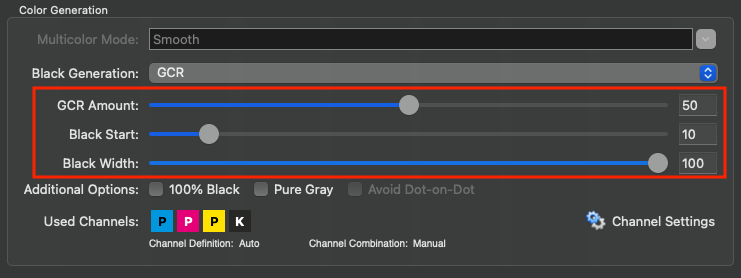
GCR Amount: Defines the amount of CMY that is replaced by black. At 0 only a low GCR amount is used which mainly impacts the shadows whereas at 100 a very strong GCR is used which affects the shadows and the highlights.
Black Start: Defines the starting point for the black generation. Black will be used if the minimum amount of CMY exceeds this limit.
Black Width: Defines the range in which black is generated outside the color-neutral area. The lower the value, the less black will be generated outside the color-neutral area.
Additional Options
100% Black: Prevents a pure black RGB text from being printed in four colors after conversion into a CMYK profile which would result in a blurred looking text. This is often the case with Office documents. Enabling 100% Black converts an RGB value of 0-0-0 to CMYK 0-0-0-100 (i.e. 100% black).
Pure Gray: Enabling this checkbox in a CMYK printer profile results in a gray balance which is composed of black ink only. However, this only makes sense if the printing system features a very neutral black from shadows to highlights.
Enabling Pure Gray in an RGB printer profile results in a gray balance which is composed of equal amounts of RGB values. This proves to be useful in RGB controlled (inkjet) print drivers.
Avoid Dot-on-Dot: Prevents Black and Violet/Blue color combinations that could produce dot-on-dot effects in AM printing. Replaces some of the Black by CMY, therefore avoiding dot-on-dot effects.
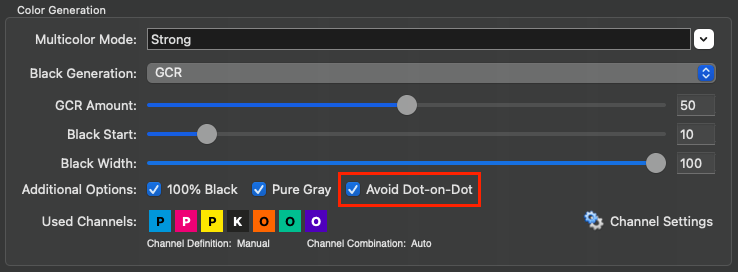
Background: When using gamut extending process colors in traditional AM screening, such as CMYK+Orange+Green+Violet/Blue, the process colors Violet or Blue are often on the same screening angle as Black which can cause dot-on-dot issues leading to color and lightness variances. However, avoiding Black and Violet/Blue color combinations in separations would reduce the available gamut considerably and would also prevent dark bluish spot colors from being reproduced faithfully. By activating this feature, the separation uses more of the CMY colors instead of Black thereby preventing dot-on-dot effects. For this function to work best, use a late Black Start and a rather weak GCR or even a UCR Black Generation setting.
Note: Other color combinations using the same AM screening angles such as Cyan and Orange or Magenta and Green are not affected by this feature as those combinations are rarely used in separations anyway.
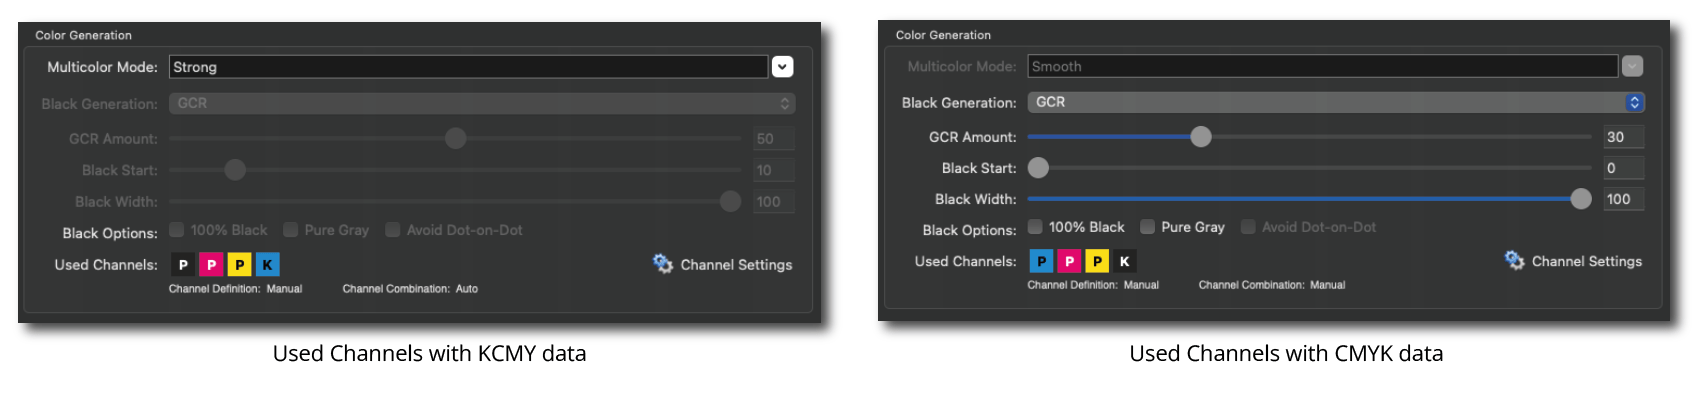
Used Channels: Displays the channels to be used in a profile. Excluded channels are grayed out and marked with an X. All settings that affect channels, such as channel definition, channel combination, or enabling/disabling channels, can be configured in the Channel Settings. This can be done both automatically and manually.

The effect of selecting or excluding colors on Curves and the Gamut is immediately visualized in the graphic and the Black Point value.
Note: The excluding channels function is particularly intelligent for Multicolor profiles, as it searches for replacement colors in the Multicolor channels when excluding a channel (e.g., Cyan), which can compensate for the missing channel in the gray balance. The alternatively calculated Multicolor channels are displayed grayed out in the panel Black Point and TAC (further information can be found in the toggle Black Point and TAC).
Example: If a brown chocolate artwork is intended to be printed in CMYK without using any Cyan in the separation, a CMYK printer profile can be created which only uses MYK. These types of profiles avoid unwanted Cyan dots in the separation and the converted artwork would appear visually close to a conversion with a complete CMYK profile. Obviously such a profile should not be used if the artwork contains Cyan based color combinations, such as cyan tones and blue or violet colors.
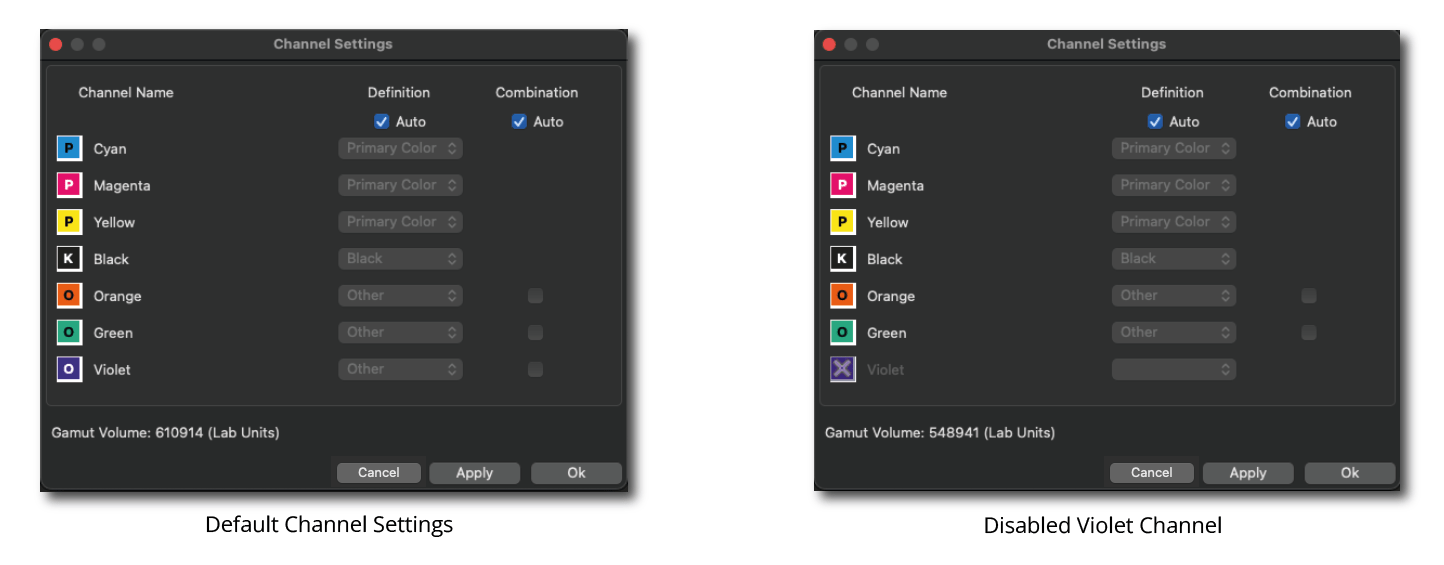
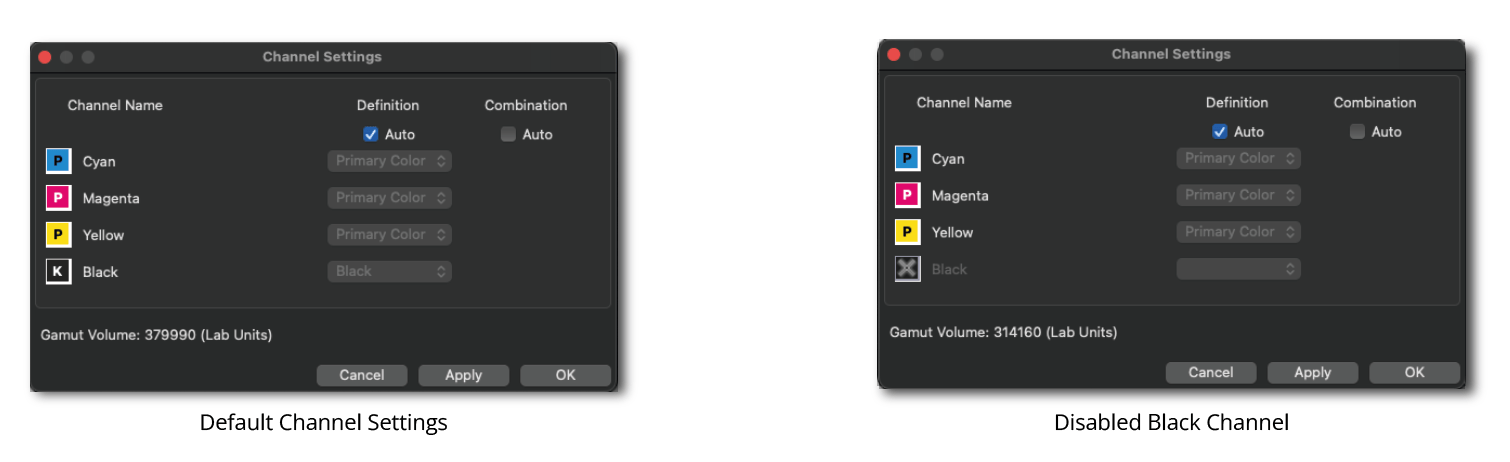
Channel Settings: By default, all channels of the profile are enabled, and all Channel Settings are set to Auto. Channels can be enabled or disabled by clicking on the icon of the desired channel. It is possible to exclude multiple channels.
Note: In CoPrA, the default channel order in the measurement data has always been: Three primary colors (P), optional black (K) and optional additional (other) colors (O). This definition was applied regardless of whether the order could be handled correctly or not.
The Channel Settings option allows editing channels that are not defined in the correct order so that they can be used correctly in CoPrA.
Definition: The channel Definition determines the assignment of the channels, i.e., whether it is a primary color (e.g., CMY), black or another gamut-extending (spot) color. This assignment can be done automatically or manually. By default, the order is set automatically (Auto).
An important element of the channel Definition is the inherent flexibility to achieve the maximum gamut volume from the measurement data used.
Note: There are several reasons why the channel sequence of a file does not match the required print sequence (i.e., the sequence of the inks as they are printed on the press).
Using the Channel Settings, it is possible to temporarily change the channel sequence for internal calculations in order to set the optimum channel sequence to achieve a good profile, but without changing the measurement data itself. Afterwards, the channel sequence in the profile is reverted to the original (required) sequence.
A typical example is the KCMY print sequence in offset printing. Here, black is printed first, then cyan etc., but the CMYK channel sequence is always used in the measurement data and ICC profiles (with K at the end). This is done because CMYK is a defined color space that is correctly interpreted and used in all common prepress workflows, whereas a different channel sequence (such as KCMY), although necessary for printing, would lead to interpretation problems in the prepress workflows.
Furthermore, in some applications, a specific color sequence must be adhered to on printing presses, and the RIP assigns a linearization to this sequence. The profiling chart is then defined and printed based on this sequence.
In other applications, such as ceramic printing, standardized CMYK colors are not used, and a specific sequence is not provided.
In addition, different densities of the colors used can result in colors being swapped to obtain a larger color space (e.g., Magenta and Red).
If Auto is enabled, CoPrA automatically calculates and selects the ink definitions and the combinations with the largest gamut. The size of the Gamut Volume and the combined channels are displayed.
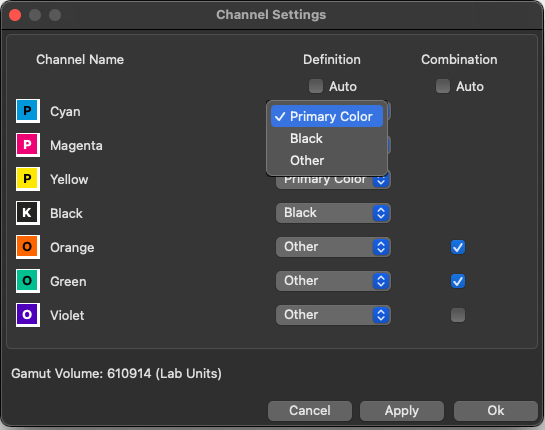
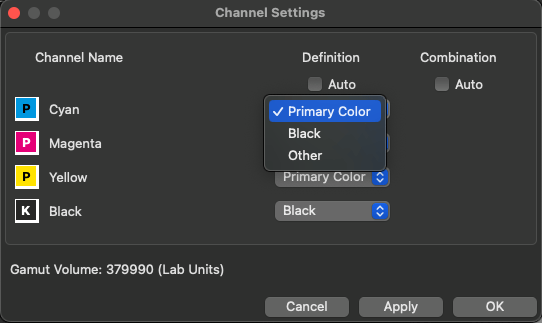
Manual Definition: If required, the channels can be manually assigned a custom definition. There are three options per channel available.
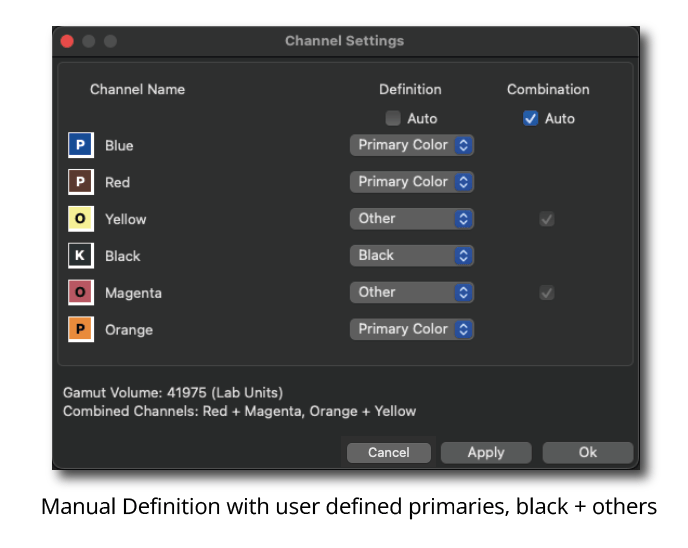
Primary: The data must contain three primary colors.
Black: One channel can be defined as black.
Other: Additional colors get the status Other.
After defining the channels and confirming the settings with Apply the Gamut Volume is calculated and displayed. By clicking OK the changes are applied and the window is closed.
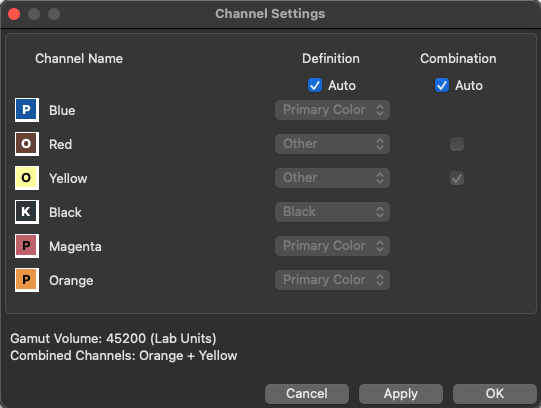
Combination: The channel Combination specifies the Multicolor channels which are to be combined to expand the color gamut. This can be assigned automatically (which is the default for measurement data ≥4CLR) or manually.
Auto: This checkbox is enabled by default for all Multicolor presets. When enabled, CoPrA automatically calculates and selects the ink combinations with the largest gamut and indicates the combined channels. The combined channels are displayed in the Channel Settings window and also below the Curves and Gamut previews. In both previews CoPrA shows the impact of the combined colors by the Gamut Volume number.
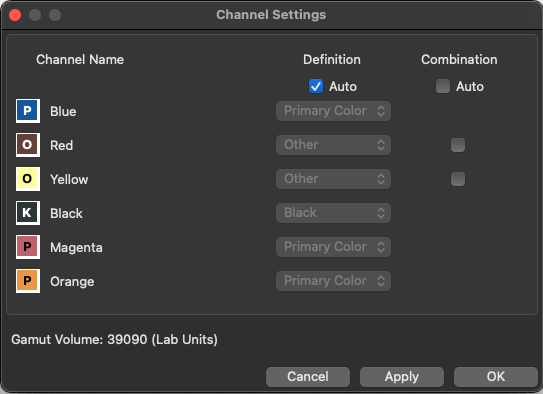
If the Auto checkbox is disabled, the channels can be defined manually by clicking the checkboxes of the desired combinable channels. If the additional inks are not to be combined with the four standard inks, the channels of the additional inks can be disabled.
Note: All profile settings, including those from the Channel Settings window, are embedded in the profile, and can be imported and used to reproduce settings by dragging an ICC profile onto the Setting drop-down menu. The name of imported profiles is given the suffix (imported).
Background: The channel Combination option is intended for creating Multicolor printer and DeviceLink profiles used in industrial applications such as ceramic printing, glass or metal decoration or textile printing, with Multicolor inks.
In these industries, special inks different from CMYK are often used in order to increase the color gamut in the shadows and some colorful areas, or to reduce costs.
For example, a dark Red ink can be combined with a Magenta ink of similar hue to extend the color gamut in the dark areas of the ceramic print. Similarly, a light Gray can be used in combination with the Black channel in Flexo printing to create a smoother gradient from light to dark grays.
CoPrA 8 and higher automatically detects if additional inks are either typical gamut-extending colors or special inks and will use them accordingly. For example, two inks with a similar hue but different chroma or lightness can be combined in a single channel.
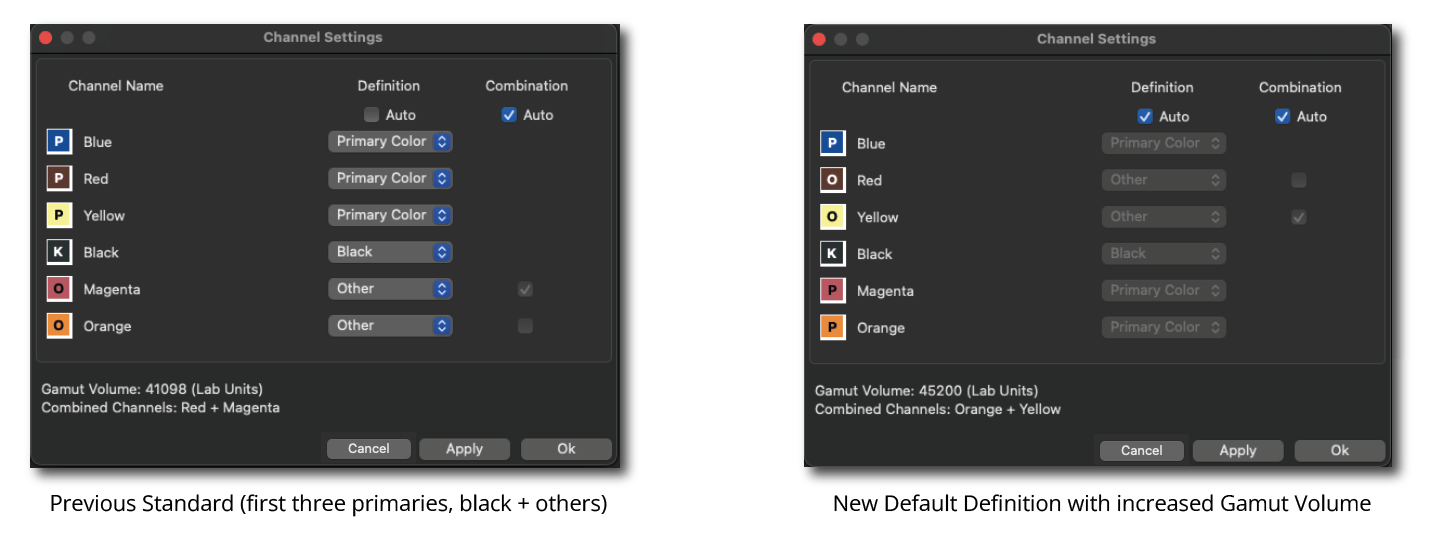
Example: If the Auto checkbox is activated, CoPrA calculates for the 6 color inks of the example data set (see screenshot) that the second channel (Magenta) can be combined with the 5th channel (a dark Red ink) to increase the gamut in the dark areas.

The Curves show that Magenta is used for lighter colors, while more of the dark Red channel is used for darker colors with the Magenta channel being reduced to a minimum.
On the other hand, the 6th channel (Orange) is a typical gamut-extending color and as such is automatically used by the selected Multicolor Mode in the Magenta-Yellow range of the color space.
The Auto function determines the best combination of additional inks and their combination with the 4 standard inks to achieve the largest color Gamut Volume.
Note: Typical gamut-extending colors used in ECG printing such as Orange, Green or Violet can not be combined with the 4 standard inks (CMYK).
In industrial printing, it may be necessary to use combinations other than those recommended by the Auto function. By deactivating the Auto checkbox you can select custom channel combinations, provided that a combination of inks is applicable.
Regarding the example in the screenshot, when the Auto checkbox is deactivated and channels can be combined, Magenta and dark Red are combined, and Yellow and Orange are combined, resulting in two channels under Combination.
If the dark Red channel is disabled under Combination, only the Yellow and Orange inks are combined. Switching to the Gamut view allows comparing the impact of the combinable channels on the Gamut Volume number.
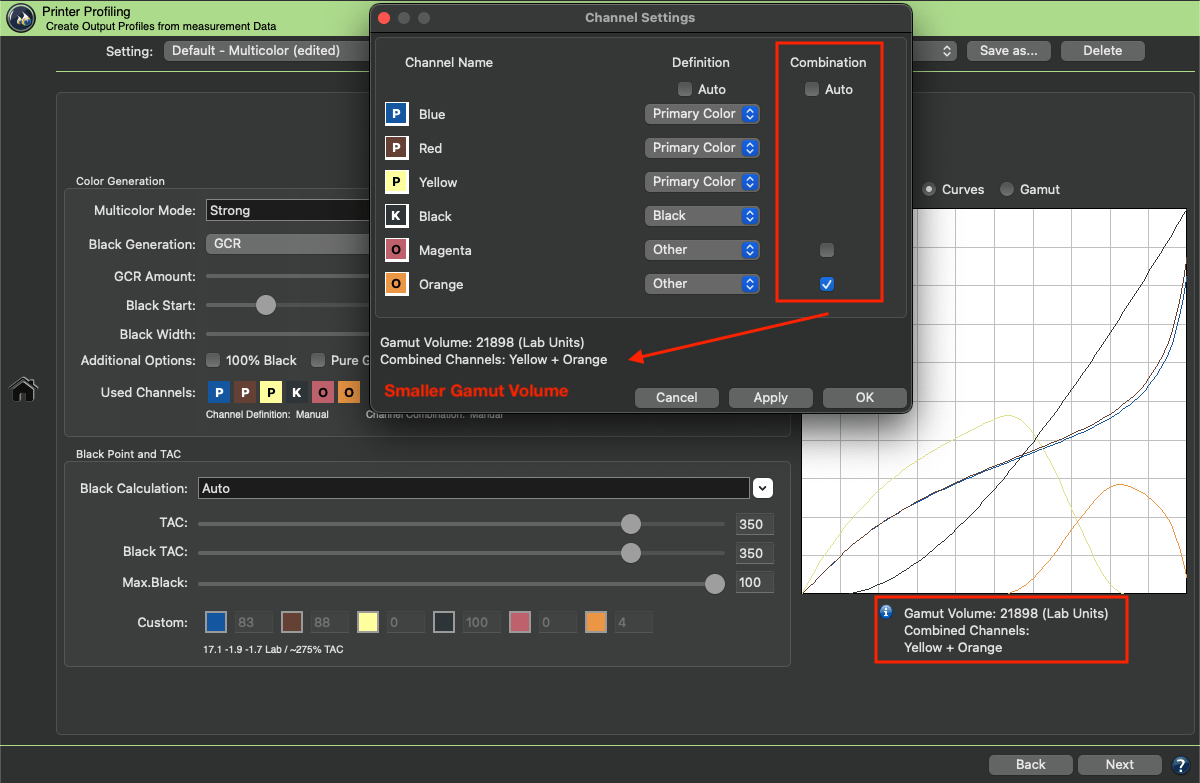
Note: The channel Combination differs from the Used Channels! Channels that are disabled under Used Channels are not used in the separation. Usually, it is recommended to use all channels and not to disable any channel if you want to combine channels.
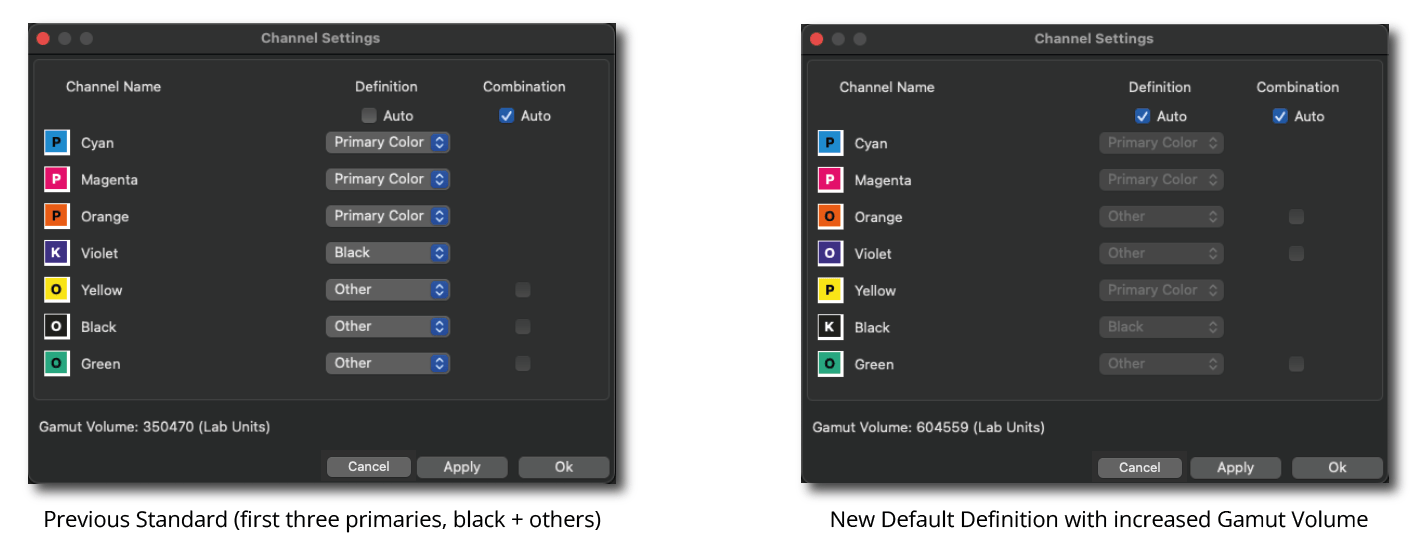
It is recommended to use the default Auto setting for the channel Definition and Combination, as it automatically calculates and selects the ink definition and combinations with the largest gamut and indicates the combined channels.

In our example the Magenta and Orange channel will be used as a Primary Color and Yellow is now combined with Orange.
Color Generation for CMYK Profiling
Multicolor Mode: Not applicable for CMYK profiling.
Black Generation: Defines the method for the generation of black in the target color space and therefore influences the separation comprehensively.
The following modes are available in the drop-down menu:
Auto: Uses a medium GCR amount which is based on the measurement data.
UCR: Allows adjustment of the settings Black Start and Black Width.
GCR: Additionally allows the adjustment of the setting GCR Amount.
MinK: Uses only a minimal amount of black and generates a separation using the maximum amount of CMY.
MaxK: Uses a maximal amount of black and generates a separation using the minimum amount of CMY.
The methods UCR, GCR, MinK and MaxK generate a new separation, regardless of the separation of the target profile.
GCR Amount: Defines the amount of CMY that is replaced by black. At 0 only a low GCR amount is used which mainly impacts the shadows whereas at 100 a very strong GCR is used which effects the shadows and the highlights.
Black Start: Defines the starting point for the black generation. Black will be used if the minimum amount of CMY exceeds this limit.
Black Width: Defines the range in which black is generated outside the color-neutral area. The lower the value, the less black will be generated outside the color-neutral area.
Additional Options
100% Black: Prevents a pure black RGB text from being printed in four colors after conversion into a CMYK profile which would result in a blurred looking text. This is often the case with Office documents. Enabling 100% Black converts an RGB value of 0-0-0 to CMYK 0-0-0-100 (i.e. 100% black).
Pure Gray: Enabling this checkbox in a CMYK printer profile results in a gray balance which is composed of black ink only. However, this only makes sense if the printing system features a very neutral black from shadows to highlights.
Enabling Pure Gray in an RGB printer profile results in a gray balance which is composed of equal amounts of RGB values. This proves to be useful in RGB controlled (inkjet) print drivers.
Used Channels: Displays the channels to be used in a profile. Excluded channels are grayed out and marked with an X. All settings that affect channels, such as channel definition, channel combination, or enabling/disabling channels, can be configured in the Channel Settings. This can be done both automatically and manually.

The effect of selecting or excluding colors on Curves and the Gamut is immediately visualized in the graphic and the Black Point value.
Channel Settings: By default, all channels of the profile are enabled, and all Channel Settings are set to Auto. Channels can be enabled or disabled by clicking on the icon of the desired channel. It is possible to exclude multiple channels.
Note: In CoPrA, the default channel order in the measurement data has always been: Three primary colors (P), optional black (K) and optional additional (other) colors (O). This definition was applied regardless of whether the order could be handled correctly or not.
The Channel Settings option allows editing channels that are not defined in the correct order so that they can be used correctly in CoPrA.
Definition: The channel Definition determines the assignment of the channels, i.e., whether it is a primary color (e.g., CMY), black or another gamut-extending (spot) color. This assignment can be done automatically or manually. By default, the order is set automatically (Auto).
An important element of the channel Definition is the inherent flexibility to achieve the maximum gamut volume from the measurement data used.
Note: There are several reasons why the channel sequence of a file does not match the required print sequence (i.e., the sequence of the inks as they are printed on the press).
Using the Channel Settings, it is possible to temporarily change the channel sequence for internal calculations in order to set the optimum channel sequence to achieve a good profile, but without changing the measurement data itself. Afterwards, the channel sequence in the profile is reverted to the original (required) sequence.
A typical example is the KCMY print sequence in offset printing. Here, black is printed first, then cyan etc., but the CMYK channel sequence is always used in the measurement data and ICC profiles (with K at the end). This is done because CMYK is a defined color space that is correctly interpreted and used in all common prepress workflows, whereas a different channel sequence (such as KCMY), although necessary for printing, would lead to interpretation problems in the prepress workflows.
Furthermore, in some applications, a specific color sequence must be adhered to on printing presses, and the RIP assigns a linearization to this sequence. The profiling chart is then defined and printed based on this sequence.
In other applications, such as ceramic printing, standardized CMYK colors are not used, and a specific sequence is not provided.
If Auto is enabled, CoPrA automatically calculates and selects the ink definitions with the largest gamut. The size of the Gamut Volume is displayed.
Manual Definition: If required, the channels can be manually assigned a custom definition. There are three options per channel available.
Primary: The data must contain three primary colors.
Black: One channel can be defined as black.
Other: Additional colors get the status Other.
After defining the channels and confirming the settings with Apply the Gamut Volume is calculated and displayed. By clicking OK the changes are applied and the window is closed.
Use case: How to create a CMYK profile from KCMY data
By default, measurement data which uses a different channel order than CMYK (e.g., KCMY) is treated as 4CLR data, even when the Channel Definition is set to Auto, in order to assign the correct definition per channel and achieve the maximum gamut volume.
As a result, the Multicolor Mode “Strong” is used to create a profile without Black (CMY only) with a maximum Gamut Volume of 312949 (Lab Units).
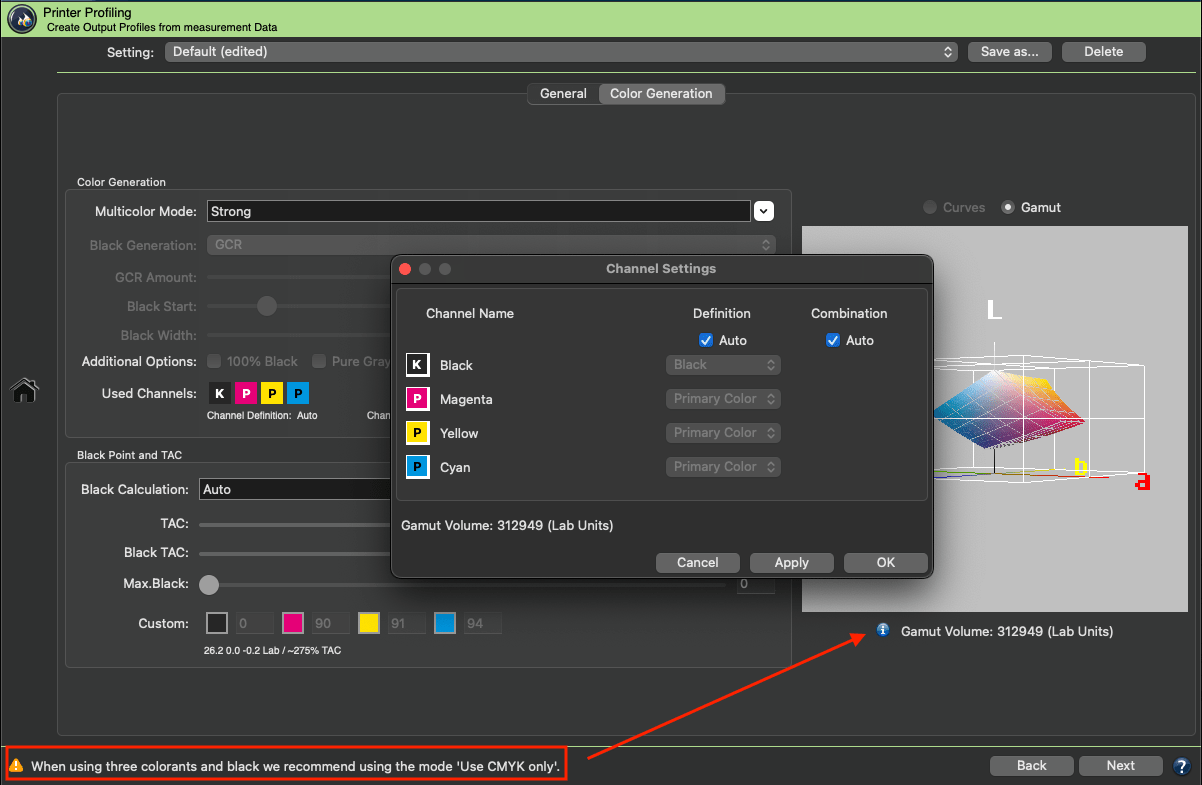
However, the recommended Multicolor Mode “Use CMYK only” creates a black separation with Black, increasing the Gamut Volume to 378490 Lab Units.
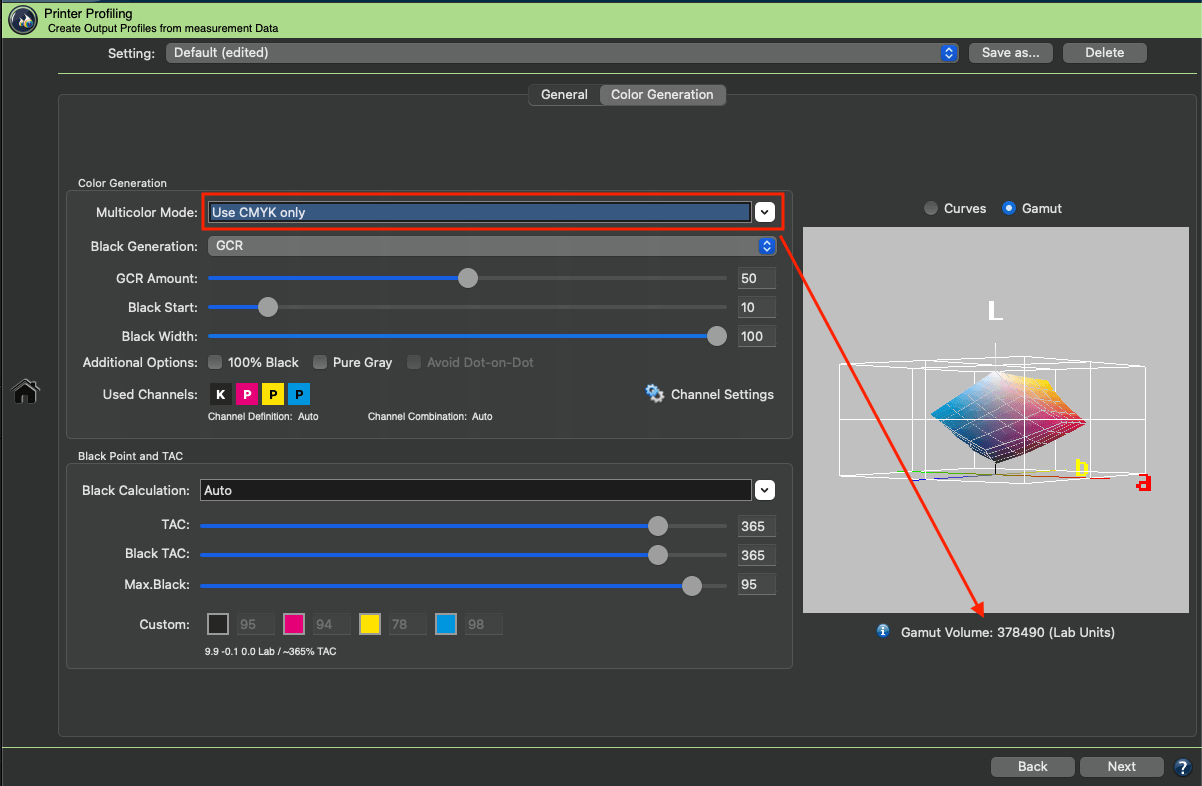
Therefore, to create a CMYK color space profile based on KCMY data, it is necessary to select the option Calculate CMYK Profile. This CMYK profile can be used, e.g., in DeviceLink profiling as a source or target profile or in image editing applications.
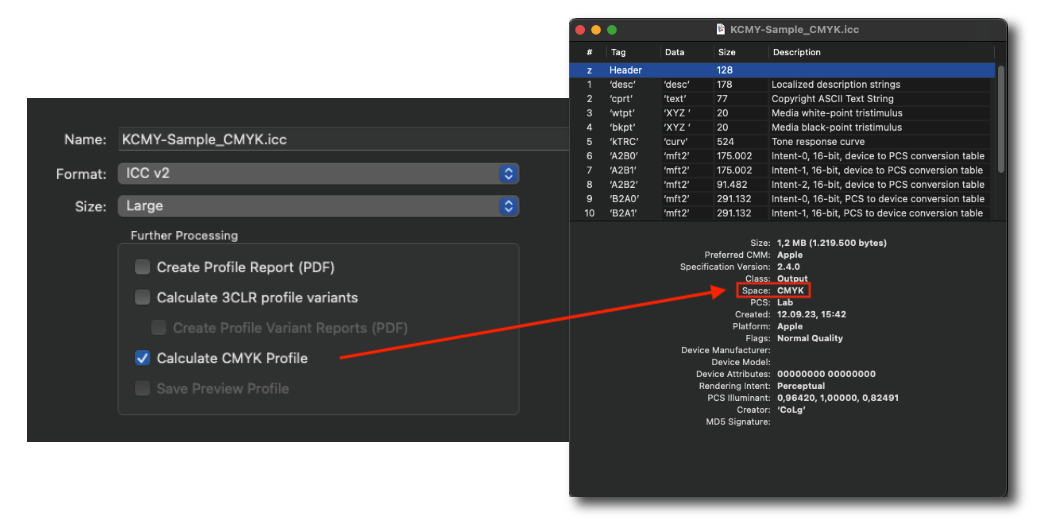
Note: All profile settings, including those from the Channel Settings window, are embedded in the profile, and can be imported and used to reproduce settings by dragging an ICC profile onto the Setting drop-down menu. The name of imported profiles is given the suffix (imported).
Black Point and TAC
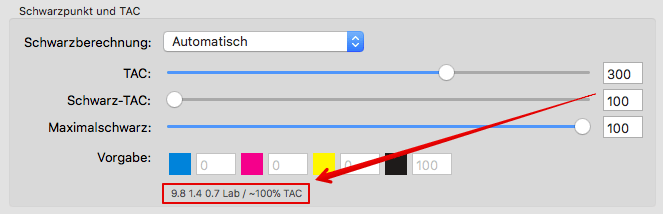
Under Black Point and TAC the overall Total Area Coverage (TAC) and the TAC for the black point (Black TAC) can be defined. The black TAC represents the darkest color value of the profile which is usually identical with the maximum TAC.
The graphical display of each color contains a number field showing the amount of ink used in the profile. Depending on the selected Black Calculation the number fields are either enabled or disabled.
Note: The default window size sometimes truncates the input fields for Multicolor channels. Enlarge the window to display the input fields for all colors.
Customize TAC settings
Black Calculation: Four different settings available for Printer Profiling (see screenshot below).
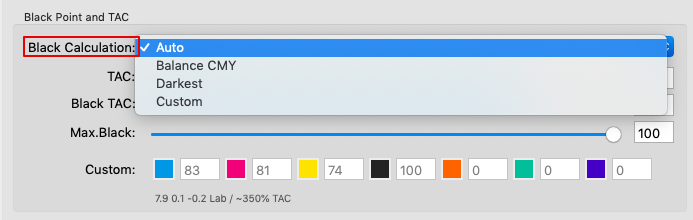
Black Calculation settings
Auto: The calculation of the optimal black point (dark and neutral) is based on the measurement data. The values entered for Black TAC and Max.Black define limits which must not be exceeded, but may be lower if technically possible.
All channels are used to generate the black point (Black TAC), therefore individual channel editing is disabled. This mode will not use any Multicolor channels beside the first four channels (usually CMYK).
Note: If you do not have a default value for the Black TAC it is recommended to use 400% for the Black TAC as a starting point for the calculation.
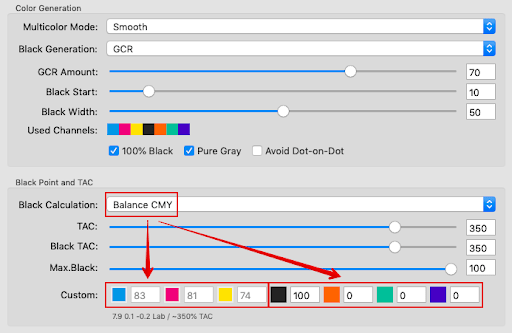
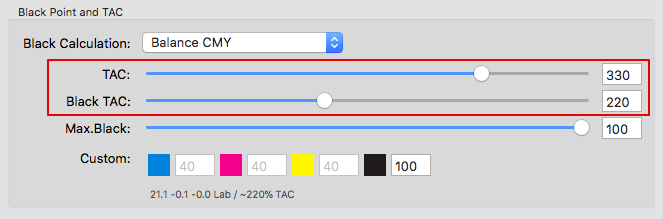
Balance CMY: This setting adapts the CMY values to a pre-defined Max.Black value and generates a neutral black point. Define the Black TAC and TAC in accordance with the printing conditions. Max.Black should be set to the ideal value for the selected substrate. Similar to the setting Auto those values are regarded as maximum values which may be underrun if a neutral black point is not achievable.
Allows customization of the black channel (or in general the 4th channel) and the addition of Multicolor channels. Entered Multicolor color values are fixed - like the Max.Black value - and CMY values will be adjusted accordingly.
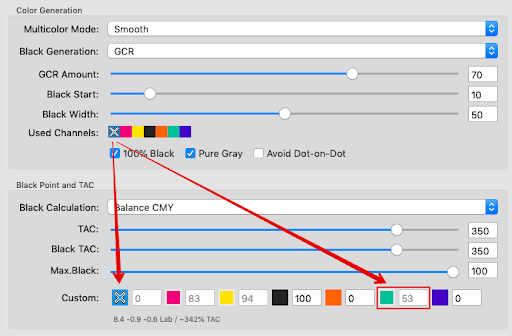
Note on excluding channels:
Basically, Balance CMY allows editing of the black channel (or in general the fourth channel) and the Multicolor channels. The CMY channels are grayed out (see screenshot).
However, if a channel is excluded, the Multicolor channels are searched for a replacement color that can compensate for the missing channel in the gray balance. The replacement Multicolor channel is grayed out in the control panel Black Point and TAC (see screenshot).
Darkest: Calculates the darkest possible black point with maximum density/lowest L*. Allows generation of a black point without neutral a* and b* values and darker L* if available.
The values entered for Black TAC and Max.Black define limits which are not exceeded but may be lower if technically possible. Darkest uses the first 4 channels, usually CMYK. Possible Multicolor channels are added, but cannot be changed manually. If this is required, the Custom option must be selected.
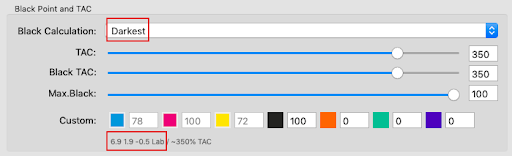
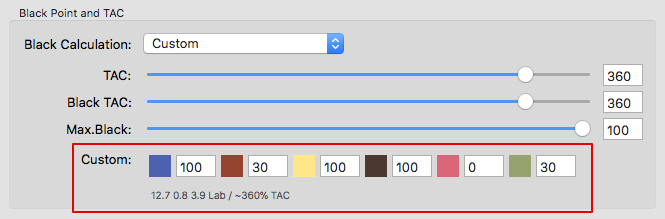
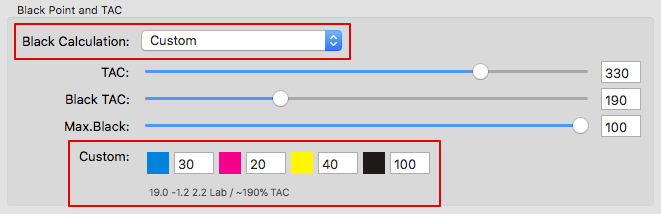
Custom: Allows definition of the black point in the input boxes. The Black TAC value will then be recalculated. Allows editing of all channels.
Notes:
- CoPrA calculates the Lab values based on the entered custom values. When changing custom values the resulting effects can be seen immediately. If you prefer CoPrA's recommendations, select the settings Balance CMY or Auto.
- For Multicolor profiles with more than four channels you can use the extra Multicolor channels for the black generation besides the first four channels (typically CMYK). However, the total area coverage (TAC) cannot exceed 400%. Values for the Multicolor channels can be entered manually when using the settings Balance CMY or Auto and these values will then be used to calculate the Black TAC. Usually, it is not necessary to use those channels but sometimes a dark Multicolor channel adds desired contrast and definition. This can easily be checked by viewing the Lab values below the Custom fields. If the addition of a certain Multicolor channel decreases L* while a*b* values are not significantly altered, using this channel can be considered. However, the gray balance will use additional channels as well.
How CoPrA calculates Lab values
Note: With the settings Auto or Balance CMY CoPrA tries to use neutral a* and b* values for the Black Calculation. In contrast, selecting the setting Custom allows generation of a black point without neutral a* and b* values. Keep in mind that this can lead to a colored black point, which you can recognize by the a* and b* values.
TAC: The value for the maximum total area coverage can be entered in the input box TAC (value range: 0 to 400%). This value must not be exceeded. This also applies to Multicolor profiles. The TAC can also be set for 2 or 3 channel profiles.
Black TAC: The Black TAC is the sum of all color values. The value for the black point (Black TAC), which results from your settings, will be displayed after a short calculation time below the text box Custom (outlined in red in the screenshot below).
Note: The sliders limit each other, so the TAC can never be lower than the Black TAC (but it can be higher).
Max.Black: Here you specify the maximum amount of black ink to be used by the separation (value range: 0 to 100%). Note that the entered value always refers to the fourth channel which, in Multicolor cases, may not be black but a chromatic color. Furthermore, the fourth channel of the Black TAC is always used for the darkest point of the profile, the black point.
Black Point and TAC
The Total Area Coverage (TAC) and the TAC for the black point (Black TAC) can be defined by Black Point and TAC. The Black TAC represents the darkest color value of the profile which is usually identical to the maximum TAC.
Many modern printing systems allow a black point that is generated by using a low amount of ink. Sometimes the darkest color (Black TAC) can be printed using pure black which means that in extreme cases a black point of 100% K may be sufficient. Obviously, such a low TAC does not work for other color areas – it would not even be possible to print a true red, green or blue! Therefore, we separated the Black TAC from the general TAC. This allows using the best setting for Black Calculation without restricting the color space.
Adjusting the Black TAC value
The Lab value is particularly handy for assessing the effect on the black point when changing the TAC or Black TAC. The smaller the L* value, the deeper the black and the higher the contrast.
TAC and Black TAC can be adjusted separately in CoPrA
The total area coverage (TAC) - defined by the separation - and the Black TAC are identical in traditional printing systems. However, industrial printing applications and many digital printing systems show that the black point can be selected much lower than the total area coverage. To achieve a sound gray balance with a high contrast while maintaining highly saturated colors it is necessary to separate these two settings.
Advantages of a separate Black TAC
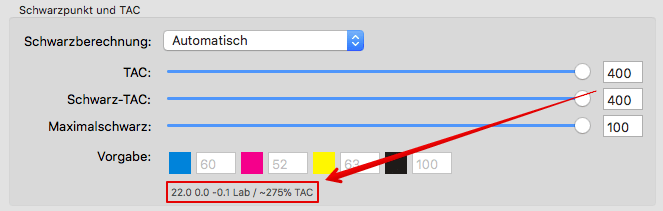
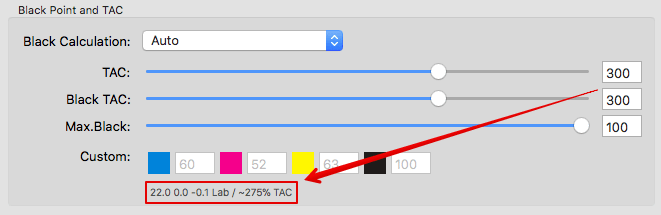
We would like to demonstrate how important it is to adjust the Black TAC independently from the total area coverage (TAC) using a digital printing system. Let's assume the Black TAC and TAC could not be set separately and we had to use identical values for both of them. If you selected the setting Auto to calculate the black point and set a TAC of 300% (and therefore a Black TAC of 300% as well), CoPrA would calculate the best black point for this case. The result would be a total area coverage of 275% with a neutral black point (a* and b* are 0 respectively), but with a very light L* of 22.0 (outlined in red in the screenshot).
CoPrA allows the setting of the Black TAC separately from the total area coverage (TAC). As pure black is used in some digital printing systems as darkest printing color, the Black TAC can be reduced to 100% which results in a black point with a significantly darker (lower) L* value of 9.8. Using a separate setting for the Black TAC achieves a significantly higher and better contrast than a TAC which is linked to a Black TAC of 275%. Additionally, a total area coverage (TAC) of 300% ensures highly saturated colors. These precise settings are only possible with separate TAC values.
Curves and Gamut
Curves and Gamut: Visualize the effects of the selected color separation and Black Point settings. The Gamut view shows changes of the gamut shape immediately when altering settings and provides a real time preview of the loaded measurement data. In addition, the Gamut Volume is calculated and expressed in Lab units using absolute colorimetric rendering intent which allows finding the settings that produce the largest gamut (highest number) easily.
Example: The gamut view allows you to observe how a low Black Width setting or a very late Black Start reduces the ability of a profile to render dark colors.

Graphical representation of the gamut
Gamut Zoom: Increase or decrease the Gamut view with the mouse wheel, or by pressing cmd (macOS) or ctrl (Windows) and the left mouse button while moving the mouse forward (to zoom out) or backward (to zoom in).
Context menu of the Gamut view
A context menu that provides additional viewing options can be opened by right-clicking on the gamut view. The Grid, Axes and Axes Labels and the Measurements of the underlying data can be switched on and off here. The sphere size can also be increased or decreased using a key combination (macOS: Option+ / Option-, Windows: ALT+ / ALT-). For a better display of the Measurements, the gamut view can be switched between a Gamut Surface view and a polygonal gamut grid view.
The options last used in the Gamut view are saved and applied again when CoPrA is restarted.

Measurements: Shows the Measurements of the underlying data in the Gamut view which allows analyzing the patch distribution within the profile gamut so that the measurement data can be optimized in ColorAnt beforehand if necessary.
Profile Processing
Format, Size and Further Processing
Various settings for the profile calculation can be defined in the last step, such as Name, Format, Size and Further processing. The identifier ‘updated‘ is added to the name to mark the updated profile as such.

Name: Type in a Name for the profile.
Templates: Allows to select and combine name components from a list of options and save them as custom templates. The last selected template is used when creating new profiles, so the naming of profiles is automated.
Available naming options depend on the current profile type and include Date, Date/Time, Measurement data file name, Source and Target profiles, Name of the current preset and others. Each name component can be added at a user-defined position under Template (the position is selected with the mouse pointer). The Example section below shows the resulting name. Additionally, user defined text can be added at any position within the Template field.

Format: Define the Format of your profile. An ICC format in accordance with specification v2 is recommended as basic setting however, the newer format ICC v4 can also be chosen. In this case, please ensure that your programs support this format correctly.
Note: ColorLogic products handle and use ICC v4 profiles consistently and correctly.
Size: The setting Large is recommended. The size specifies the number of grid points in the profile and determines the amount of disk space required for the generated profile. Small profiles should only be used for test purposes. Very Large profiles can slow down further processing in subsequent programs. Additionally, some programs are not able to handle very large profiles.
Further processing
Create Profile Report: Recommended to activate. The PDF report provides an overview of the quality of the profile based on statistics, diagrams of gray balances, gradients and gamut representations.
Under Preferences, the Default save path for the reports and the Default report format can be selected. If XML is selected as the format, the corresponding XSD files will be created automatically as well.
Create Profile Comparison Report (PDF): A Profile Comparison Report can be created in addition to or as an alternative to a Profile Report. It provides information about the extent to which the printer profile and the updated profile reflect the measurement data and the improvements that can be achieved using the updated profile.

Create Correction DeviceLink Profile: Creates a Correction DeviceLink Profile for the updated printer profile (in addition to the updated printer profile). This allows customization of the print data to compensate for color variations and to achieve a color reproduction which truly reflects the reference profile before the color changes. Using a Correction DeviceLink Profile ensures a consistent color reproduction.
Note: The Correction DeviceLink Profile will be created automatically assigning the name automatically as well. The assigned profile name consists of the source and target profile and the name of the default setting (for example, Digital Printer, InkJet, etc.). If a different name is preferred, or if settings need to be edited, the Correction DeviceLink Profile can be created manually (using the tool DeviceLink Profiling). The Correction DeviceLink can then be selected in the color server ZePrA under Configurations in the tab Document/Target in the Target Color Space section as Correction DeviceLink Profile.
Create Correction DeviceLink Comparison Report: A Correction DeviceLink Comparison Report can be created in addition with the profile.
In the Comparison to Printer Profile (Updated Profile and Correction DLP) section of the comparison report, the Match score shows the quality of the Correction DeviceLink Profile to reproduce previous jobs with the new Correction DLP as well as possible.
In addition, a detailed view of the measurement data is listed with an overall DeltaE evaluation comparing the Printer Profile with the Correction DeviceLink Profile.
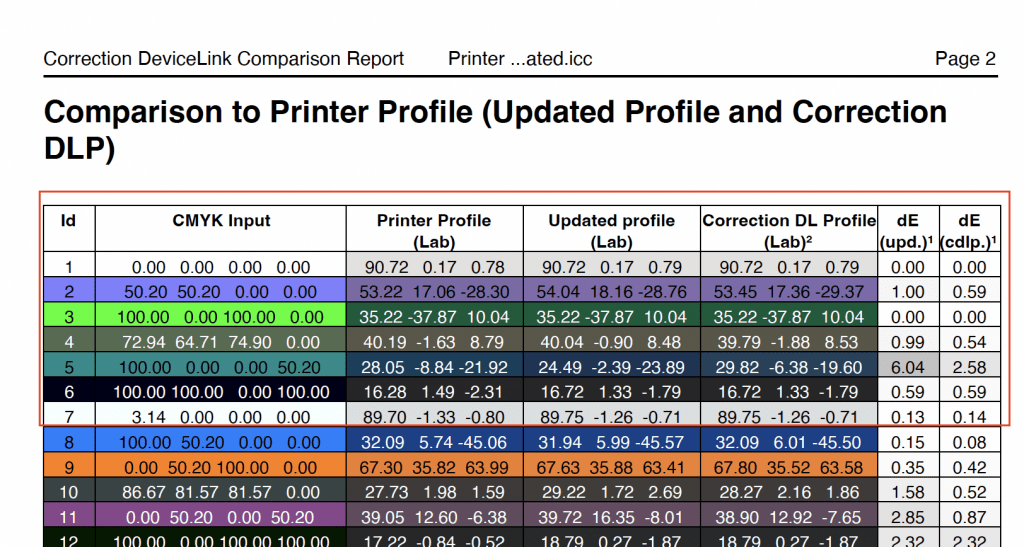
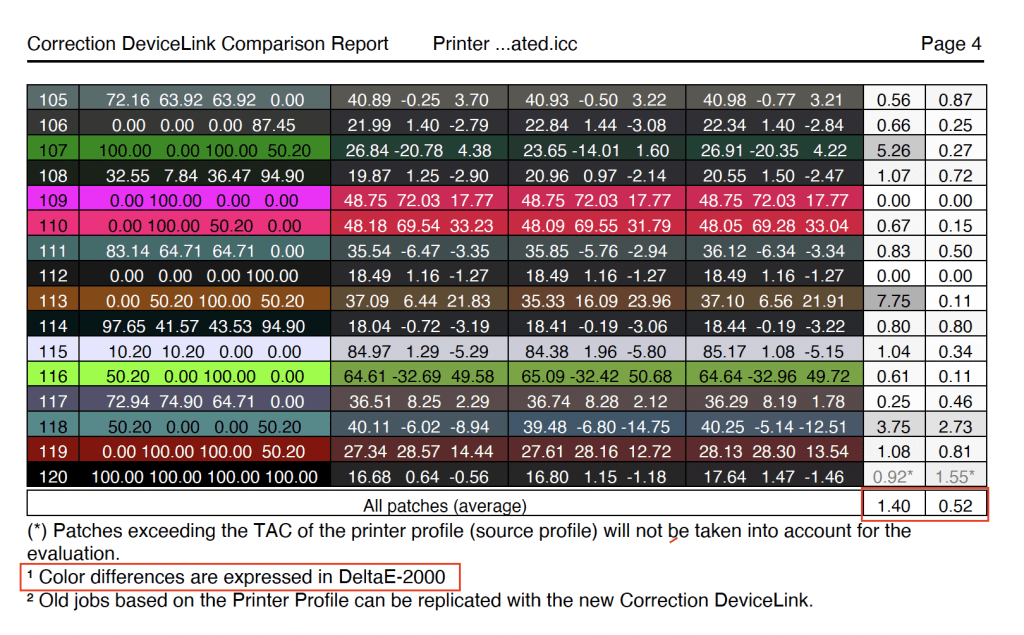
Save: Creates the printer profile and saves it in the folder Profiles (macOS) or Color (Windows), (macOS: /Users/Username/Library/ColorSync/Profiles, Windows: C:\Windows\System32\spool\drivers\color). Demo and encrypted profiles will be saved in a different location only relevant for ColorLogic applications.
Note: CoPrA-SP profiles are stored in the ColorLogic subfolder Licensed-Profiles.
Profile Reports
Profile reports can be created for Printer or DeviceLink profiles. To do so, activate the checkbox Create Profile Report in the last step of the profiling or, when updating profiles, the checkbox Create Profile Comparison Report.


Depending on the type of profile the report contains various statistical data, such as statistics about profile precision (Integrity, Precision, Black Point, White Point etc.), graphic representations of curves and gamuts (Gray Balance, Gradients etc.), conversions of test images, separations and color patches to evaluate the smoothness or the purity of colors. All this facilitates the detection of artifacts that may be present.
Profile reports can be created at any time in Batch Overview or in Profile Manager which, by the way, is not restricted to ColorLogic profiles.
Under Preferences you can define some basic settings for the creation of the profile report, such as the Default save path, the Default report format (PDF or XML) or the DeltaE method (dE76 or dE2000). If XML is selected as the format, the corresponding XSD files will be created automatically as well.
Note: If a profile comparison report is created when updating a profile, the measurement data obtained from the update test chart will be compared to the data of the original profile (reference profile).
If the checkboxes Brightener Compensation or Measurement Correction have been activated, the data of the original profile will not be compared to the measurement data from the update test chart but to the data modified by these options.