Viewing and Analyzing Measurement Data
To view measurement data, select the data in the Data Sets area and open the View window. Five different options allow for a quick overview of all color patches in the measurement file: the 2D view shows the reference and the corresponding Lab values for each patch, a 3D rotating view of the color space, TVI displays the curves for each channel, Spider Web and various Curves of gradations.
View Options
The View window provides plenty of features that facilitate the evaluation of measurement data. Filters allow combining individual channels. Combinations of 2, 3, 4, 5 or 6 channels, as well as one and two channels in combination with black, can be faded in and out. In addition, these filters are available in 2D and 3D view.
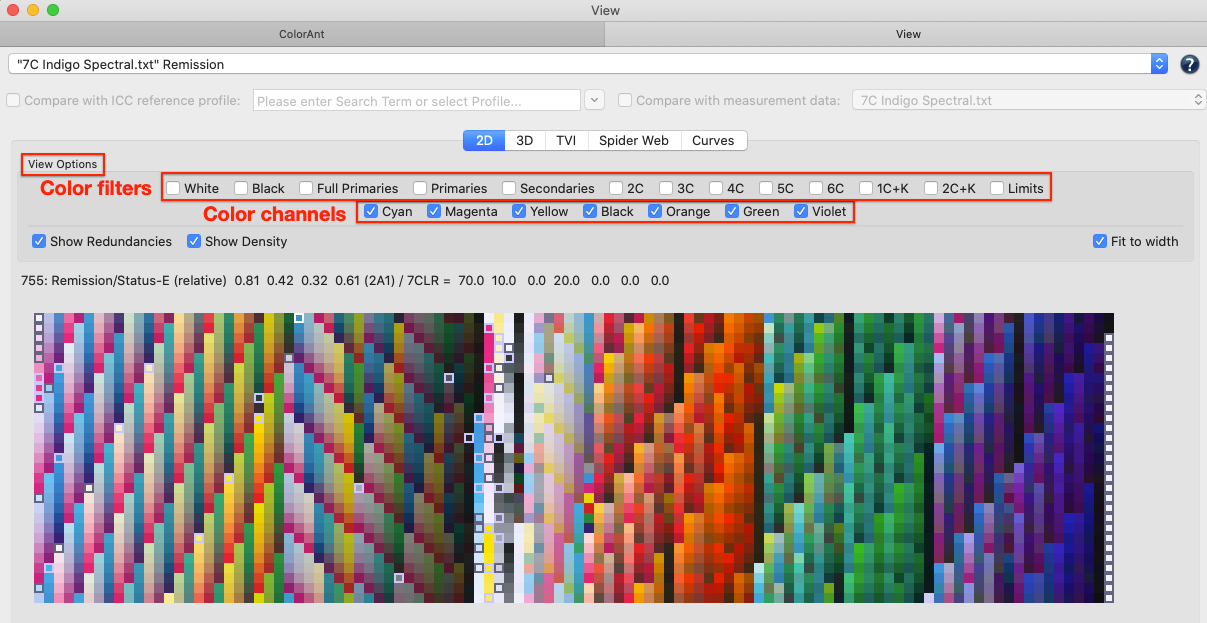
The number of displayed color patches is shown on the left, i.e. if one or more filters are selected, the number of affected color patches and the total number of patches are shown on the left.
Color filters: Using the checkboxes, colors can be selectively displayed in 2D and 3D view. All other color patches are then hidden. This allows you to immediately find selected colors in the test chart layout.
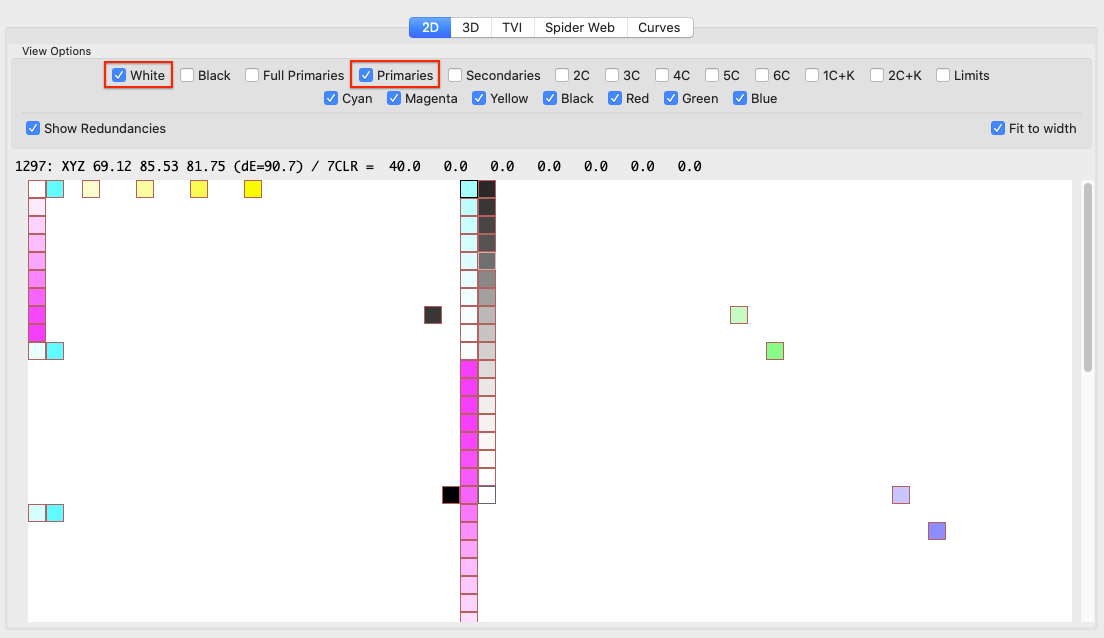
In 3D view, the color gamut defined by the color filters is displayed. This way, the Full Primaries, Limits, Primaries, Secondaries, White or Black can be viewed separately. With Multicolor data, it is easy to recognize in which areas the additional colors extend the color gamut compared to CMY or CMYK.
There are some dependencies between the color filters, so selecting a certain color filter may automatically activate another color filter (or even several others). For example, if the Secondaries checkbox is activated, the Primaries and White color filters are also automatically activated. They can be deactivated if only two color combinations (Secondaries) are to be highlighted.
Color channels: By selecting color channels, either all color patches or only the color patches of the selected color channels can be displayed. Color channels can be combined with color filters so that, for example, only the Multicolor Primaries or Secondaries can be displayed. Duplex and triplex colors can be displayed by individual selection of suitable color channels (for example, Cyan + Black shows duplex colors and Cyan + Magenta + Black shows triplex colors).
Zoom: The Zoom function allows a closer look at the color patches of the measurement file. Use the shortcuts CMD + and CMD – to zoom in and out (STRG on Windows).
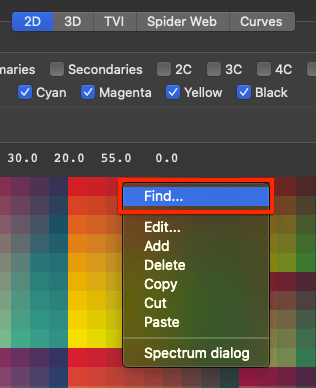
Find: The Find function allows searching for IDs, names, CIE data and DCS data. It can be accessed with a right mouse click via the context menu (or the STRG+F shortcut).
When searching for color values all exact matches are marked. If there is no exact match, the closest patch or all closest patches of the same distance are marked.
To search for data in a specific color space (e.g., XYZ, Lab, CMYK) simply append the name to the data, e.g., ’50 0 0 Lab’ or ’10 20 30 40 CMYK’. For spectral data, 3 digits are interpreted as Lab data. If the number of digits matches, the appropriate color space is automatically assigned, so for the Lab color space, only the three digits need to be entered.
2D View
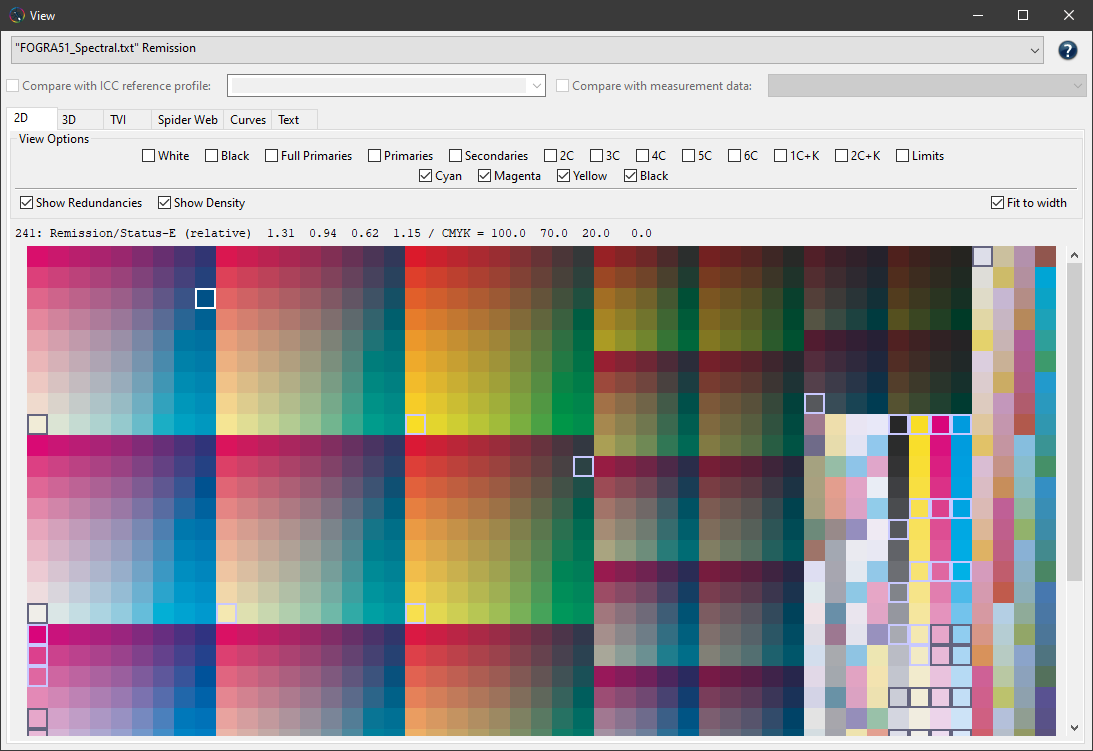
Show redundancies: Marks all redundant patches in the selected document providing information about the colors and their location. These patches will be adapted when applying the Redundancies tool.
Viewing Remission Data: Roll over a color patch to see the Lab measurement value and reference value of the patch. Spectral data will also be marked as Remission. When spectral data is present, switching to Show Density displays the density of a color patch.
The patch location is shown (if available) in the patch information, when moving the mouse pointer over a patch.
For example, the patch in the screenshot is located in F01, i.e., column F row 01.

Comparing patch data
Clicking on a color patch defines it as a reference and the DeltaE index will be reset to zero. Move to another color patch without clicking and the color difference between the two patches will be visualized.
Clicking on the same patch will deselect it as a reference. If the reference was selected in the same dataset, the name of the patch, the patch ID or the patch number is displayed in addition to the dE. If the reference was selected in a different dataset, no name is displayed.

Editing patch data
Double-clicking on a color patch in the 2D tab will open a separate dialog called Color values, where the Lab value is displayed. You may change that value and apply the changes by clicking OK.
Note: Even for the manual editing of Lab values we use the spectral data and the spectral characteristic of this data will remain.
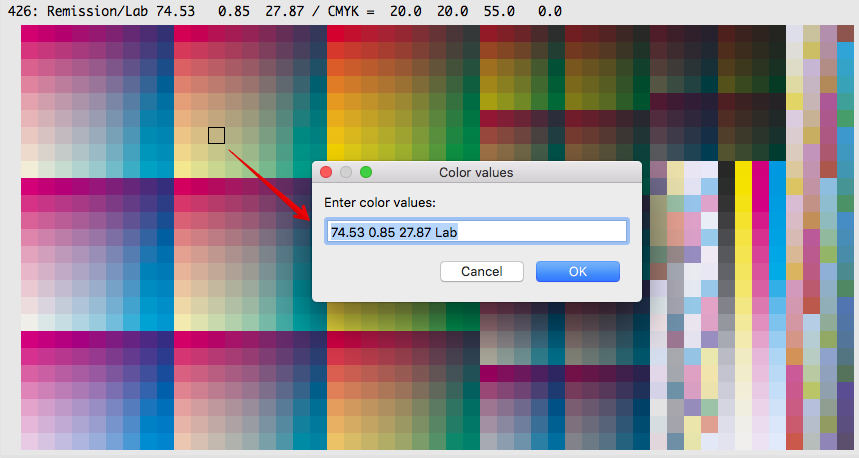
In the 2D view, individual color patches can be edited or deleted by selecting the patch and right-clicking to open a context menu.

Using the context menu of the selected spectral color, you can Edit, Add, Delete, Copy, Cut, Paste color patches and open the Spectrum dialog with the reflectance curve of this color.
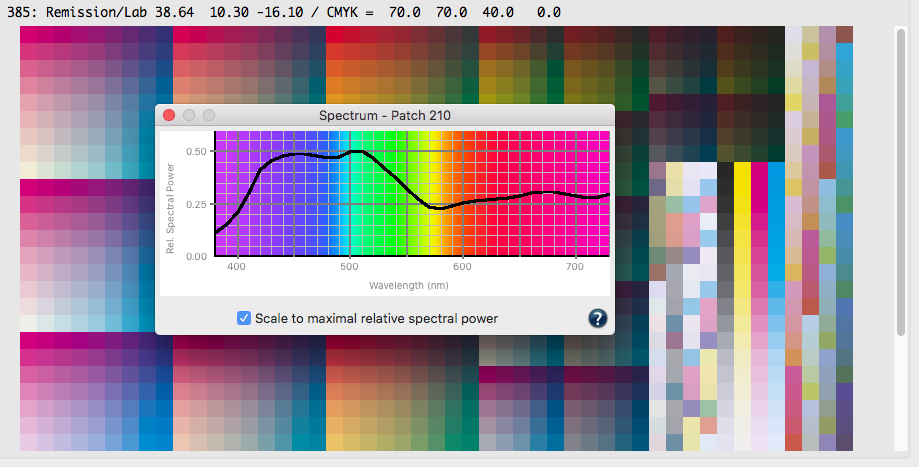
Note: Whenever the Spectrum dialog is opened and scroll over patches in 2D view, the spectral curves of the related color will be displayed.
Support and display of densities
Density values can be calculated and displayed in the 2D view if spectral measurement data are available. Activate the checkbox Show Density and navigate the mouse pointer over the color patches to display their CMYK density values.
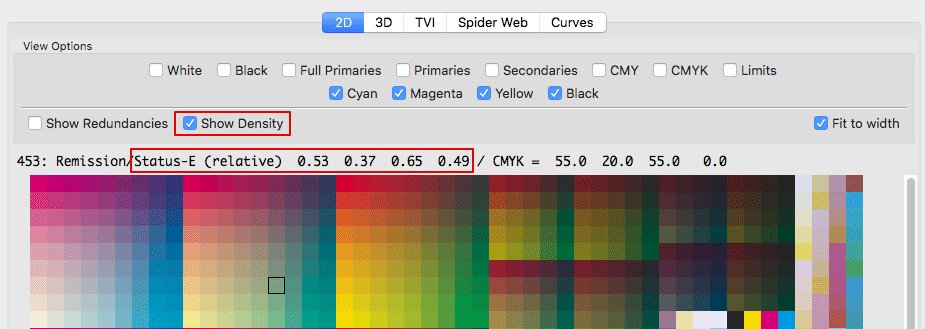
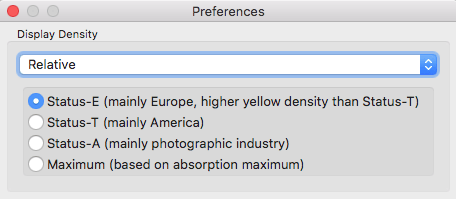
The density calculation method is set under Preferences. Select whether the Relative or the Absolute density is to be displayed and which of the four methods is to be used for the calculation:
- Status-E: The default setting for CMYK data, mainly used in Europe.
- Status-T: Mainly used in America for CMYK data, with slightly lower yellow density values.
- Status-A: Used in the photographic industry. Use it with RGB printing systems.
- Maximum: For Multicolor/spot color measurement data. Automatically uses the maximum absorption of the spectral values to calculate the density instead of the specified CMY filters.
Note: The density values of the solid tones are also displayed in the PDF Report.
You can save the pure density values of your measurements as a separate file by selecting Export Density from the File menu.
3D View
Turn the color patches into the desired direction in 3D view by clicking and dragging.
By dragging the gamut, the color space is rotated in that direction. A single click will stop the auto rotation or it will stop automatically without user intervention after one minute of rotation.
Note: The default 3D gamut view of ColorAnt 9 and higher is based on an axis ratio of 1:1:1. It is still possible to use the 2:1:1axes ratio (used in ColorAnt 8 and older) by selecting the 2:1:1 option in the Preferences under General Settings > 3D Gamut Axis Ratio (L:a:b).
Context menu
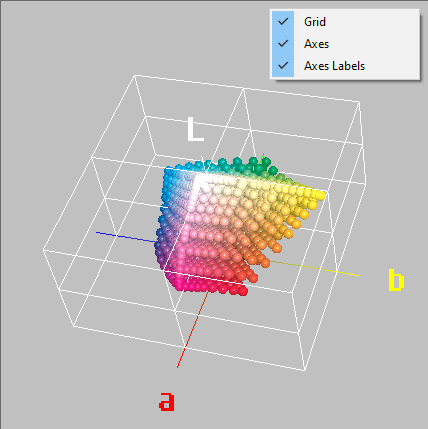
Right-clicking on the gamut view opens a context menu with several additional view options. Here, Grid, Axes and Axes Labels can be switched on and off.
The color information of a patch/color point (i.e., color name, device value, Lab value) is displayed when moving the mouse over that color point and the affected point is highlighted.
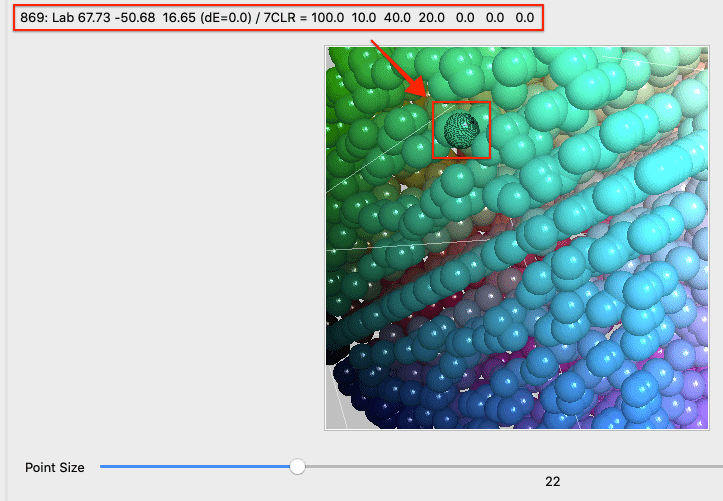
Increase or decrease the view by using the right side Zoom slider or use the shortcuts CMD + and CMD – (macOS) or STRG + and STRG + (Windows). This allows a closer look at the color patches of the measurement file. Enlarge or minimize the color patches by using the Point Size slider.
Compare with ICC profile: Enable the checkbox to select an ICC profile from the drop-down list. The gamut of the selected profile will be shown as transparent light gray allowing you to compare it with the measurement data.
TVI - Tone Value Increase
Analyze Tone Value Increase curves (TVI). Whenever the TVI tab is opened during editing of curves or any other correction which will affect the TVI, the result is displayed.
View Options: The checkboxes depend on the primaries of the loaded measurement data. The checkboxes for CMYK and Multicolor files show or fade out single curves.
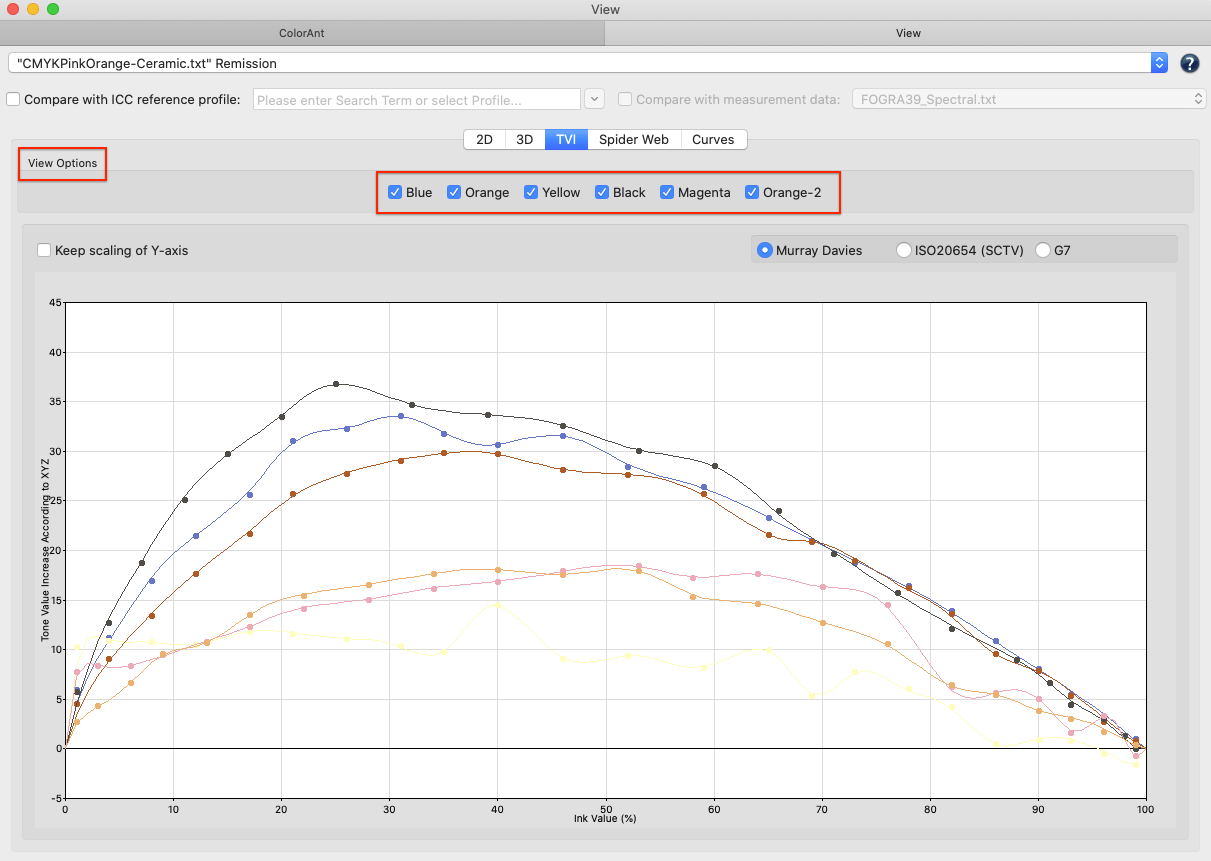
By activating the checkbox Keep scaling of Y-axis the TVI curves will be visualized in the diagram in the best possible way. The scale factor of the Y axis depends on the measurement data and ensures the most precise and largest view of the curves.
Deactivating the checkbox prevents the automatic adjustment of the Y axis with each new data. Sometimes this eases the comparison of different adjustments.
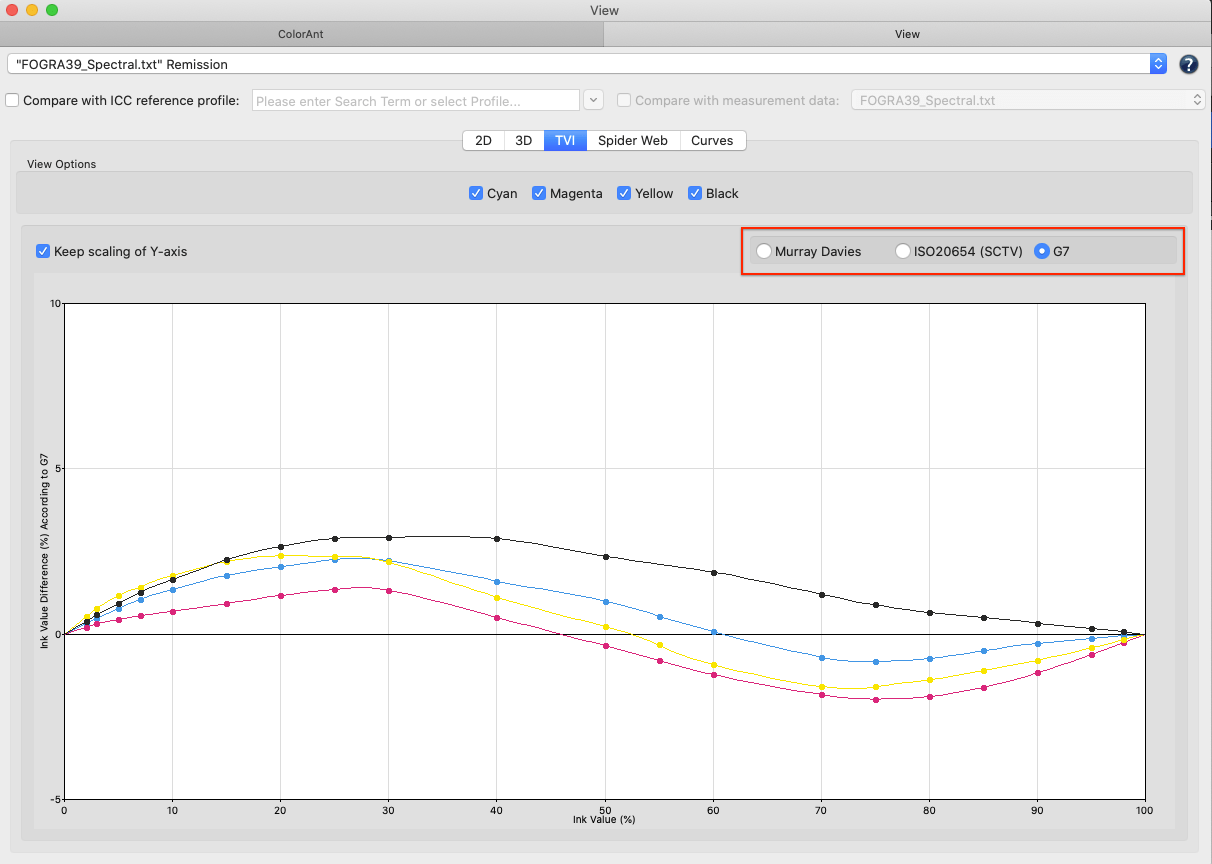
Use the radio buttons to switch between the typical density-based tone value increase curves according to Murray Davies, the modern colorimetric tone value increase curves according to ISO 20654 (SCTV), or the dot gain curves forming a neutral gray according to G7®. Linear tonal growth curves according to ISO 20654 show a straight horizontal line in this diagram.
Deviations from the G7® gray balance are given as percentages of the tone value differences. A perfect G7® gray balance is shown as a straight line in this diagram. This allows an operator to adjust the CMYK curves, for example in a RIP, accordingly.
Note: The G7® gray balance is defined to apply only to the CMYK channels. Additional channels such as in Multicolor data are therefore displayed as straight lines, which are irrelevant for the G7® gray balance. The actual curves of additional channels are shown in the other two viewing options for Murray David or ISO 20654 (SCTV) .
Measurement data which contains only CMY (no black) or RGB, can be optimized with ColorAnt, too.
TVI curves will always be shown with internal redundancy corrections in the View dialog. This avoids any strange visualization in case the similar color values strongly differ, especially for paper white.
ColorAnt uses a correction factor for the Cyan curve display of colorimetrically calculated TVIs that improves the match between colorimetric and density-based TVI displays.
Compare with ICC profile: Select an ICC profile from the drop-down list. The curves of the selected ICC Reference Profile will be shown in a lighter color in addition to those from the measurement data. The curves of the reference profile can be shown or hidden by activating or deactivating the respective checkboxes.
Tone Value Calculation: The visualization of TVIs can be modified with the options in Preferences. Curves may be calculated and visualized by using XYZ or spectral data.
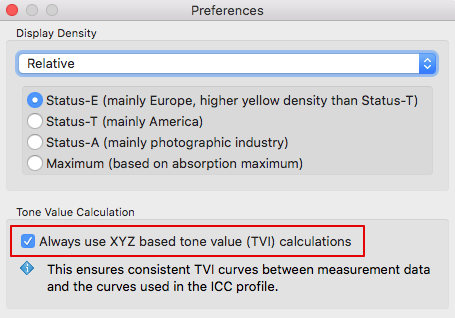
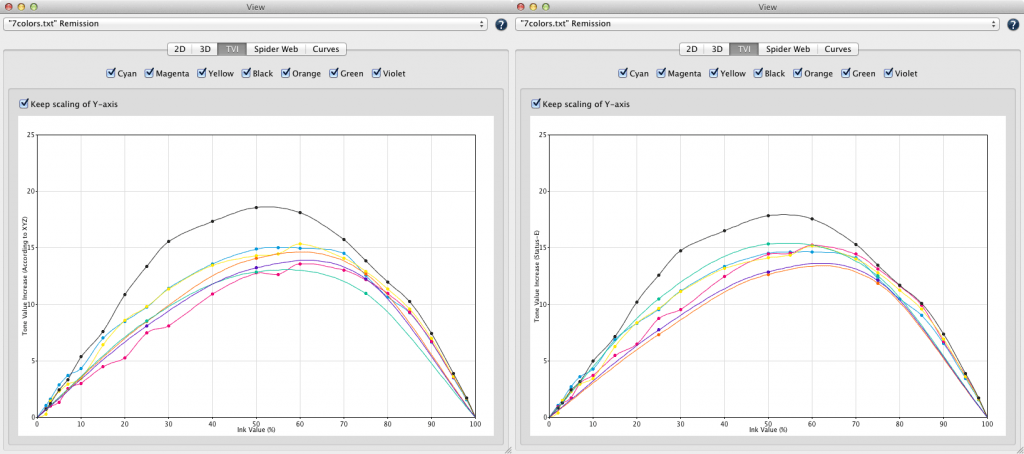
Note: The standard setting in ColorAnt is to calculate the curves based on the XYZ values. This allows a consistent view of curves either based on measurement data or by the ones based on the resulting ICC profile. By disabling the checkbox Always use XYZ based tone value (TVI) calculations in Preferences, curves will be calculated by the density method if spectral data is available. This method is more common to the one used in print process control. Keep in mind that both the XYZ and the density method are not good indicators for how the curves for spot colors will actually look. Both methods do not work well for non-CMYK colors. Refer to the Curves dialog instead.
The screenshot shows the different TVI curves for a 7 color printer, using CMYK+Orange+Green+Violet. On the left side the curves based on XYZ, where the sophisticated ColorAnt already used the correct filters for the different channels. On the right side you see the curves based on the density method with Status-E leading to different shapes of the curves.
Spider Web
This is a top view on the color space in an a*-b* diagram. The measured or optimized color patches are arranged in a spider web. Compatible to the other views, you may check changes in the View dialog by selecting one of the adjustments in the History.
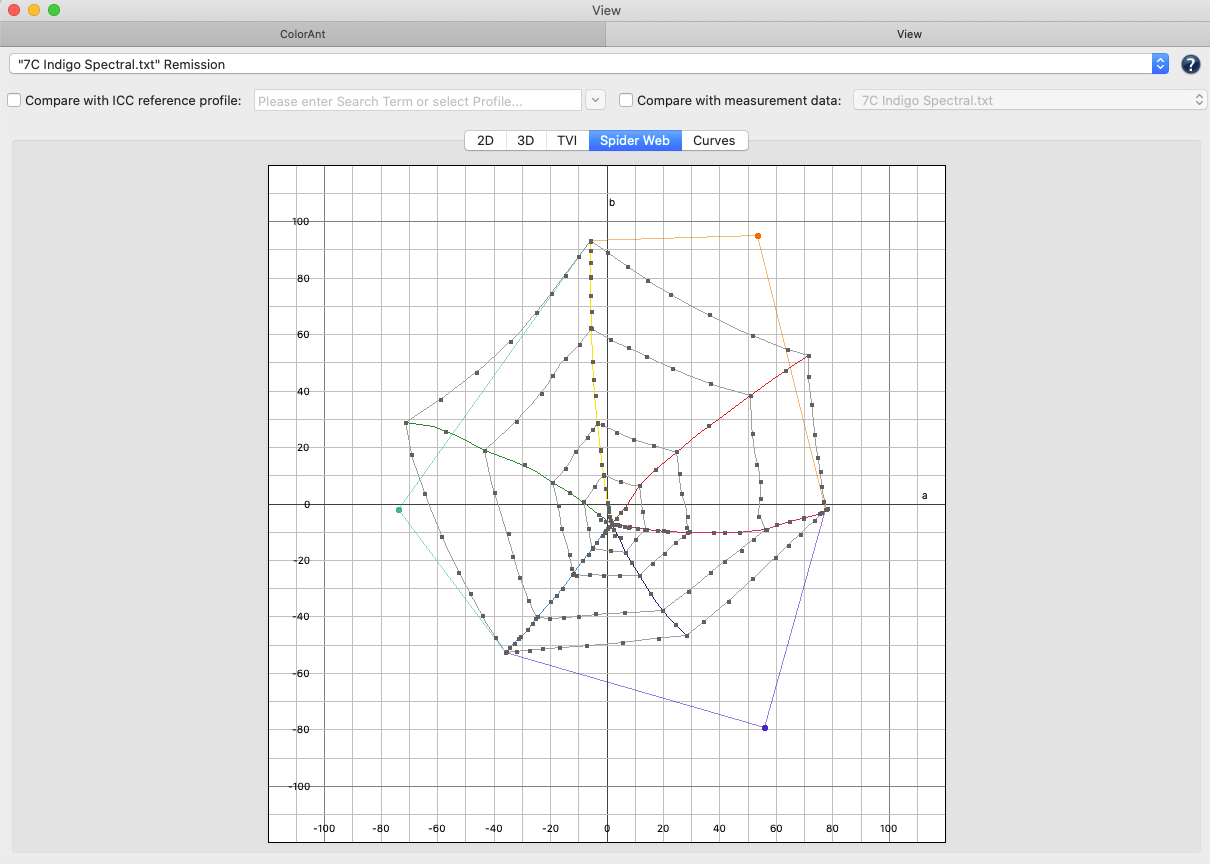
In the spider web all primary and secondary gradations are highlighted in corresponding colors (see also the screenshot of the CMYK data).
Spider Web: Displays the measurement points of the CMYK data and the full tones of the additional primaries. There are straight colorized lines from those primaries to the next two closest.
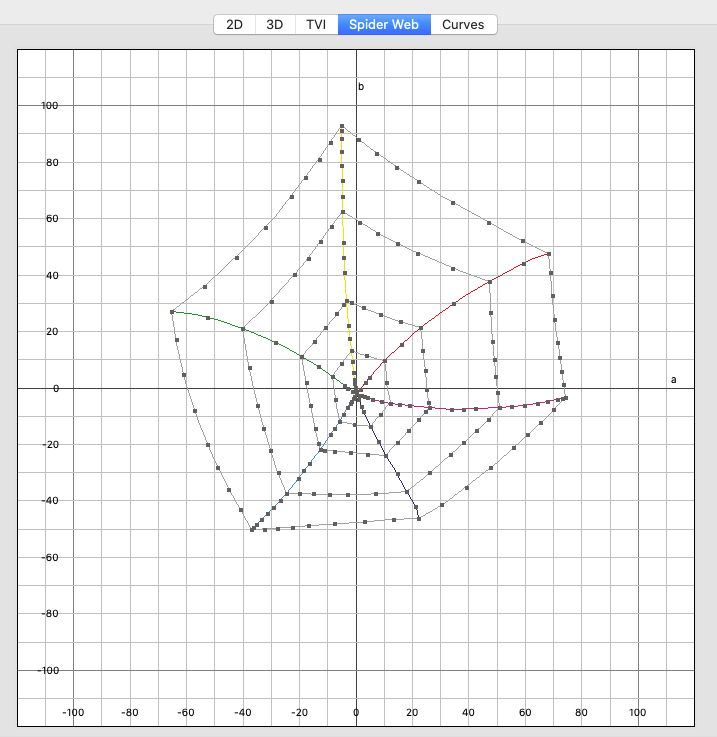
The spider web diagram of a Multicolor dataset is shown in the next screenshot. It shows the measuring points of the CMYK color set of the data and the solids of the other primary colors. From these solids, straight colored lines are drawn to the closest two other primary colors. These lines represent a rather rough view of the color space, but they clearly show in which color ranges the additional colors extend the color space.
Note: CoPrA supports three main chromatic primary colors when creating multicolor profiles which should span a suitably large gamut encompassing the gray balance. Typically this is CMY but it can be any other appropriate chromatic color combination.
Black can be added optionally as a 4th channel. If black is used it must be the fourth channel.
Up to two gamut extending colors can be used in between each section of the main primary colors.
Following this approach, printer profiles of up to 10 channels can theoretically be created by CoPrA 5 and higher. However, it is not recommendable to use printer profiles with more than 8 channels in production as every additional channel increases the profile size exponentially so that either a very low grid size or an exorbitantly large profile had to be used.
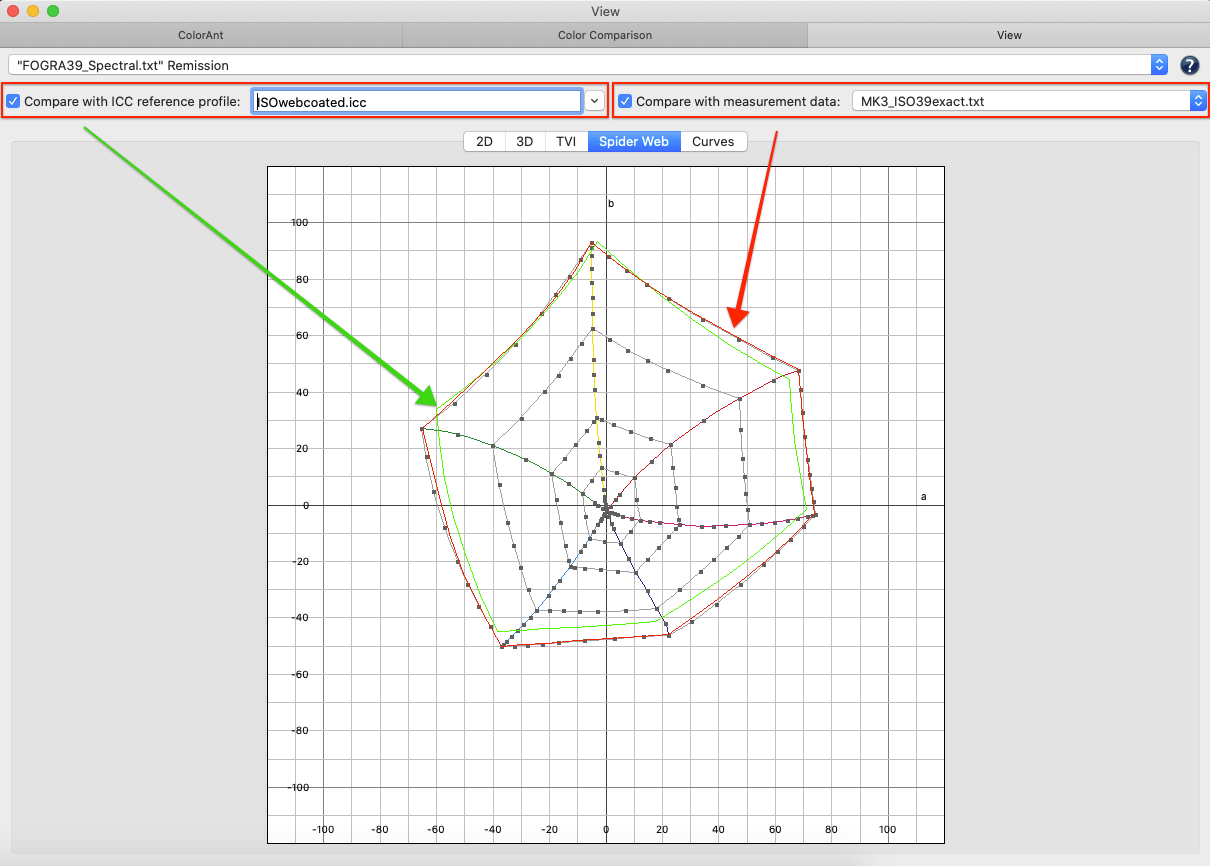
Compare with ICC profile: Select an ICC profile for comparison in the drop-down menu. The color space of the selected ICC profile will be visualized in green in addition to the measurement data. This feature is helpful to compare different color spaces and compare standards such as a house standard vs a print standard.
Compare with measurement data: Activate the checkbox and select the measurement data you would like to compare with the currently loaded data from the drop-down menu. The color space of the selected measurement data will be in red.
Curves
The Curves tab displays the linearity curves from white to 100% of all primary colors including Multicolor. For CMYK data, linearity curves are displayed from white to 100% of all primary and secondary colors. The smoothness of gradation curves can also be displayed using three different methodologies. Three different methods can be selected with the ColorLogic Default being the default option.
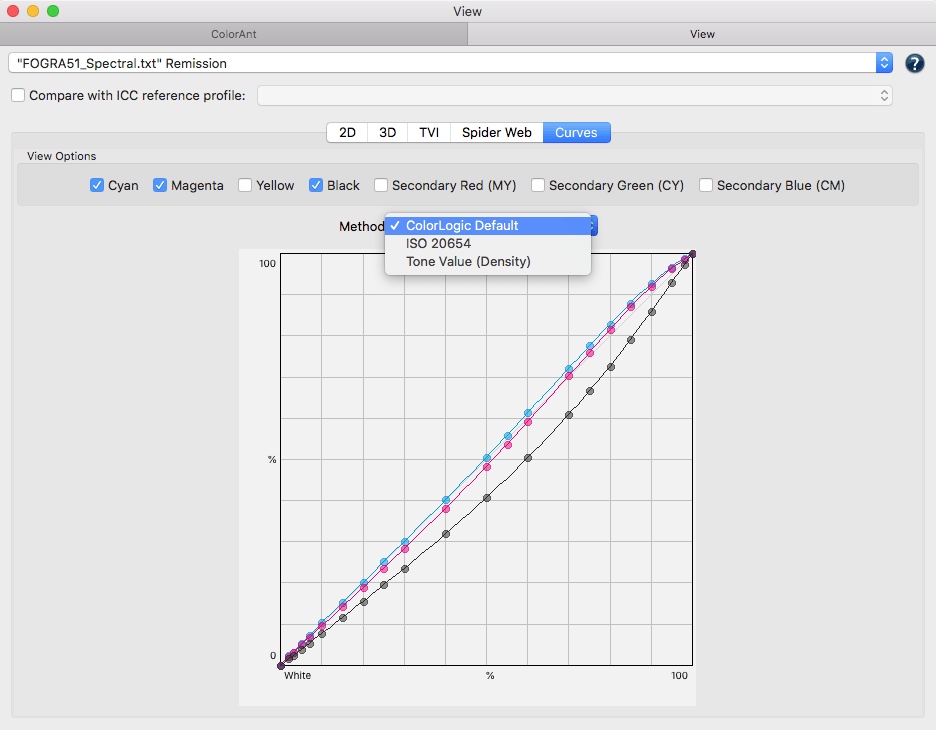
ColorLogic Default: Views the curves in colorimetric linearity based on Lab /dE-76 and means that a 50% value of a given primary has the same distance to the left value (white) and the right value (full tone) if it sits at the midpoint of the graphic. Nowadays modern RIPs linearize primaries based on colorimetry methods. A fully linear curve (45 degrees) points to a perfect colorimetric linearity.
ISO 20654: Can be used to display how the gradation curves of primaries would look if regarded under the aspect of colorimetric linearity. A fully linear curve (45 degrees) points to a perfect colorimetric linearity according to ISO 20654.
Note: Density-based methods like Murray Davies do not work well for non CMYK colors. The IS0 20654 also known as the SCTV method (Spot Color Tone Value) is an alternative method to display tone values of spot colors.
The curves shown with ColorLogic Default and ISO 20654 are similar methodologies. ColorLogic Default takes the hue of the primary into account, which is not the case with ISO 20654.
Tone Value (Density): Is the tone value curve based on density. It’s a different view of TVI diagrams. This view has been added for a better comparison of colorimetric methods.
Compare with ICC profile: Select a profile for comparison of the curves in the drop-down menu. The curves of the comparison profile will be shown in lighter colors.
Text
The Text tab provides a text editor allowing the measurement data of the selected file to be displayed and directly edited. Editing of the file content can be useful, e.g., to change the color names of test charts, etc.
Revert: Undoes all changes.
Commit: Any changes are applied to the file.
Warning! Even though changes can be undone at any time via the History, be aware that changes made directly to the file can cause damage if you don’t know what you’re doing – it’s very easy to create a corrupted file!
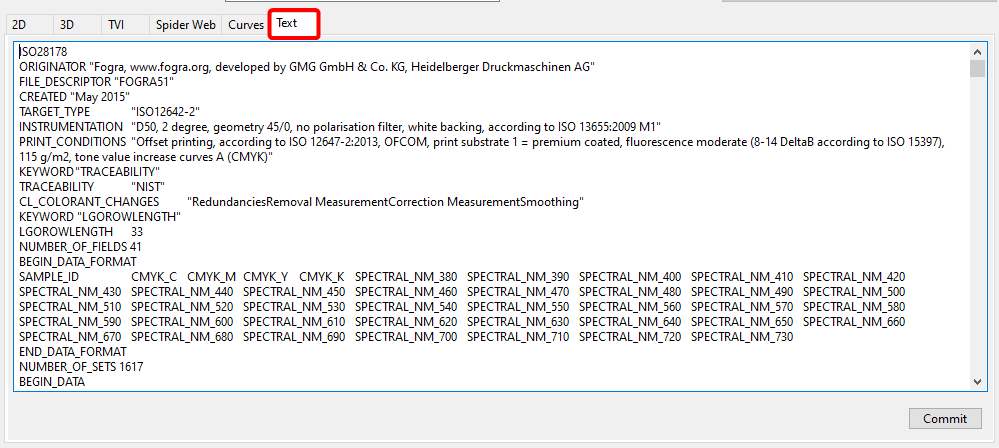
The text view allows viewing and editing the data in CGATS format. However, there are some limitations:
- The order of entries in the header may change or data may be formatted differently.
- Non-conformant CGATS formats may result in various errors.
- Some meta information for the chart and patches may not be visible in text view.
- Some meta information is preserved, i.e., the entries cannot be removed because they are restored from the internal data. However, they can be edited.
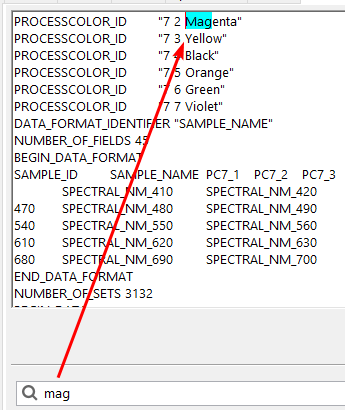
Search function: The search is not case sensitive. To find information, entering part of the search term will suffice, for example to find the term “Magenta” entering the initials “mag” is sufficient.
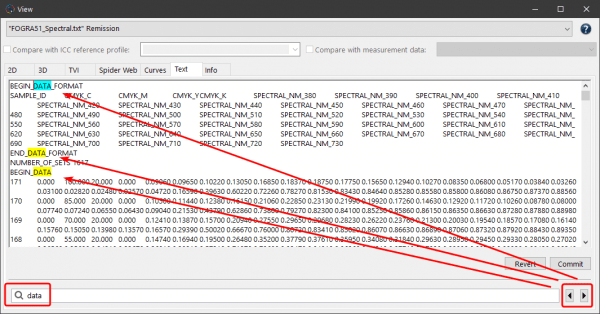
All search results are highlighted. Using the arrow keys next to the search mask, it is possible to move back and forth between all search results.
Info
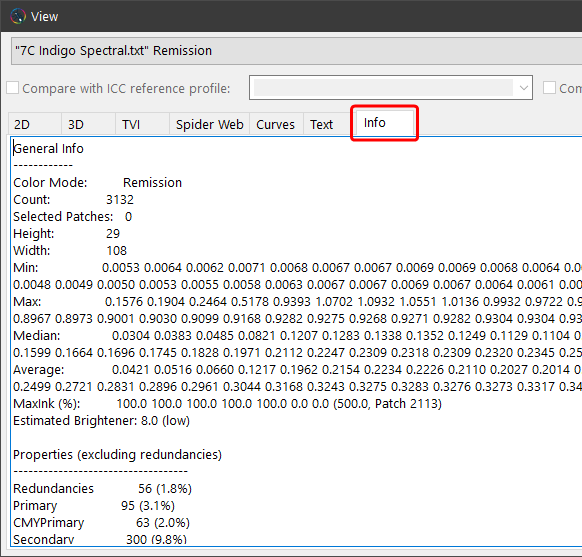
The Info tab shows a number of general useful information about the selected file, including the Color Mode, Estimated Brightener, etc.
