Rescale
Overview
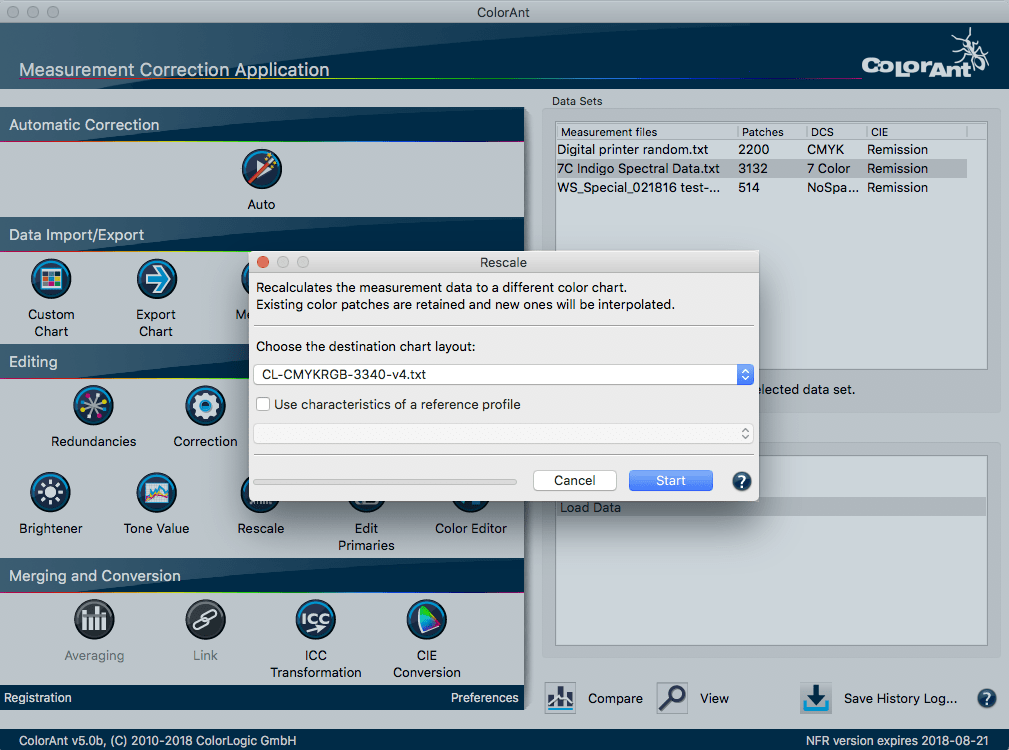
ColorAnt offers the option of calculating large test charts that can be used for profiling from small test chart measurement files. In some printing processes, (e.g. flexo printing on uneven materials) it can be challenging to achieve artifact-free printing of a large test chart. The procedure of placing several small test charts, e.g. ColorLogic Reprofiler strips on one page, measuring these, averaging them in ColorAnt and then scaling up to a large test chart with the Rescale tool is an effective approach to measuring large size charts.
Procedure:
- Select the measurement file that you want to scale up and click on the Rescale button.
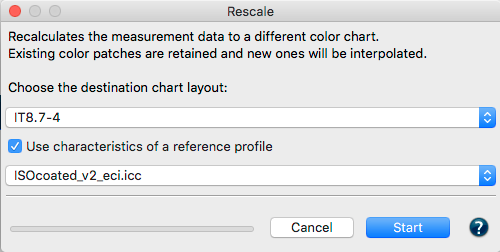
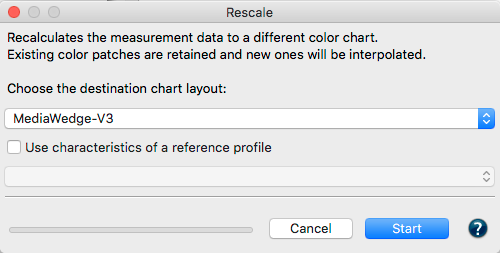
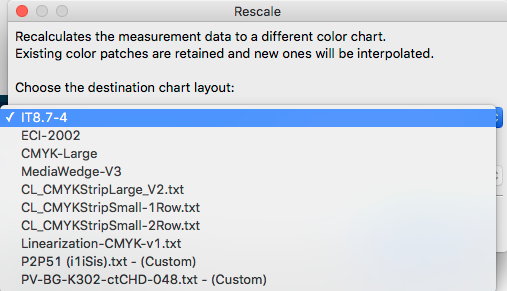
- Select the desired test chart layout from the drop down menu to which the measurement file should be scaled up.
- When you have an ICC printer profile (reference profile), which approximately describes the standard to be printed, select the printer profile by checking the option Use characteristics of a reference profile. If the profile is not available, do not activate the checkbox.
- Click on Start and ColorAnt will calculate and interpolate the missing color patches from your small chart and create the desired chart layout.
- Save the scaled up measurement value file as a new file with File/Save as.
Note: Missing color patches are automatically supplemented when scaling to other charts. Missing color patches (e.g. from overprinting colors that are missing in small charts) can be assessed better with the help of a reference profile.
In reverse, you can also use the Rescale tool to extract the color patches required for the Fogra/Ugra-Media Wedge V3 from a measured large ECI2002 or IT8.7-4 test chart. ColorAnt uses the color patches from the available measurement file 1:1 in the new chart layout. This enables you to produce your own media wedge reference files for verifying printed proofs very easily.
Note: The chooser shows only those test charts that fit the color space of the selected file. E.g. in case a CMYK measurement file has been selected only the CMYK test charts are shown including those delivered with the software and those manually added (marked as Custom). If you wish to add and use your own custom reference files in the Rescale tool or when opening via File/Open Predefined save them in the Documents/ColorAnt/Wedges folder.
Using the Automatic
A specific sequence in the working method is recommended when preparing measurement data. First clean up redundant color patches in the measurement file, then correct faulty measurement values and finally smooth the measurement data. This sequence is automatically executed by using the Automatic function.
Procedure:
- Load measurement file by dragging it onto the Data Sets area or using File/Open.
- Click on the Automatic button and on the Start button in the dialog which then appears.
- You can follow each step in History and view it individually there (if you have the View dialog open) or undo it.

- Save the optimized measurement file as a new file via File/Save as. Use the optimized measurement file e.g. in profiling software like CoPrA to create high-quality ICC printer profiles.
Note: Measurement data is saved in some ICC printer profiles (e.g. CoPrA always saves the measurement data in the calculated ICC profile). Extract the data from the corresponding ICC printer profile simply by dragging the ICC profile onto the Data Set area in ColorAnt.
The Automatic function calculates from the loaded data if either an averaging of multiple files is needed (in case multiple files with the same amount of patches have been loaded) or if redundancies, correction and smoothing shall be applied. This is how the Automatic feature works: It checks for Redundancies in the measurement data first, corrects bad measurements and applies Smoothing to a lesser extend (50% slider setting with no protection of highlights). This leads to optimized measurement data leaving the characteristics of the print closest to the original and thus to better profiles in the end. The screenshot below shows the settings the Automatic feature uses.

Note: For Flexographic measurement data we suggest to manually optimize and smooth the data as the Automatic feature would smooth out any bump curves, too.


