

Automatic Correction
Measurement data can be optimized by applying appropriate corrections, thus increasing the quality of the resulting profiles. The characteristics of the print are retained as accurately as possible.
When optimizing measurement data, a certain sequence of corrections is recommended. First, redundant color patches must be resolved, then incorrect measured values must be corrected and finally the measurement data must be smoothed.
The Auto Correction tool automatically performs these optimizations in the recommended order, applying the Redundancies, Correction and Smoothing tools sequentially.
Note: Measurement data from flexographic printing should be optimized manually, as the Auto Correction tool smoothes the highlights.
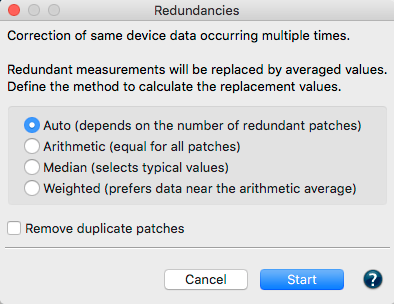
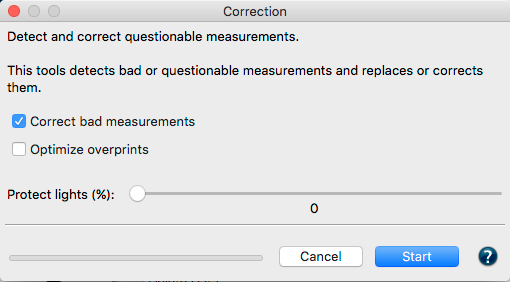
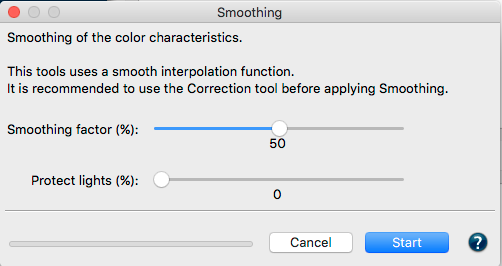
The screenshots show the settings that are used by the Auto Correction tool:
1. Redundancies: Resolves redundant color patches
2. Correction: Corrects faulty measurement values without optimizing the overprint properties
3. Smoothing: Smoothes the measurement data with a Smoothing factor of 50 % without protecting the highlights
All applied tools are listed in the History section. It is advisable to create a report with detailed results and relevant recommendations on the measurement data.
Procedure
- Open the measurement data to be optimized
- Click on Auto Correction and then Start. The corrections applied to the data are displayed under History.
- Save the optimized measurement data as a new file via File > Save as.
Automatic correction of multiple datasets
The Auto Correction recognizes the corrections to be made based on the measurement data. If multiple datasets have been selected, it checks whether the number of color patches matches and averages the data while optimizing the measurement data for individual files or multiple files with different numbers of color patches.