

ColorAnt 12 Release | September 2026
New Features and Improvements in ColorAnt 12
Correction/Smoothing
- Restructured and enhanced Smoothing/Correction tool
Evaluate
- Creation of custom Evaluation Methods with user-defined specifications
- ColorAnt Evaluation: The Proof Evaluation tool is now available as a standalone application
- Illumination and Observer settings of reference files and/or measurement data are now used properly
General
- New ColorAnt packages
- Modernized and streamlined licensing system
Correction and Smoothing
Restructured and enhanced Smoothing/Correction tool
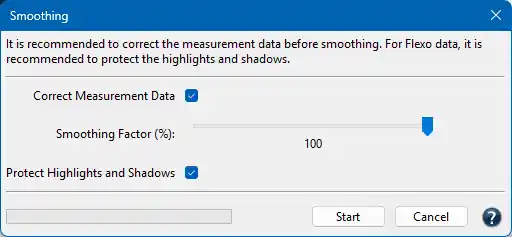
The Correction and Smoothing tools have been merged into a single, streamlined tool for a cleaner workflow. As part of this update, the Correction tool has been removed from the sidebar, and all editing tools are now arranged in two rows of four for a cleaner layout. The Correct Measurement Data checkbox has been moved into the Smoothing tool, which also includes the new option Protect Highlights and Shadows.
Evaluate
Creation of custom Evaluation Methods with user-defined specifications
Existing Evaluation Methods can now be tailored to your specific requirements by unlocking predefined methods and adjusting their parameters. This enables more accurate and meaningful evaluation results.
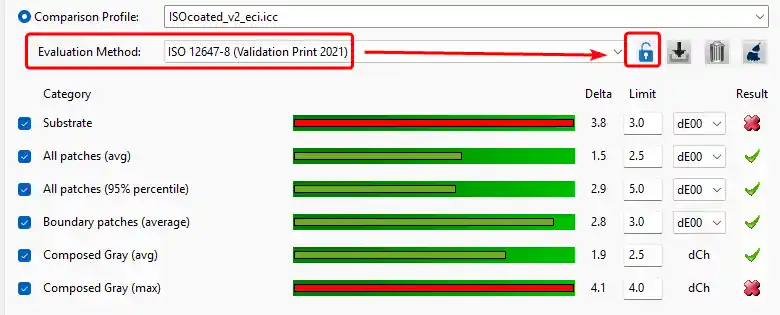
Predefined evaluation methods are initially locked. After unlocking, the following parameters can be changed:
- Name of the custom evaluation method
- Categories can be included or excluded via checkboxes
- DeltaE (dE) limit values
- DeltaE (dE) methods
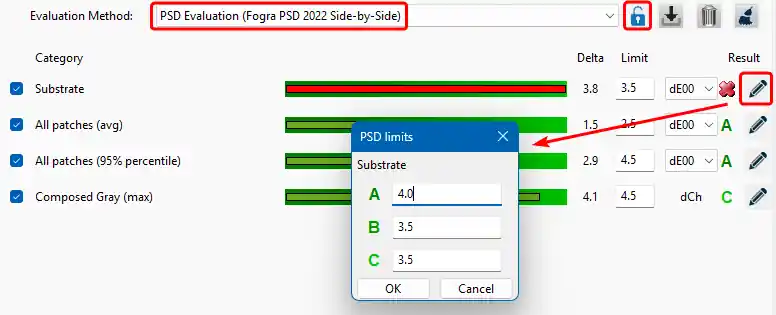
- PSD limit values in PSD methods (via the Pencil icon)
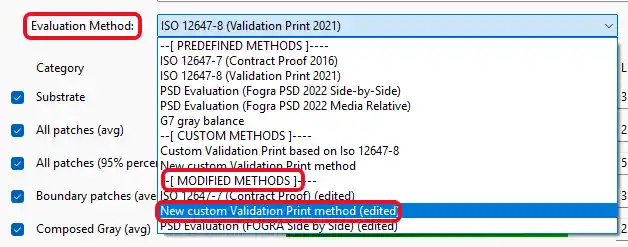
Once changes have been made to the predefined method, the modified version is saved as a modified method and added to the Evaluation Method list under the MODIFIED METHODS section, with the suffix (edited) appended to its original name.
Modified evaluation methods can be saved with a new Name by clicking the Save icon and will then be listed under the CUSTOM METHODS section.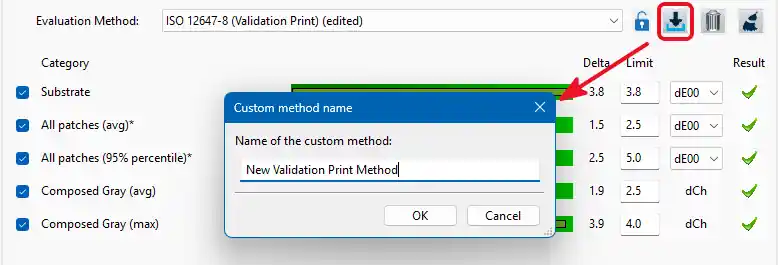
Selecting Categories for Evaluation
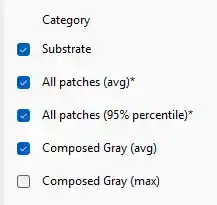
Categories can be included in or excluded from the evaluation process by selecting or deselecting their respective checkboxes. Thereby, it can be determined which categories will be evaluated. Categories that are deselected will be excluded from the evaluation process and will not appear in the Report or on the Label.
PSD methods differ from other evaluation methods in that they do not utilize a green checkmark to indicate a pass or fail status. Instead, PSD methods categorize results into categories A, B, or C. Given that the limits for nearly every Category vary significantly, these limits can be set as needed. To edit the specific limits for a PSD evaluation method, click the Pencil icon of the desired category.
ColorAnt Evaluation: The Proof Evaluation tool is now available as a standalone application
ColorAnt’s Evaluation tool is now also available as a standalone application, providing a basic set of ColorAnt tools including Measure, Compare, View, Chart Generation, Export Chart and Proof Evaluation. ColorAnt Evaluation supports all data types, including Multicolor data and spot colors. Furthermore, it adds the option to create Custom Evaluation Methods with user-defined evaluation Limits, so that the evaluation process can be tailored to meet specific requirements.
Differing Illumination and Observer settings of reference files and/or measurement data can now be converted to printing conditions
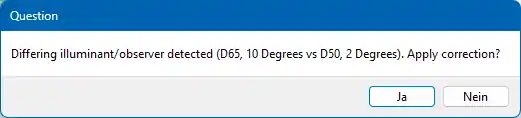
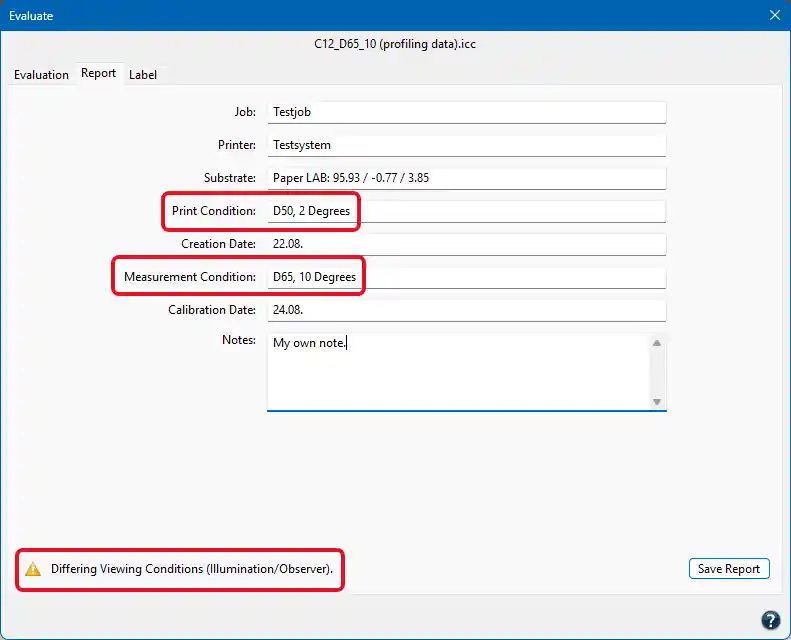
When profiles are loaded whose measurement conditions (e.g., Illuminant/Observer D65/10°) differ from the printing conditions (e.g., D50/2°), and the Evaluate tool is opened, a message is now displayed indicating this discrepancy.
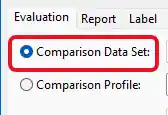
Comparison Data Set selected as option in the Evaluate tool
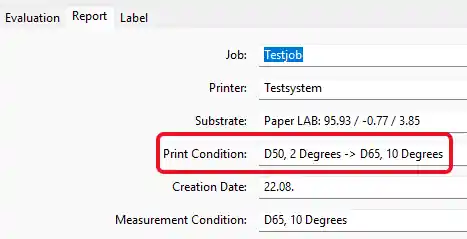
The Illuminant and Observer of the loaded profile can be converted to the printing conditions if the Comparison Data Set option is selected in the Evaluate dialog.
However, if the Comparison Profile option is selected in the Evaluate tool, the profile’s Illuminant and Observer cannot be converted. Instead, a message will appear indicating that there is a discrepancy between the profile’s measurement conditions and the printing conditions.
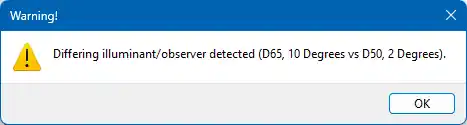
Comparison Profile selected as option in the Evaluate tool
In the Report, this is documented under Printing Condition and Measurement Condition. If the profile's Illumination and Observer are not converted, a warning will also be shown at the bottom of the window:
When the Illumination and Observer of the profile are converted, this is documented in the Report under Printing Condition:
General
New ColorAnt packages
The latest update introduces three new ColorAnt packages, which will replace the existing ColorAnt M and L packages: ColorAnt Process, ColorAnt Multicolor and ColorAnt Evaluation.
Modernized and streamlined licensing management
From now on, ColorLogic products will be using the secure and well-proven Hybrid Software Group licensing system, which is also used in Hybrid Software GmbH products such as PACKZ and iC3D and is utilized by thousands of users worldwide. In addition to modern and secure encryption technology, this change offers other advantages as well:
- Only a single license key is required. The license key is linked to a user ID, not to a computer or hardware, and can be used on any system (Windows and macOS).
- Easier computer switching. When switching to a computer you no longer need to request new licenses, as the previous hardware- or dongle-based serial numbers are no longer used. Simply deactivate the license on the current computer, transfer it to another computer, and reactivate it there.
- This new licensing system is Internet-based. An Internet connection is required to activate or deactivate a license, but after activation the software can be used offline. This significantly reduces administrative efforts and increases flexibility when switching computers.
- Simplified update process. Previously, a new license was required for each new major release, but now you automatically receive all updates as long as your Software Maintenance Contract remains active.
- Includes the new Activation Manager application which allows you to manage all your license keys.
To use the new licensing technology, you must initially log in to the Hybrid Software Group Data Center. There, you will find all the software products you have licensed (under My Licenses), as well as the latest versions available for download (under My Products).
Bug Fixes
- Custom Chart: Fixed a problem, where entering a higher TAC resulted in fewer overprint patches (Ticket 254525)
- Custom Chart: Fixed a bug where it was not possible to choose the color for 1CLr charts
- Measure: Fixed a display bug, where the values during measurements with the Barbieri SpectroSwing qb differed from the final transmitted values
- Measure: The way ambient light measurements are handled has been changed to avoid conflicts with other applications
- Report: The Report tool now supports files in the Spot format
- Brightener: The Brightener tool now supports files in the Spot format
- Tone Value: Fixed a bug where some incorrect Boolean values were written to the cfcurve format file when saving (Ticket 254697)
- Tone Value: Fixed an issue where corrections in accordance with ISO 20654 varied depending on the mode
- Edit Primaries: Fixed a bug, where the primary adjustments were not done when only the white was changed
- Edit Primaries: An index error has been fixed that could occur in rare cases when editing Lab data before editing remission data
- Color Editor: Fixed an issue where locking the Output values was not always successful (Ticket 233534)
- CIE Conversion: Fixed a bug where the Target Values were updated instead of the Source Values
- View: Fixed an unexpected error when trying to delete a patch in a spot color library
- View: Fixed a bug where more channels were displayed than were available in the loaded profile
- View: Fixed a bug where a strange colored line appeared in the Spider Web diagram with special data of only 3 patches
- View: Fixed a bug in the 3D View, where the Point Size was always reset to 8 when a value lower than 8 was entered and a channel was enabled/disabled
- Evaluation: The G7 chart patches were interpolated. This is now fixed and the correct steps are being used
- Evaluation: Updated the Composed Grey limits in the PSD Side-By-Side method (Ticket 254576)
- Evaluation: If the required G7 chart patches are missing, a corresponding message is now displayed
- General: Non-standard backgrounds for spot color ink characterizations were displayed incorrectly and are now ignored (Ticket 234323)
- General: Fixed an unexpected error that occurred when attempting to load a CSV from the Excel Import feature
- General: Fixed a bug where density values were not transferred after unlinking DCS and PCS (Ticket 254650)
- General: Fixed a crash that could occur on macOS when the program was closed via the Dock icon
- General: Restructured product portfolio: ColorAnt Process and Multicolor packages plus Evaluation add-on
- General: The initial loading of files has been optimized, resulting in significantly faster loading on systems with many profiles
ColorAnt 11.1.1 Release | March 2026
New Features and Bug Fixes in ColorAnt 11.1.1
- Fixed a problem, where the Barbieri SpectroSwing 2mm was no longer found after a firmware update (Ticket 264832/264837/264838)
- Support for the new Barbieri SpectroSwing 6mm edition
- Support for the Barbieri SpectroPad (Digital Press Edition)
- Automatic Network Device Search has been added for macOS
- Updated X-Rite eXact2 SDK to the latest version
ColorAnt 11.1 Release | May 2025
Bug Fixes in ColorAnt 11.1
- Export Chart: The default preset for the Barbieri Spectro Swing qb and the LFP qb has been changed to exactly match the manufacturer's specifications
- Measure: Fixed a reading issue that occurred when Barbieri Spectro Swing qb charts were generated using the Barbieri Gateway software
- Measure: Support for the Barbieri Spectro LFP qb Digital Press Edition (Ticket: 254477 / 254490)
- Correction: Fixed an issue where individual patches were altered significantly in some cases
- Tone Value: Fixed a Wrong Data Type error that occurred with measured spot color libraries
- Tone Value: Fixed a bug where the tool would modify more than the selected curve
- Tone Value: Fixed incorrect naming of spot color libraries after using the TVI tool
- Tone Value: Fixed an issue where the wrong color was indicated as being changed in the History, even though a different color had been modified
- Tone Value: Fixed an issue where channels in the TVI view got mixed up after combining certain CxF/X-4 data using the Link tool
- Tone Value: Several Index Errors that could occur in special cases have been fixed
- Tone Value: The tool falsely reported "Could not find data for channel" in some cases
- Link: Joining multiple single color spot color libraries with gradients to one large library is now done by channel name
- Compare: Fixed an Index Error when comparing 1 CLR data with the Delta DCS compare mode
- View/Tone Value: Fixed an issue where spot color libraries with gradients were not displayed properly
- View: Fixed a Dimension Mismatch error when trying to add a patch to a spot color library
- View: Fixed an issue with a buggy spiderweb view for certain CxF/X-4 files
- View: Fixed a bug in Curve view with certain CxF/X-4 files
- View: Fixed a view error and missing black channel in certain PDF files
- View: Fixed an issue with a faulty view and a missing black channel when linking certain CxF/X-4 files
- General: Questionable DCS data with possibly misinterpreted spectral data can now be loaded (Ticket: 233771)
- General: Cgats data that could be read by older ColorAnt versions but not by the current version can now be read again (Ticket 254418)
ColorAnt 11 Release | December 2024
New Features in ColorAnt 11
- Improved user interface for efficient test chart creation
- New Complementary Mini Chart option for spot color libraries
- New option to enter the target density for primary colors
- Improved Adopt Secondaries functionality
- Support for the Hybrid RIP curve format
- TVI curves can now be adjusted to match the ISO 12647-2 offset printing standard
- More flexibility when working with spot colors and spot color libraries
- Support for the measurement device Barbieri Spectro Swing qb
- Redesigned Preferences dialog
- New option to select custom Report, Chart and Profile directories
General
- More comprehensive support for CIE files
- Improved exchange of spot color libraries between ColorAnt and ZePrA
- Easy creation of custom data files using Excel spreadsheets
- The position and size of the windows are now remembered
Custom Chart
Improved user interface for more efficient test chart creation
The Custom Chart window has been redesigned to provide a clearer and more streamlined workflow. The workflow now starts by selecting the intended use of the chart from a drop-down menu formerly named “Mode”. The list of options in this menu has been trimmed down and some of the options that were present in ColorAnt 10 and older have been removed and merged into a single option. This provides a better overview and a more efficient test chart creation workflow.
The Custom Chart tool creates different types of test charts for a variety of requirements. Instead of seven modes, the condensed list now offers the same functionality in just five modes:

Create Profile: The new Create Profile option is a combination of the previously available Profiling and Flexo Profiling modes. It provides the functions of these two modes in a single place by including the new checkbox Flexo Profiling, which adds the additional Flexo-specific patches to test charts when activated.

Update Profile: This mode has not been changed. As before, it generates test charts with a minimum number of patches that can be used in combination with the Update Profile or Iteration tools in CoPrA.

Linearization: The new Linearization mode is a combination of the previous modes Linearization, Linearization and InkSplitting and Linearization and G7 Patches. It offers all the functions of these three modes in a single place by including two new checkboxes InkSplitting and Add G7 Patches, which add the relevant patches when activated.

Spot Color Library: This option is now a combination of the Color Space “Spot color library” and the previous mode CxF/X-4 Wedge. It contains all the functions of the former Spot Color Library dialog, but also the new Add overprint on black option. After activating this checkbox, the drop-down menu Number of patches on black becomes available, which allows the selection of the required number of overprint patches.
Note: The Spot format will be automatically exported as CxF/X-4 if spectral data is available and CXF is selected for saving.

Reference File: Loaded reference files (which were listed at the end of the Color Space drop-down menu in previous versions), are now listed in a dedicated Reference file drop-down menu below Color Space.
New Complementary Mini Chart option
The new Mini Chart option is intended to complement profiling with spot colors via Edit Primaries, as there are more secondaries included in the chart.

Complementary Mini Charts include gradients for the primaries and 2-color overprints for the 50% and 100% combinations:

Edit Primaries
New option to adjust the Density of primary colors
Density changes can now be applied directly to the primary colors in the Edit Primaries tool. This allows density changes to be evaluated without having to print a new profiling chart, for example in Flexo printing when a new anilox roll is to be used for a primary color, or in Offset printing if the density of an ink is to be increased or decreased. If the density of primary colors changes, corresponding Lab values are calculated and applied by the Edit Primaries tool. This is based on the spectral information of the primaries. Hence the density option is only available for a loaded test chart with spectral measurement data.
To do so, click on the Pencil icon to open the Edit Primary dialog.

The value under Density indicates the current density taken from the measurement data. Enter the new density value and click on the triangular Arrow to apply the changes.

The Lab values are automatically calculated and displayed immediately. Clicking on OK accepts these values and closes the window.
The calculation can be aborted by clicking Cancel or reverted by clicking the Undo arrow to restore the original values.
More precise Adopt Secondaries functionality
The Adopt Secondaries function in the Edit Primaries tool has been revised and enhanced. As before, the checkbox is only available if secondary colors are present for at least two of the selected colors of a measurement file. At least one 100/100 color patch for the selected color must be present for the checkbox to be activated. In addition, other two-color combinations are now considered as well (this can be any combination, such as 50/50 or 30/70 or 80/60 or any other combination of secondary colors).
The Lab values (or spectral values, if available) are then retrieved from the measurement file and entered into the spectral model. By supporting any existing printed secondary combination besides 100/100, the calculations are more precise.
Note: If a file contains the 50/50 patch but not the 100/100 patch, the file does have a secondary patch indeed, but the model still requires the 100/100 key point to function correctly.
Tone Value
Support for the Hybrid RIP curve format
Compensation curves can now be saved in the “*.cfcurve” format. This JSON-based format is compatible with Hybrid CLOUDFLOW, allowing the compensation curves to be imported into this application.

TVI curves can now be adjusted to match the ISO 12647-2 offset printing standard
The tone value curves can be calculated to comply with the requirements of the BVDM ISO 12647-2 offset printing standards from 2004 or 2013.
The two new options have been added to the Correction according to TVI targets drop-down menu of the Tone Value tool.

Main Window
More flexibility when working with spot colors and spot color libraries
The context menu now offers three new options under Merging and Conversion regarding the handling of spot colors and spot color libraries.

Spot Color Library to DCS: Converts files containing spot colors and up to 15 channels into the corresponding Device Color Space.
Create Charts from Spot Colors: Splits the entire library into individual charts for each color.
Merge Charts to a Spot Color Library: Combines several compatible charts into one spot color library.
Redesigned Preferences dialog
The redesigned Preferences dialog now offers the new option Custom Directories to select custom Report, Chart and Profile directories. The custom Profile Directory defined here is an additional directory alongside the system profile directory.

Measure Tool
Support for measurement device Barbieri Spectro Swing qb
The Barbieri Spectro Swing qb is now supported by the Measure Tool.

The device can be connected via USB or Ethernet. It is recommended to use the Ethernet connection as it provides higher transmission speeds.
General
More comprehensive support for CIE files
There are now fewer restrictions when importing measurement data from different providers. For example, some CIE files that could not be handled by previous versions can now be imported and opened.
Improved exchange of spot color libraries between ColorAnt and ZePrA
Opacity information can now be saved in both CxF and CGATS file formats. This allows spot color libraries from ZePrA, which may contain custom opacity values for the colors, to be edited in ColorAnt, e.g., smoothing or tone value corrections, and then transferred back to ZePrA without losing the opacity information.
In addition, spot color libraries can now be created easily and quickly using ColorAnt’s new Spot Color Library feature in the Custom Chart tool, exported as a CxF/X-4 file and loaded into ZePrA.
Easy creation of custom data files using Excel spreadsheets
Custom data files can now easily be created using an Excel spreadsheet template which can be downloaded here.

The template file offers several different pages for a wide variety of data and allows for custom spot color libraries to be easily imported into ColorAnt for chart creation in a simple editable format.
Select the sheet that matches the data, modify the sample data and export this page as a CSV file. The resulting file can then be imported into ColorAnt.
The position and size of the windows are now remembered
The position and size of the windows are now saved and restored after a restart, which is a practical feature especially for multi-monitor setups.