Compare
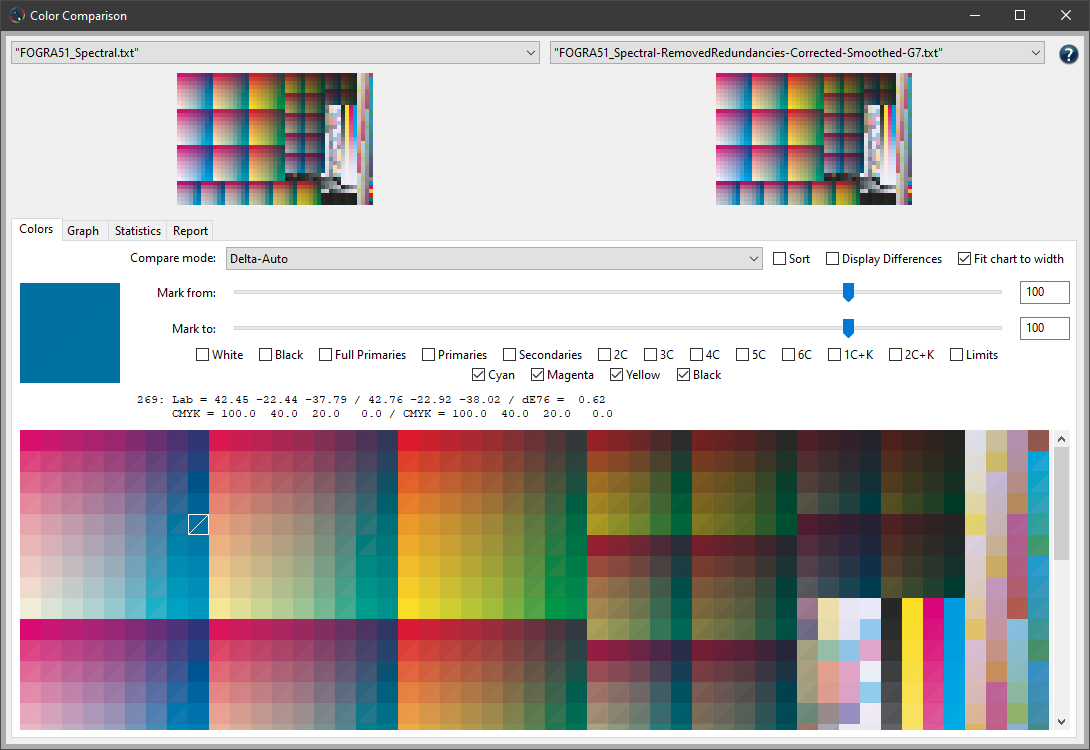
The Comparison window shows measurement data before and after optimization and allows the user to compare the steps that achieved the optimized data (for example Correction, Smoothing or Auto).
Colors
Compare Mode: Select a color distance formula. Available are Delta-Auto, Delta-DCS, DeltaE-76, DeltaE-2000, Delta-Ch, Delta-L, Delta-C and Delta-H, with the last three being particularly helpful when evaluating proofs.
Note: Delta-Auto is a special method that allows for a delta calculation of DCS data. If measurement values are existing in the files to be compared then Delta-Auto uses DeltaE-76.

Sort: Allows you to sort color patches by their delta values. Select the preferred Compare mode from the drop-down menu and activate the Sort checkbox to reorder the color patches from larger to smaller delta values. This makes it easy to find the patches with the highest and the lowest deltaEs or those patches with the highest chroma or lightness differences.
Zoom: The Zoom function allows a closer look at the color patches of the measurement file. Use the shortcuts CMD + and CMD – (macOS) or STRG + and STRG – (Windows) to zoom in and out.
Mark from: Displays the Delta values from the specified value.
Mark to: Displays the Delta values up to the specified value.
Note: The sliders can be used to limit the displayed number of color patches to the relevant delta ranges.
Filters allow a combination of individual channels which are to be compared. Combinations of 2, 3, 4, 5 or 6 channels, as well as one and two channels in combination with black, can be faded in and out.
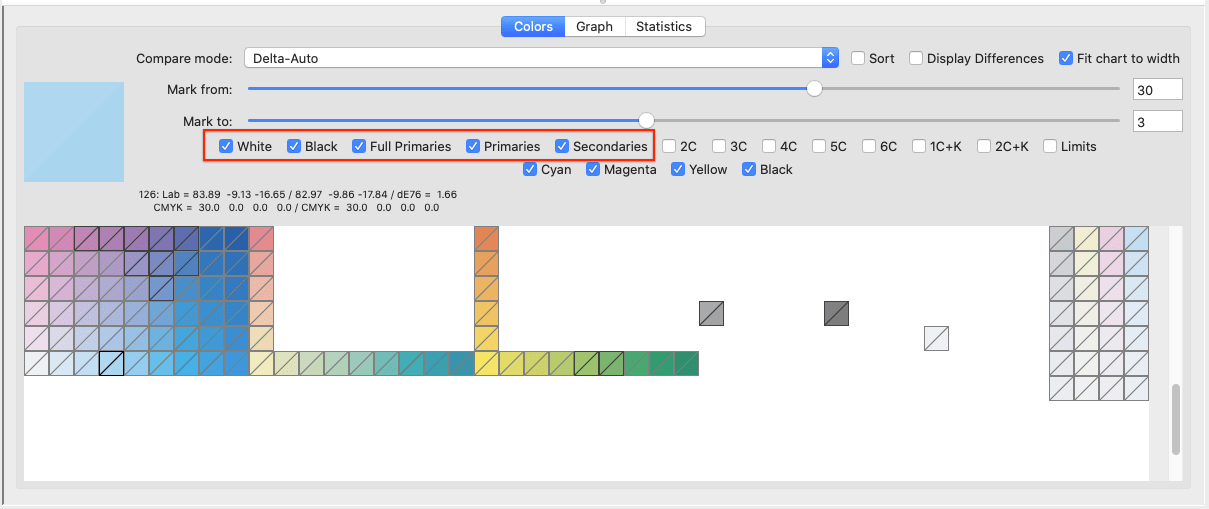
Note: For each selected patch, the Lab value and the color space and reference values are shown. If no patch is selected, the Maximum and Average delta values are displayed for the entire file considering the set filters.
Display Differences shows color deviations from white (no deviation) to dark gray (high deviations).
Fit chart to width displays the color patches as large as possible to the size of the window. Display the entire chart by clicking the check box.
Graph
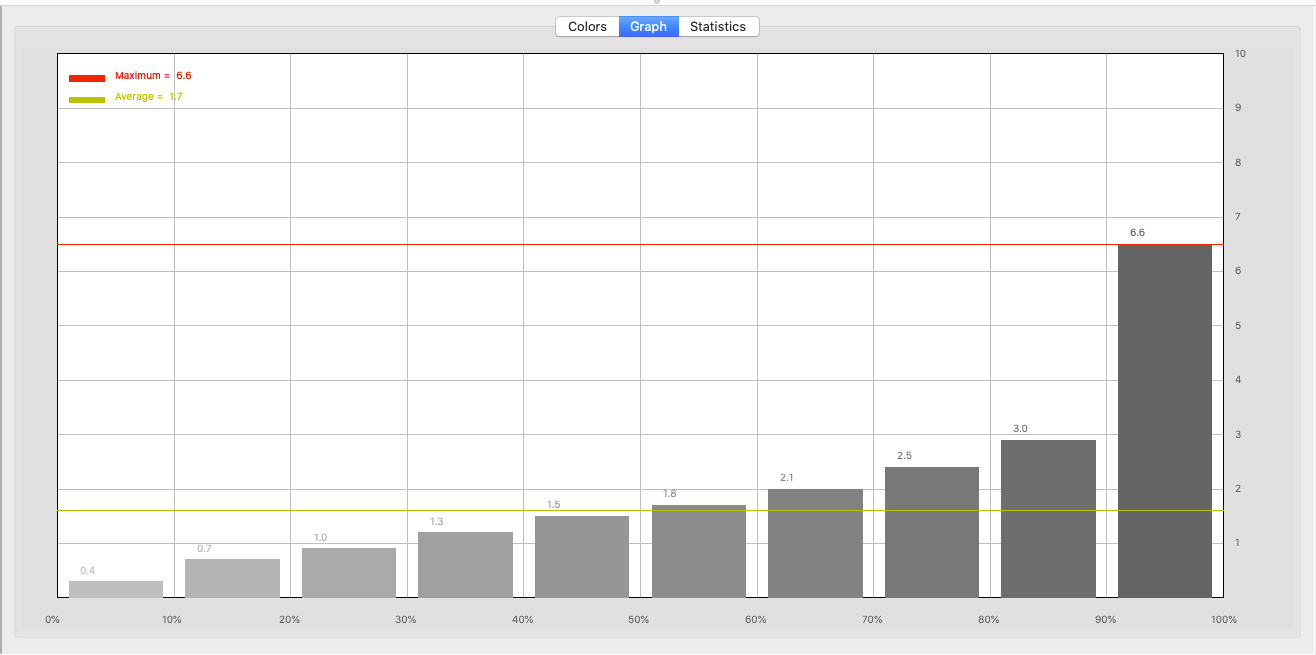
Shows a graphical representation of the error distribution as percentiles.
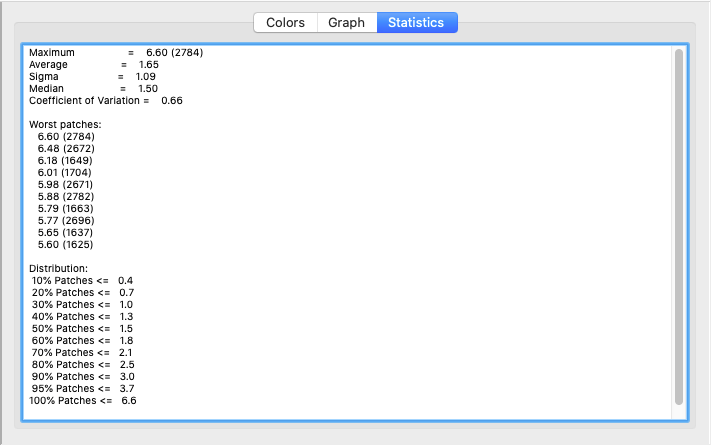
Statistics
Shows statistics like Average, Maximum, Sigma, Median, and Coefficient of Variation of the 10 worst patches and the error distribution in 10% percentiles.
Report
A Comparison Report can be created for two selected datasets.
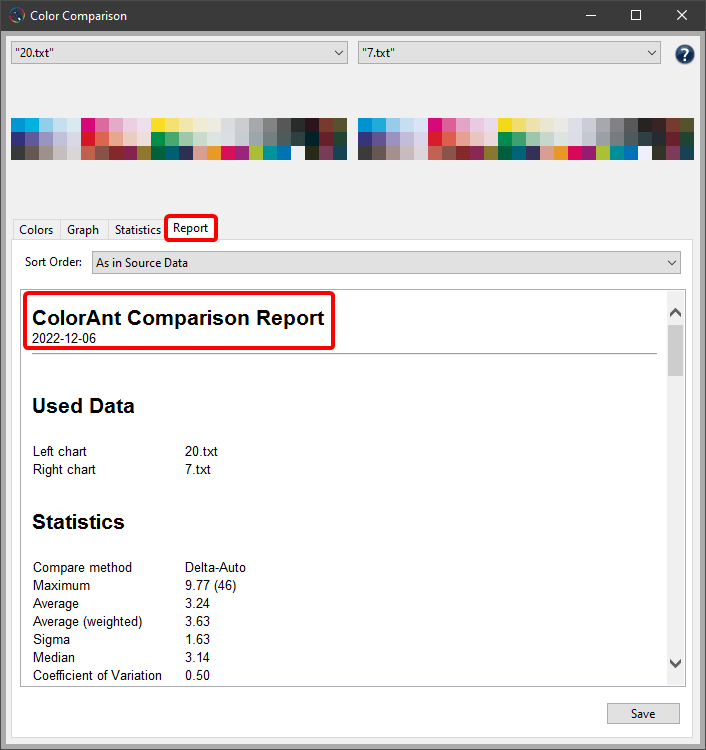
The Comparison Report contains information about the Average and Maximum deviation, the Patch numbers and their corresponding Lab values, the CMYK values and the Delta deviation of each patch.
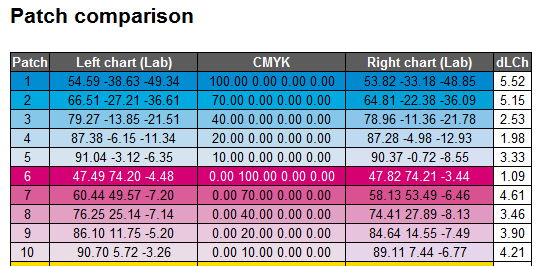
The Comparison Report can be saved as PDF or XML file.
Procedure
- Apply a correction to the measurement data.
- Select the data in the Data Set window.
- Click on the Compare button at the bottom of the window.
- Select the original measurement data from the drop-down menu in the upper left-hand window. Next, select the processed measurement data from the right-hand side of the window.
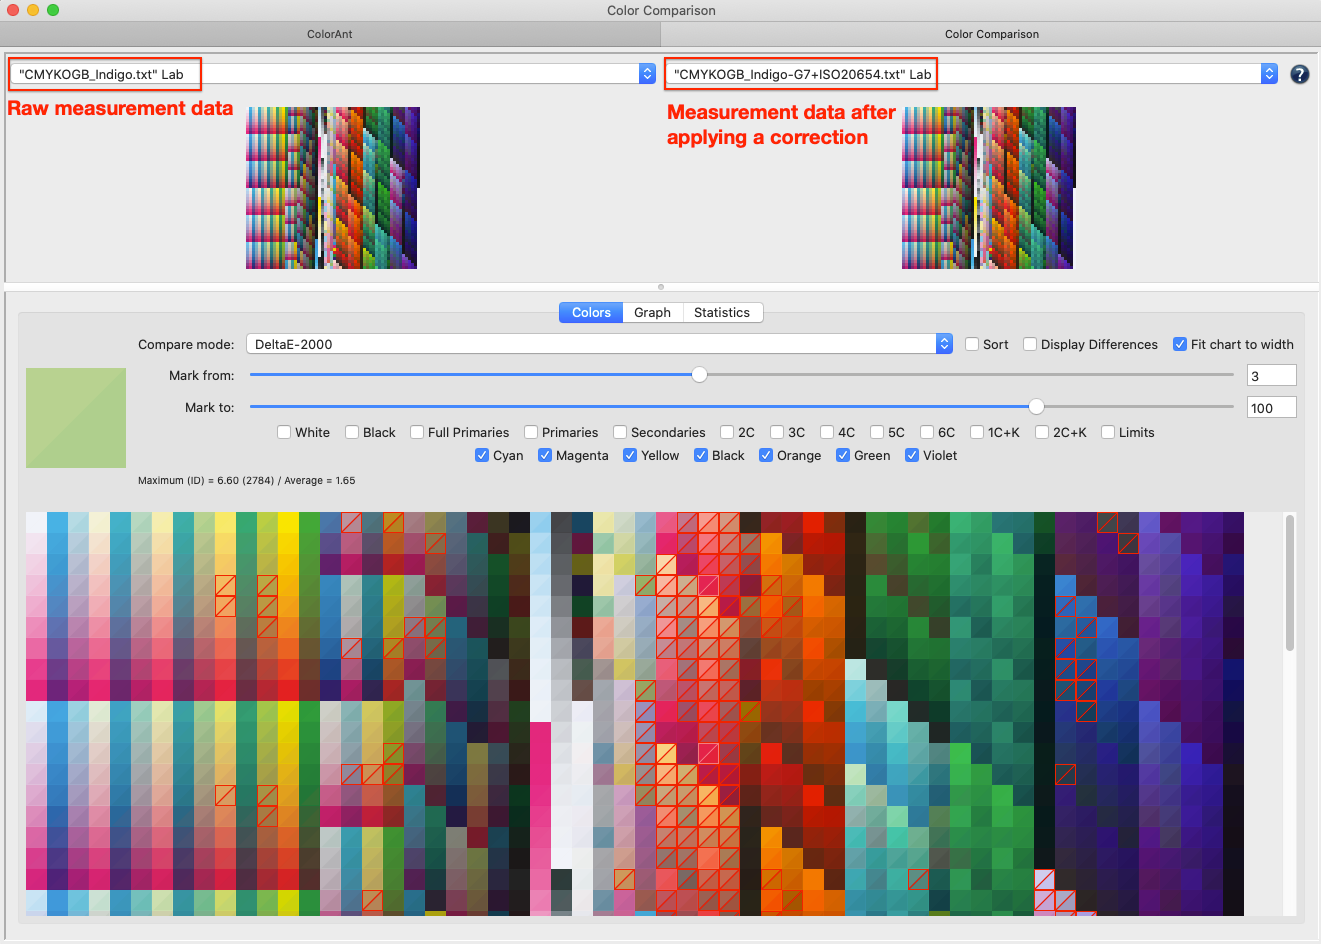
- Select the Compare mode from the drop-down menu (Delta-Auto, Delta-DCS, DeltaE-76, DeltaE-2000, Delta-Ch, Delta-L, Delta-C and Delta-H).

- Use Mark from and Mark to sliders to highlight patches within the DeltaE deviations selected. Highlighted patches are marked in red and the one patch with the maximum DeltaE is highlighted in cyan.
- Selecting a patch with the mouse – the before and after optimization will show in a split window with the Lab values and DeltaE information. If no patch has been selected, the Maximum and Average delta values are displayed.
- The Graph tab shows a graphical error distribution in percentiles.
- The Statistics tab lists statistical quantities such as maximum value, average, median, sigma, coefficient of variation as well as the ten worst measuring patches and the error distribution in 10% steps.
