ColorAnt | Quick Start Guide

Quick Start Guide
Introduction
Thank you for choosing ColorLogic’s ColorAnt. Reaching higher quality in production environments has never been easier.
ColorAnt, the ultimate color management solution
ColorAnt is the ultimate color management tool to manipulate, analyze and optimize measurement data including RGB, CMYK and Multicolor.
Use ColorAnt to create special measurement charts, measure color patches, and to check measurement data prior to profiling to avoid issues such as mis-measurements or inhomogeneous data. ColorAnt can be used to average several measurements together when required before creating a profile.
The quality of ICC profiles depends strongly on the quality of the measurement data used to create them. By adding analysis and optimization of measurement data, profile quality will improve which also leads to higher production safety.
ColorAnt's Online Help
The question mark ? (bottom right in all program windows) opens the Online Help. This is context-sensitive, so if you click ? in the Redundancies tool, the Redundancies online help page opens. The online help contains more detailed information about the various functions of this application.
Automatic Updates
ColorAnt can automatically search for new versions of the application at program start. Activate or deactivate the automatic update check under Help > Check for Update.
Enjoy analyzing and optimizing your measurement data!
Your ColorLogic Team
Click here to download a PDF version of the Quick Start Guide.
01 INSTALLATION
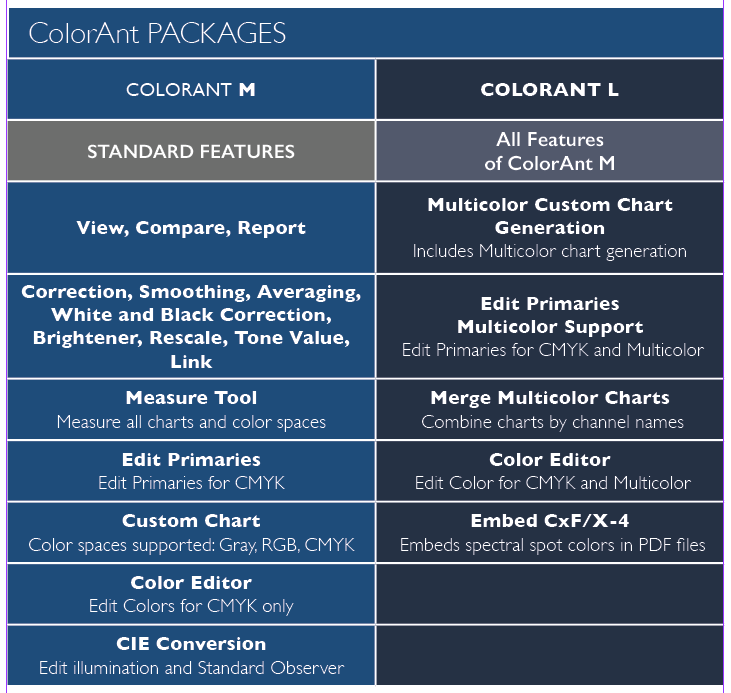
ColorAnt - Available Packages
02 MAIN WINDOW
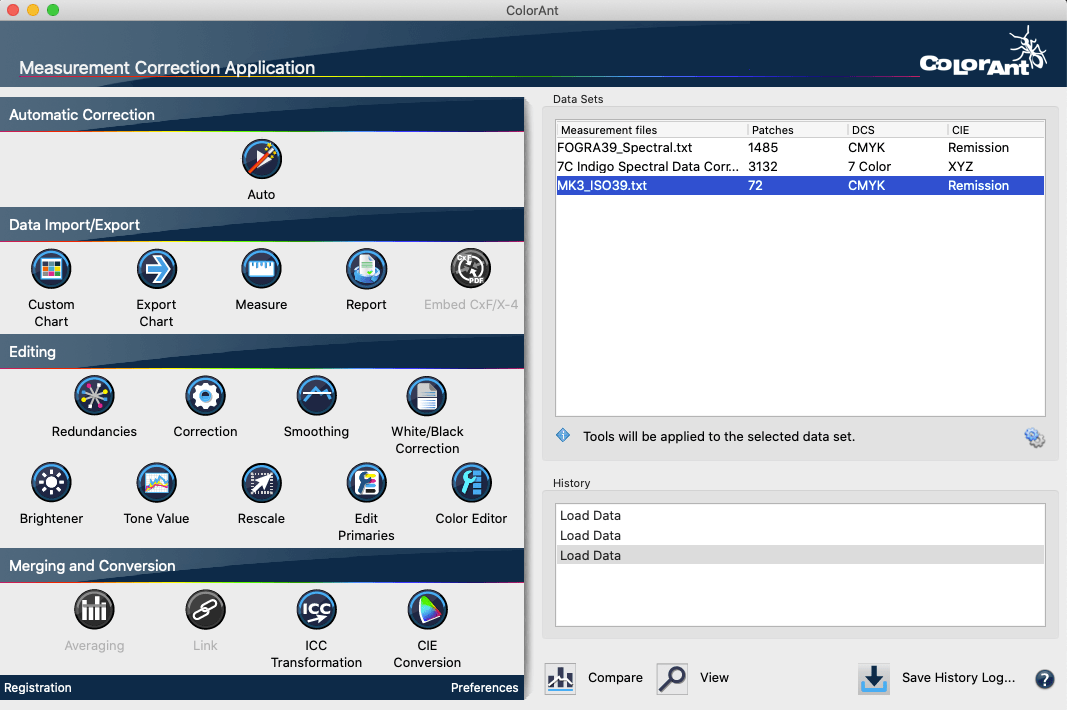
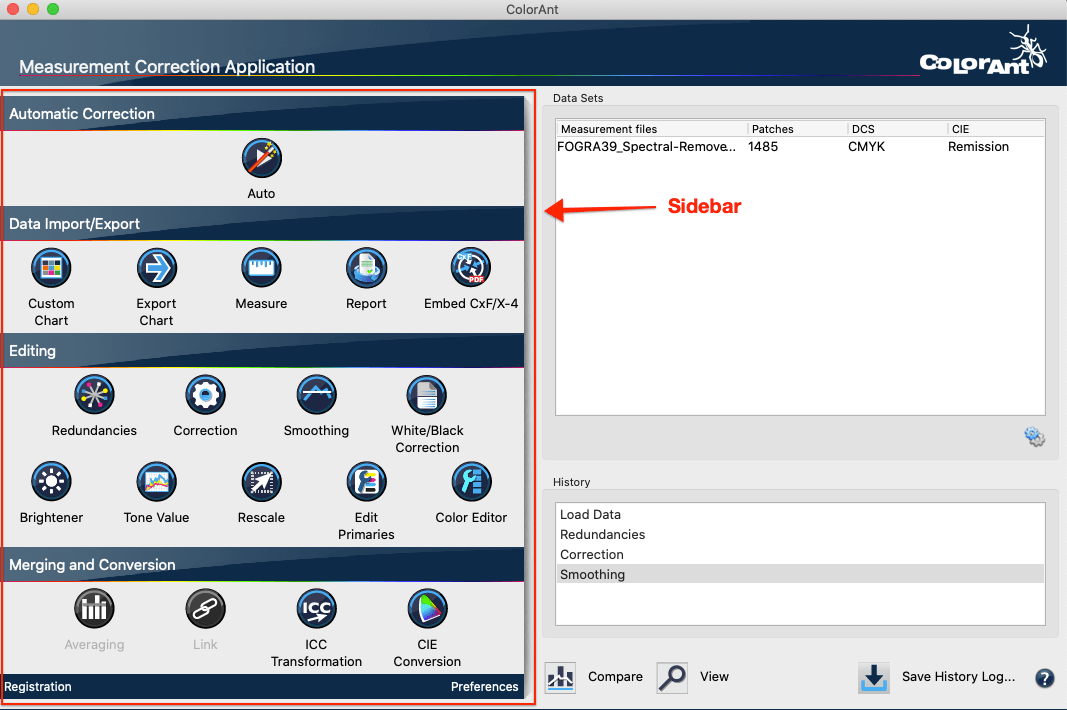
Sidebar
ColorAnt's Sidebar allows quick access to all tools from a central, easy-to-use location.
Automatic Correction
Auto
Correct measurement data automatically
Data Import/Export
Custom Chart
Create custom test charts
Export Chart
Export custom charts for printing and measuring
Measure
Measure printed charts or ambient light
Report
Create detailed reports on measurement data
Embed CxF/X-4
Embed CxF/X-4 spectral data in PDF files
Editing
Redundancies
Correct redundant patches in measurement data
Correction
Corrects and detects faulty measurements and inconsistent data
Smoothing
Smooth and correct uneven curves
White/Black Correction
Apply manual corrections to white and black areas
Brightener
Correct data for optical brighteners
Tone Value
Correct measurement data to a specific set of curves
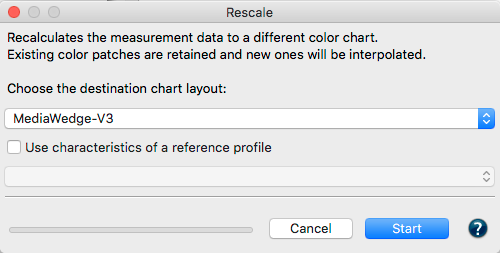
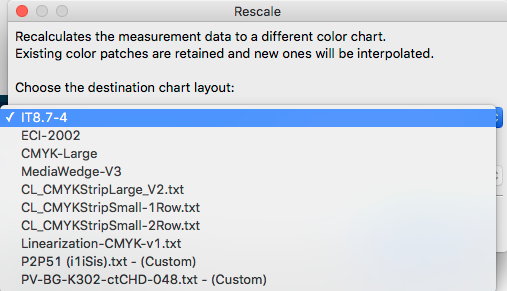
Rescale
Recalculate data to a different color chart
Edit Primaries
Add, remove, or exchange primaries and recalculate measurement data
Color Editor
Edit colors to match a reference file
Averaging
Average several data sets into one data set
Link
Combine multiple charts into one measurement file
ICC Transformation
Use ICC device and DeviceLink profiles to test impact on data
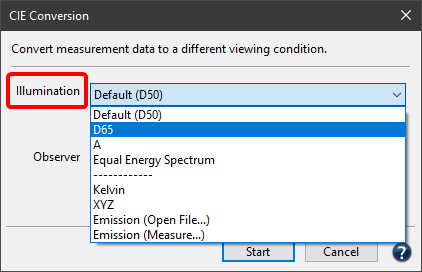
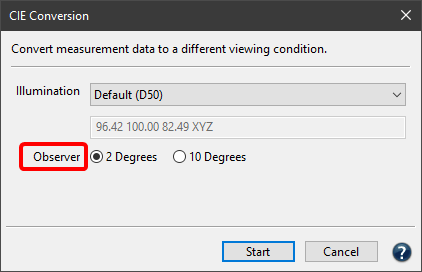
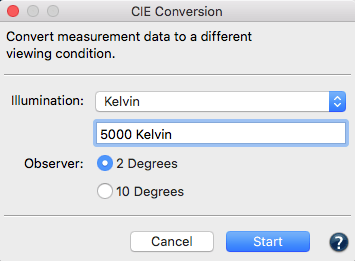
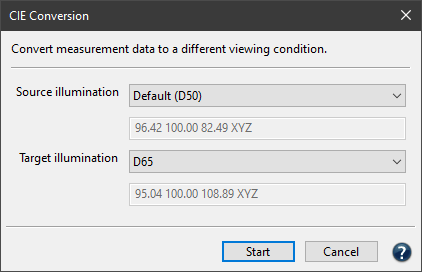
CIE Conversion
Change the standard observer illumination of data sets
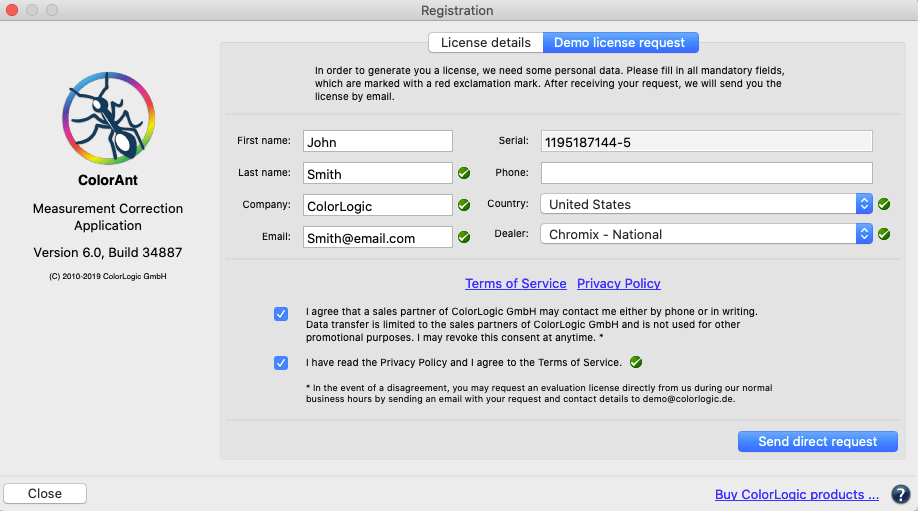
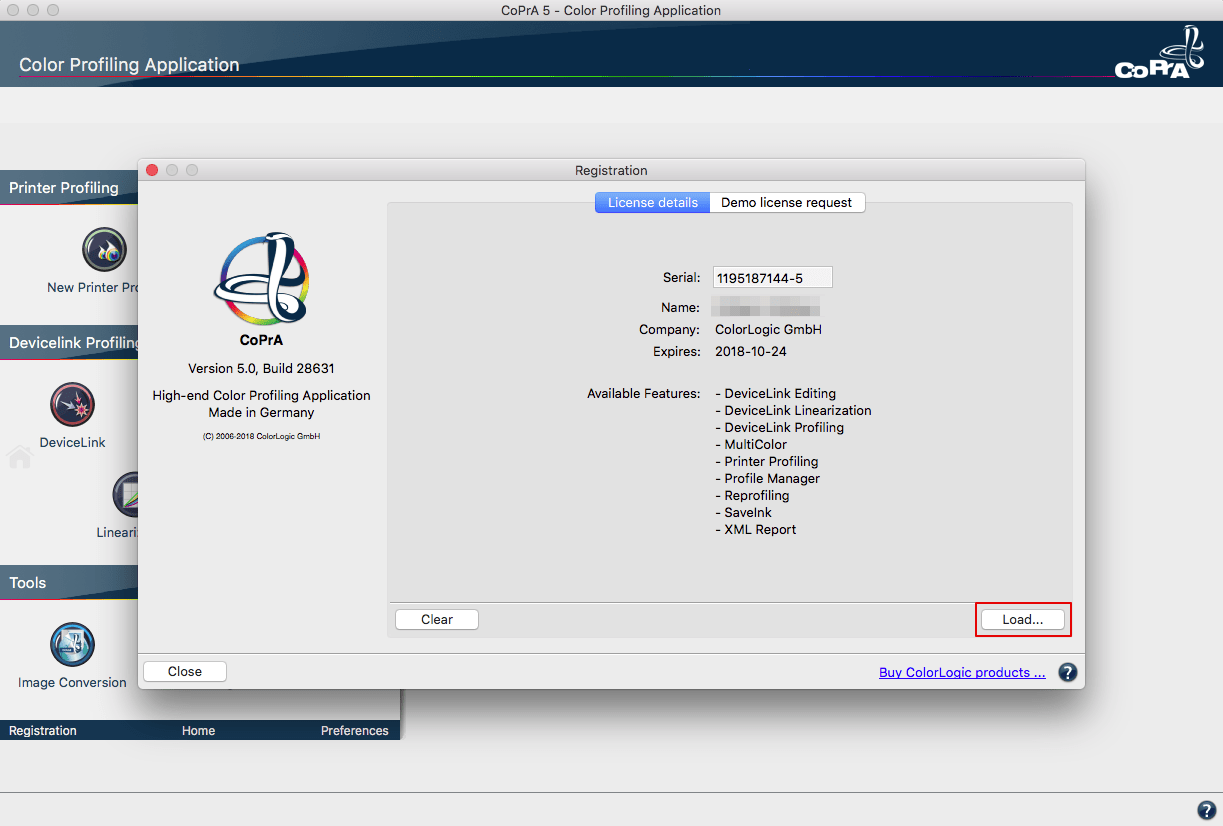
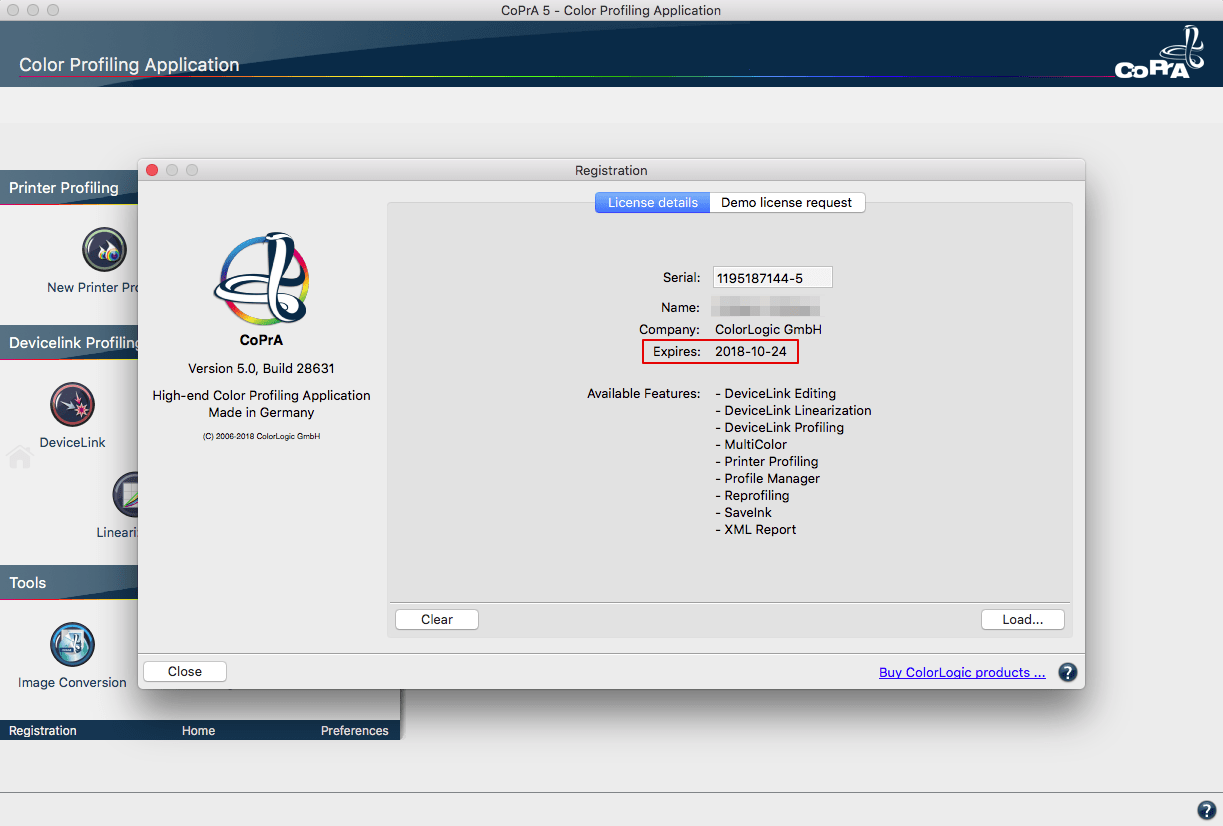
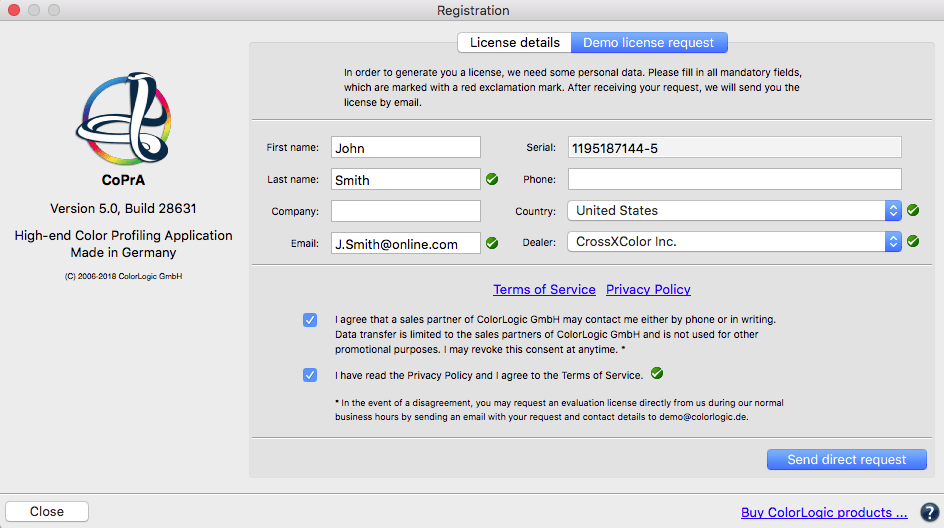
Registration
Activate ColorAnt and manage licences
Preferences
Preferences - Customize various ColorAnt settings
Data Sets and History
Data Sets
Displays relevant information about the measurement data: Number of Patches, DCS (color model: Lab, CMYK, RGB, Multicolor) and measurement type CIE (colorimetric = Lab, spectral = Remission).
History
Shows the tools and corrections applied to the measurement data of each editing step and allows switching between different editing states of a file. By clicking on an entry in the History window (either above or below the current status) an individual processing step can be accessed and checked, for example, in the View window.
Save History Log and Averaging Report
Save History Log is available at the bottom right of the main dialog (Fig 2.3). It saves all modifications applied to all files in a detailed PDF document. When double-clicking a single entry in the History section, a dialog pops up showing the settings applied to the data at a specific step. The single step can be saved with Save Log.
Averaging Features
The averaging log contains detailed reporting with sample colors (similar to the Report feature) comparing the averaged data and providing process control statistics. Standard deviations (sigma) for Density, dE and dH/dL. This allows users to easily recognize colors with large deviations which would not be obvious by visually confirming values.
View and Compare Data
Advanced viewing options for ColorAnt’s tools are located at the bottom of the main window enabling both the inspection of measurement data (View) and the pre- and post-comparison of measurement data (Compare).
To view measurement data, select the data in the Data Sets area and open the View window. Five different options allow for a quick overview of all color patches in the measurement file: the 2D view shows the reference and the corresponding Lab values for each patch, 3D shows a rotating view of the color space, TVI displays the curves for each channel, Spider Web for a top down view, and Curves for various gradations and various curves of gradations.
Color filters: Using the checkboxes, colors can be selectively displayed in 2D and 3D view. All other color patches are then hidden. This allows you to immediately find selected colors in the test chart layout of the 2D view.
The 3D view displays the color body defined by the color filters. This way, the Full Primaries, Limits, Primaries, Secondaries, White or Black can be viewed separately. With Multicolor data, it is easy to recognize in which areas the additional colors extend the color body compared to CMY or CMYK.
There are some dependencies between the color filters, so selecting a certain color filter may automatically activate another color filter (or even several others). For example, if the Secondaries checkbox is activated, the Primaries and White color filters are also automatically activated. They can be deactivated if only two color combinations (Secondaries) are to be highlighted.
Color channels: By selecting color channels, either all color patches or only the color patches of the selected color channels can be displayed. Color channels can be combined with color filters so that, for example, only the Multicolor Primaries or Secondaries can be displayed. Duplex and triplex colors can be displayed by individual selection of suitable color channels (for example, Cyan + Black shows duplex colors and Cyan + Magenta + Black shows triplex colors).
2D View
Color filters highlight selected colors. View full primaries, limits, selected channels, primaries, secondaries, paper white or black. Individual color patches can be edited or deleted by selecting the patch and right-clicking to open a context menu.
3D View
Turn the color patches into the desired direction by clicking and dragging. By dragging the gamut, the color space is rotated in that direction. Increase or decrease the view by using the right side Zoom slider. Enlarge or minimize the color patches by using the Point Size slider.
TVI
Analyze Tone Value Increase curves (TVI). The tone value curve works in conjunction with the curve view or any other correction which will affect the TVI. Choose either Murray-Davies or ISO 20654 (SCTV) methods.
Spider Web
The Spider Web provides a top view of the color space in an a*-b* diagram. The measured or optimized color patches are arranged in a spider web configuration. Verify changes in the View dialog by moving forward or backward in the History list.
Curves
View the linearity curves from white to all 100% primary colors, (including multicolor data). Visualizes data and assists with analyzing non-smooth gradation curves. Choose from ColorLogic Default, ISO 20654 (SCTV) or Tone Value.
03 USING COLORANT
Automatic Correction
The Auto feature optimizes measurement data by applying the following tools in the specified order:
Redundancies: Clean up redundant color patches
Correction: Correcting faulty measurement values
Smoothing: 50% slider setting with no protection of highlights
Each tool that is applied is displayed in the History section. ColorLogic recommends to create a Report for detailed results and further recommendations on your measurement data.
Procedure
- Load measurement data by drag-and-drop onto the Data Sets area or via File > Open.
- Click Auto and then Start. The corrections applied to the data are displayed under History.
- Save the optimized measurement data as a new file via File > Save as. Use the optimized measurement data in profiling software such as ColorLogic’s CoPrA to create high quality ICC printer profiles.
Measure
Measurement data is acquired with the Measure Tool and transferred to ColorAnt. Measurement data files are stored in the folder Users/Documents/ColorAnt/MeasurementData. The Data Sets section of the main window displays pertinent information about the measurement data including: number of color patches, color model (Lab, CMYK, RGB, Multicolor), measurement value type (colorimetric = Lab - spectral = Remission).
Sidebar tools will be highlighted when applicable to the measurement data, tools which are not applicable are grayed out. Use the tools by first highlighting the data (multiple files can be selected, e.g., by linking or merging several data sets together) and right click. When multiple data sets are present and no set is selected, corrections are applied to all measurement files.
View and Compare Data
View
The View window provides plenty of features that facilitate the evaluation of measurement data. Filters allow the combining of individual channels. Combinations of 2, 3, 4, 5 or 6 channels, as well as one and two channels in combination with black, can be faded in and out. These filters are available in 2D and 3D view.
The number of displayed color patches is shown on the left, i.e., if one or more filters are selected, the number of affected color patches as well as the total number of patches is shown on the left.
Compare
The Color Comparison window shows measurement data (Fig 3.2) before and after optimization. It can also be used to view the actions taken to optimize the data (e.g., File Name Correction, File Name Smoothing). Filters allow the combination of individual channels which are to be compared.
The Mark from and Mark to slider displays various levels of DeltaE deviations.
Save or export measurement data
The name of every tool applied to correct or optimize data is appended to the name of the data set (e.g., Data_smoothed_corrected). Save the optimized measurement data with File > Save As. Additional export options allow conversion of spectral data to Lab or Density only. Other Save As options include CGATS compatible TXT file, CGATS XML, Named Color ICC profile, CxF compatible CXF file format, Photoshop ACO, color table, Adobe ASE or as GMG CSC file.
Generate Reports
ColorLogic recommends using the Report tool both on the initial data import and after the measurement data has been optimized.
04 DATA IMPORT & EXPORT
Custom Chart
The Custom Chart tool is designed to create reference files for test chart generation. A custom test chart for profiling requires a reference file containing the device data for the color space.
Note: Creating multicolor charts requires a ColorAnt L license.
Depending on the selection of color space, the Custom Chart dialog provides several options:
Gray, RGB and CMYK: Define the Number of Patches and click OK. Select the desired Color Space from the drop-down menu.
CMYK: Choose the linearization from another measurement data set or from another print run as a starting point. To use the linearization feature, load the appropriate measurement file in ColorAnt before opening the Custom Chart tool and select the file under Color Space.
Multicolor Charts
Modifying settings: Select the desired Color Space. For example, to create a 6 color profiling chart, ColorAnt will display a pre-defined color order, in this example: CMYK+Pantone Red and Green. The Eyedropper function allows reordering the channels. To exchange the 5th channel which is Red with Green (similar to fig 4.1) click on the Red Eyedropper Icon and from the Colors section select Green by clicking on it.
Mode: Select one of the presets based on the purpose of the test chart: Profiling, Flexo Profiling, Profile Updating, Linearization or CxF/X-4 Wedge.
Number of patches: Affects how precisely the device color space will be filled with color patches. Please consider the available space on your output, the required accuracy of the characterization data and the capabilities of your printer. Available choices are Large, Medium and Small test charts and a Custom option which allows entering a specific number of patches (the Custom option is not available for CxF/X-4).
Note: The Custom Chart tool works even with only a few patches. The color space is covered in the best possible way to allow proper profile creation.
Changing or defining the channel names
To change channel names, click the Pencil icon, e.g., click the Green channel and type in the new name.
Define the channel name of each channel, (including or excluding CMYK) enter the name in the text field or click on the Eyedropper icon and select a color from the pop up dialog that matches closest.
Linearization
ColorAnt provides intelligent settings that provide a starting point for typical use cases to create Linearization test charts, Profiling test charts, special profiling test charts for Flexo printing and Profile Updating. The Number of Patches feature chooses the optimal number of patches for specific profiling situations.
Note: This option is useful for difficult print processes that are challenging to profile. ColorAnt uses a very smooth linearization to avoid inconsistencies in the curves.
Once the color space, channel names and the Number of Patches are defined, click OK and calculate the reference file. The reference file will appear in the Data Sets section. Save the file if necessary for other chart generation tools. To create a test chart within ColorAnt, select the reference file and click Export Chart.
Export Chart
Export Chart creates test charts based on device color values (e.g., RGB, CMYK, 7 Color etc.), which can be stored as PDF, TIFF or PSD files.
At the top a Preset covering all settings can be selected and manual presets can be created, saved or deleted. The largest section covers options for Chart Dimensions, Patch Sizes and additional Options. The section on the bottom provides information on the number of files to be created with the chosen Preset, settings and buttons to Cancel or create (Start) the test charts. The tool is optimized to work with most of the instruments supported in the Measure Tool. The Custom Chart tool fills the full chart width with patches minus margins for the numbering. Instruments that do not have width limitation (no ruler required) can benefit from this feature.
Ink Limit takes into account printing processes that can't handle 400% ink on paper/substrate. Typically each of ColorLogic’s CMYK and multicolor test charts have patches with a maximum of 400% ink. If a 400% ink limit is too high for the press, or the user would like to define another ink limit, the user can enter the desired Ink Limit. The resulting chart will have ink limit integrated. Use the exported reference file for measuring and profiling.
Procedure
Step one: Select the reference file with the required device color values.
Step two: Use either one of the presets, or define a custom size and patch width.
Step three: Define the number of patches to be produced.
Measure
ColorAnt’s Measure Tool is used to measure test charts for profile creation.
Measuring test charts
- Select Measure from the sidebar.
- Select the measurement device under Selection and the measuring mode (M0, M1, M2 or M3).
- Connect your device and open the test chart. Charts can be opened via the File menu via the Recently used files and Predefined Charts entries. Your own charts can be added to the list by placing them in the ColorAnt Wedges folder (User\Documents\ColorAnt\Wedges). Alternatively, simply load a reference file or drag-and-drop it onto the window.
- Select the Direction of scanning: Patches - Line by line, Patches - Column by column, Scan Rows or Scan Columns.
- Begin measuring: Follow the instructions of your measurement device. For the virtual device, double click the first patch to start the measurement.
- Transmit Data: When measuring is completed, click the Transmit icon to transfer the data into ColorAnt’s Data Sets section.
Report
A Report offers detailed information for measurement data analysis and provides recommendations for measurement data corrections. It can be used to verify and graphically display the data, and is therefore a powerful feature to document which types of corrections are necessary for the measurement data.
The various report pages provide an insight into the Tonal Value Increase Curves, the gamut representation (Spider Web) as well as the results of the test on the matching of redundant color patches (Quality Evaluation section), measurement or printing errors and the smoothness of the measurement file.
Embed CxF/X-4
Allows to embed spectral measurement data of spot colors (compliant with CxF/X-4) in a PDF file so that other CxF/X-4 compatible tools (e.g., ZePrA) are able to extract or use this data.
Procedure
Open the PDF/X file. The tool lists all spot colors of the PDF file, checks for spot color names that fit those of the CxF/X-4 measurement data and warns in case of conflicts. The data will only be embedded if the spot color names of the PDF file fit those of the CxF/X-4 file (Fig 4.5). When the spot colors match up, click on Start.
05 EDITING
Editing
Redundancies
Corrects color patches by averaging the redundant patches and replacing with the same value.
Correction
Detects faulty measurements or inconsistent measured values and replaces the data with expected measurement values. Use the Protect Lights feature to exempt Flexo data bumps.
Smoothing
Corrects inhomogeneous measurement data and non-smooth curves by interpolating existing smoothed data. The Auto correction uses the maximum slider setting. Use the Protect Lights feature to exempt Flexo data bumps for being unintentionally smoothed.
White/Black Correction
Apply manual corrections to the most white and darkest color patches, typically the paper or other substrates. The White/Black Correction tool is designed to be used only on a single measurement file.
Brightener
Step one: Analysis
Brightener corrects and analyzes the remission curve of the paper white to determine whether the paper contains optical brighteners or is merely a blue-colored paper.
Step two: Correction
Correction will be applied when optical brightener has been detected. The correction can be adjusted via a slider control and at 100% setting, a similar result will be achieved as if the paper were measured with a UV cut filter.
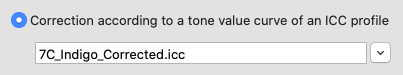
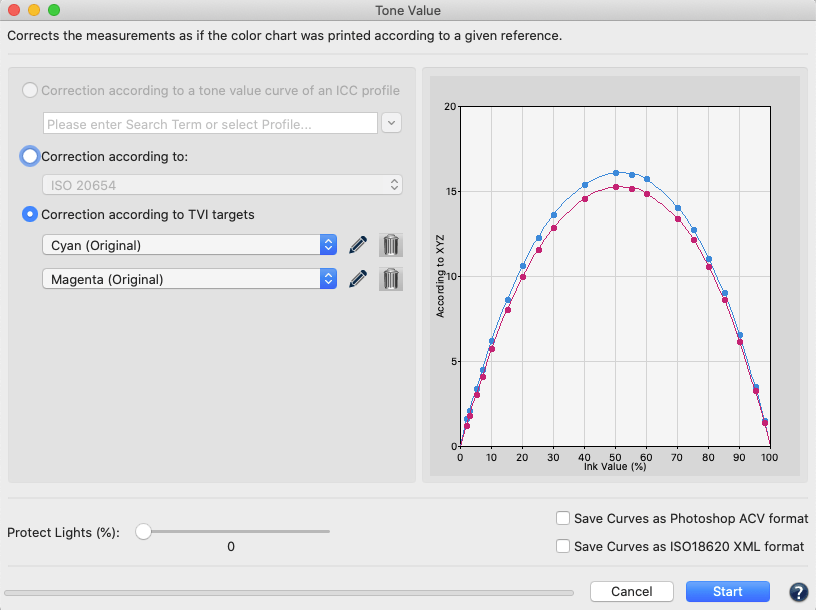
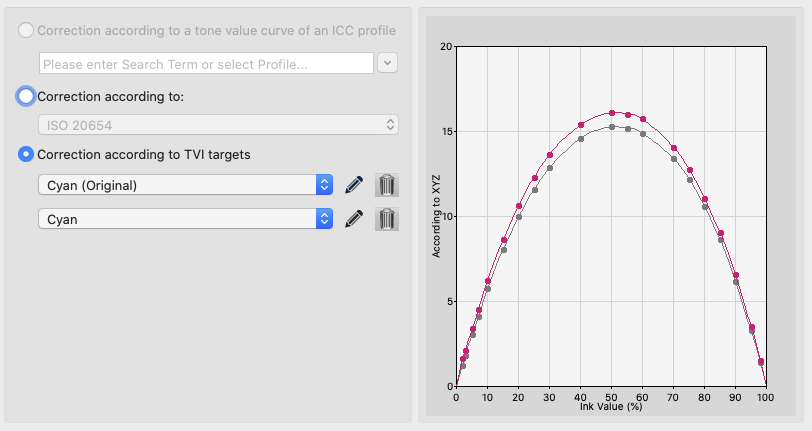
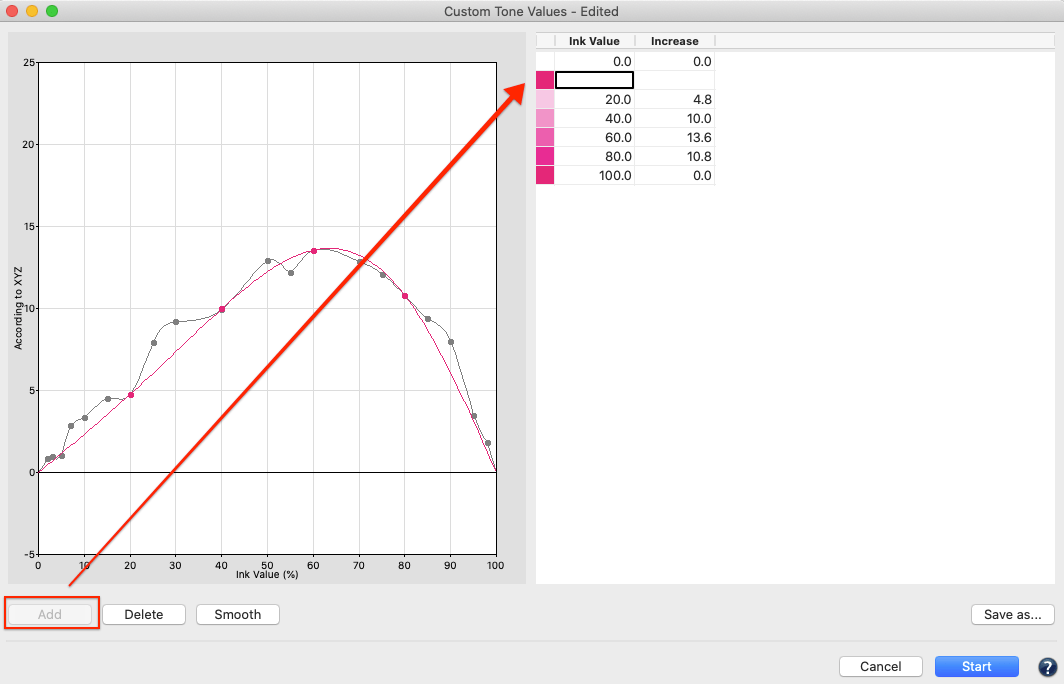
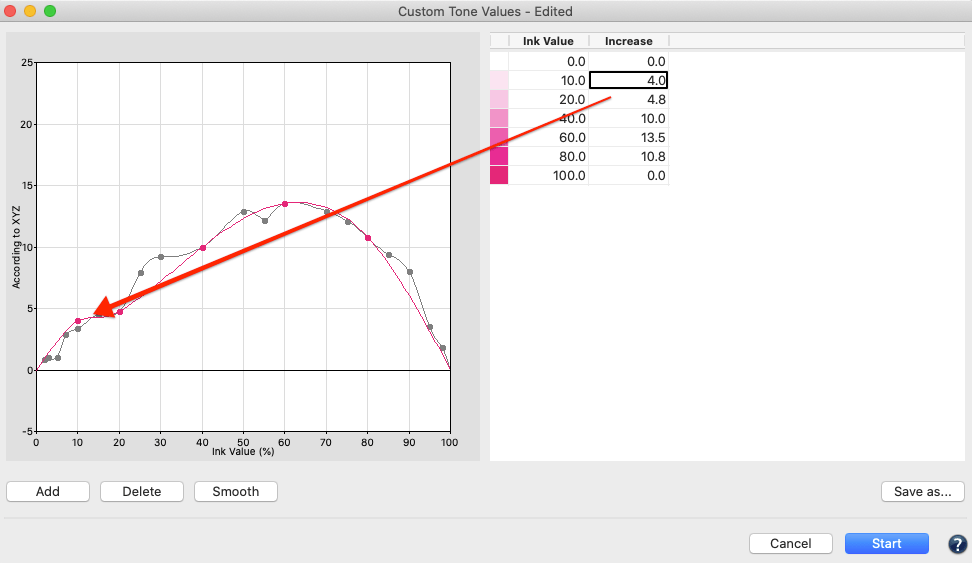
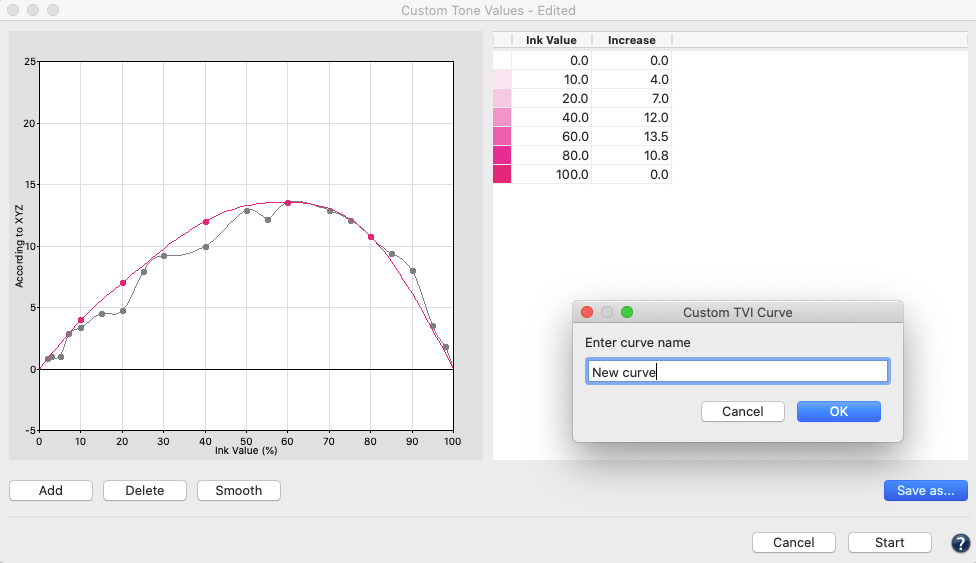
Tone Value
Corrects measurement data to a specific set of curves. Data is corrected according to specific conditions (e.g., G7, ISO 20654 SCTV). The Protect Lights slider can be adjusted to protect the highlights of flexo data. Correction curves can be exported as Photoshop gradation curves (ACV) and as XML according to ISO 18620 to be used in either Adobe Photoshop or any external RIP software that supports the ISO 18620 standard.
Three options are available:
Correction according to a given profile:
Specify a profile and the measured values are adjusted to achieve the same tone value increase curves as those of the selected profile.
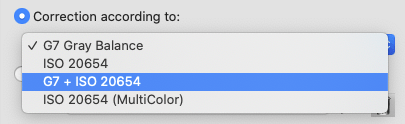
Correction according to:
Tone value curves are calculated to match the requirements of G7 Gray Balance, ISO 20654 (SCTV), G7 + ISO 20654 (SCTV) or ISO 20654 (MultiColor).
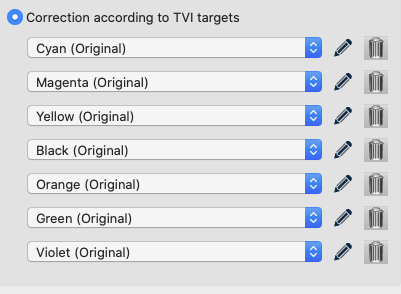
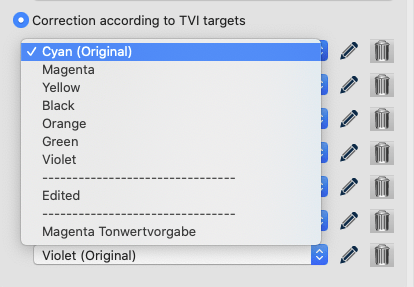
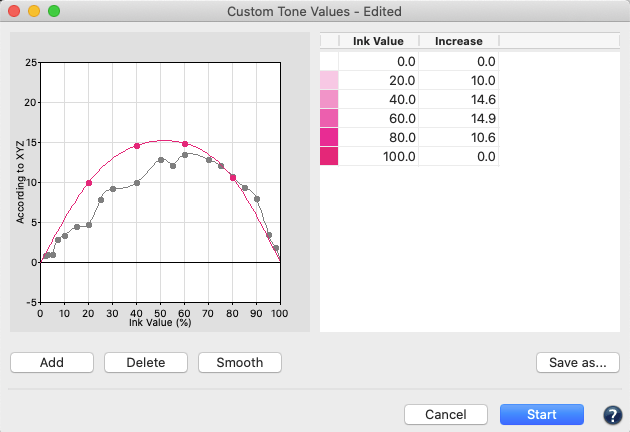
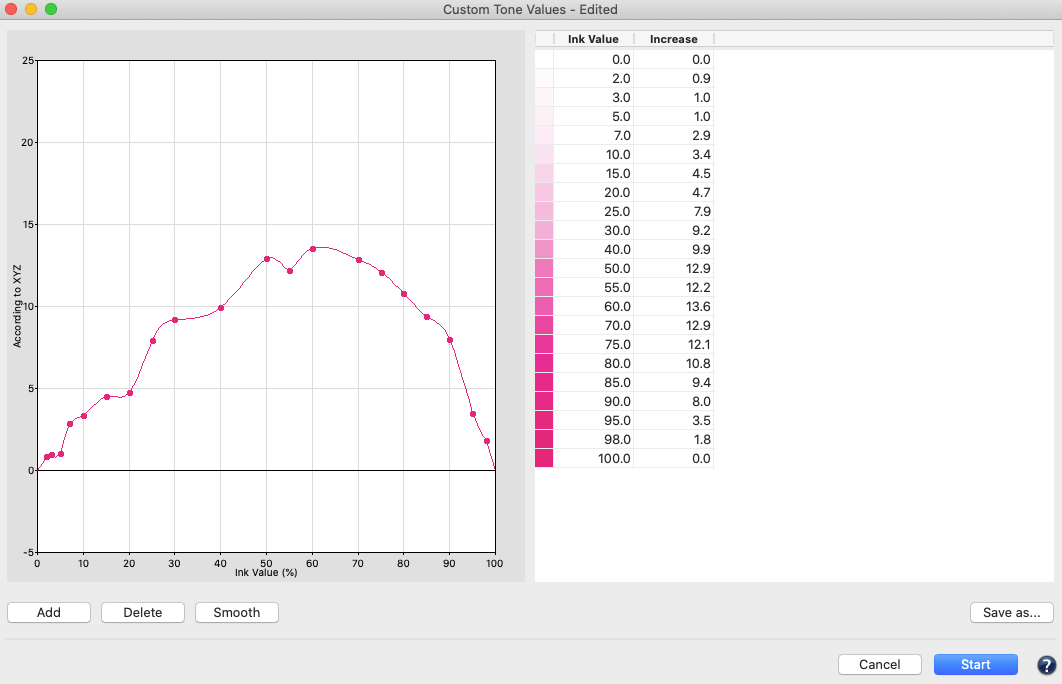
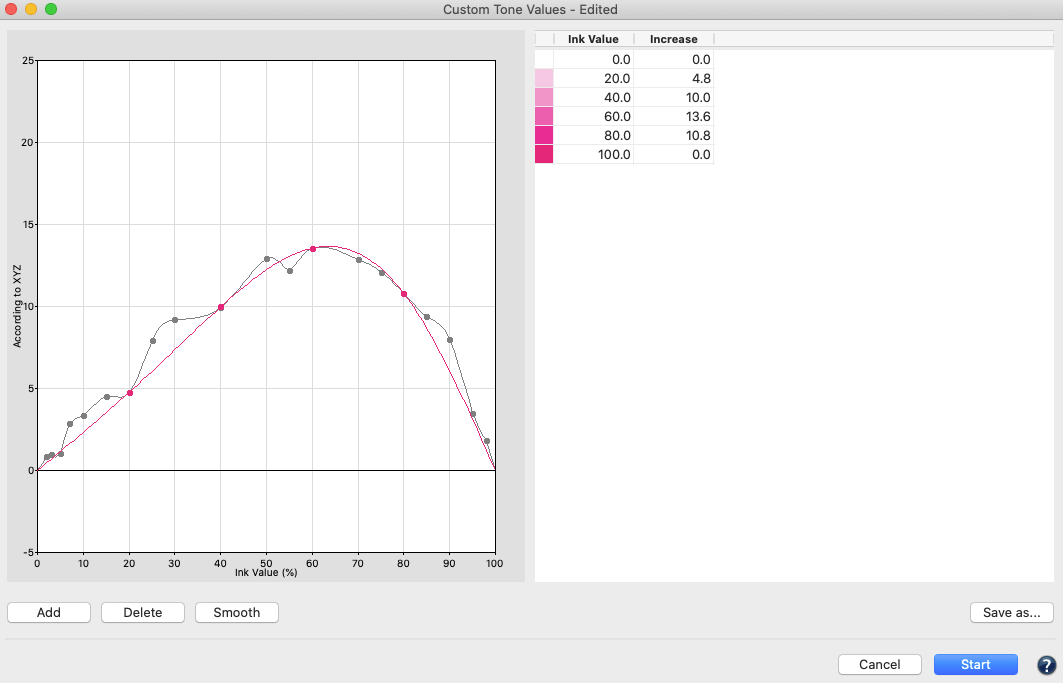
Correction according to TVI targets:
Manual editing of each channel (Fig 5.1) allows predefining the increases in tone value to be incorporated in the measurement data
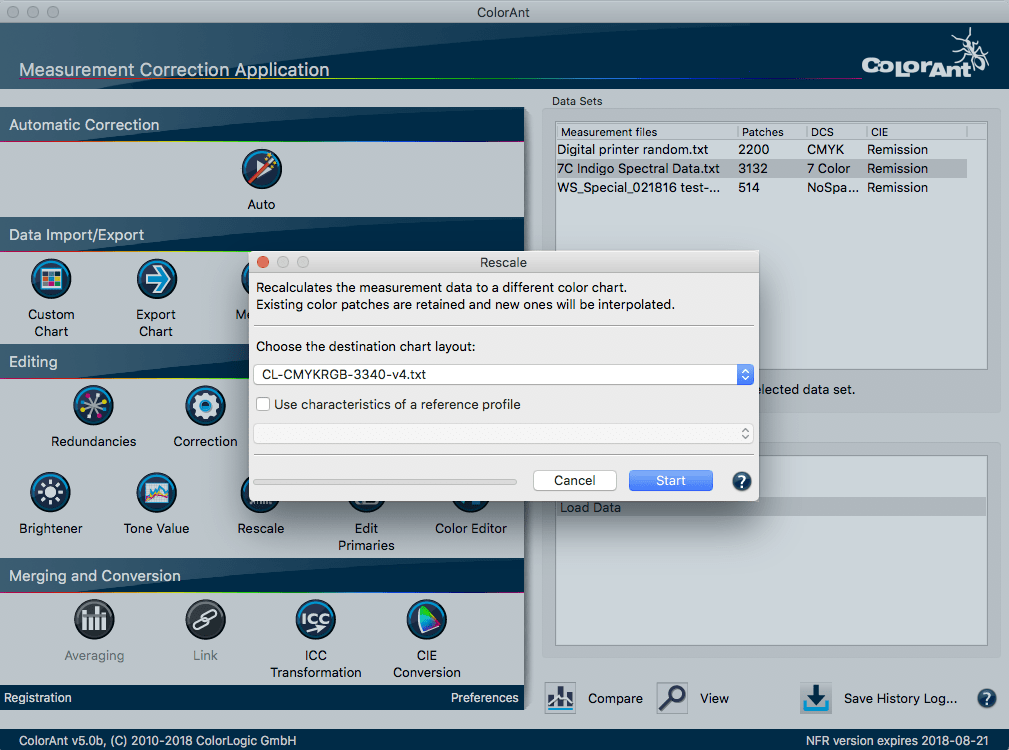
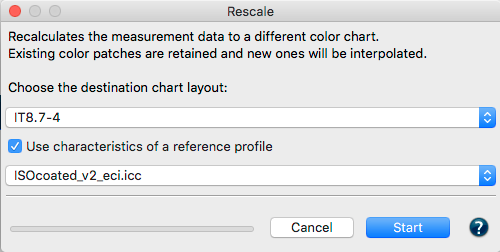
Rescale
ColorAnt can calculate a large test chart based on several measurement files from small test charts. In some printing processes, (e.g., flexo printing on uneven materials) it can be challenging to achieve artifact-free printing of a large test chart. An effective approach to measuring large charts is to place several small test strips on a single page, measure, average and scale up the test strips to a large ECI2002 test chart using the Rescale tool.
Averaging
Average several measurement files (e.g., press runs) of the same test chart and combine them to form a data set.
Link
Combine multiple data sets into a single large data set. We recommend to verify the obtained data using the View tool and to optimize the data with either the Auto function or the Redundancies tool.
ICC Transformation
Use both ICC device and DeviceLink profiles on reference data (device data such as CMYK or RGB) to test the impact of an ICC color conversion with up to three profiles.
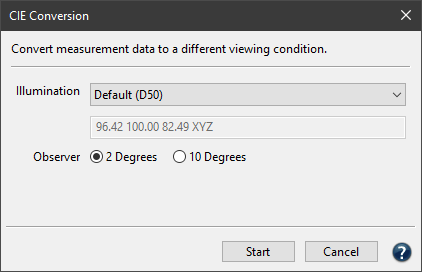
CIE Conversion
Convert spectral measurement data into another viewing condition. The spectral data are converted to Lab during CIE conversion with the set illumination and the selected observer.
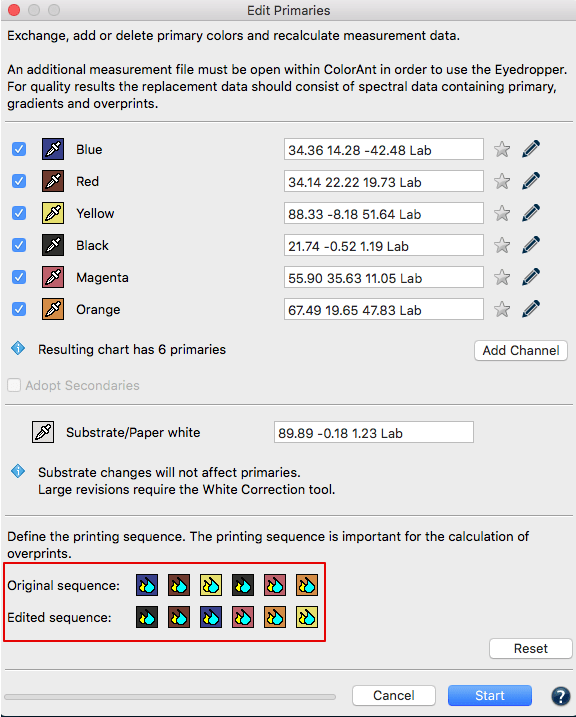
Edit Primaries
Add, remove, and exchange primaries or the paper/substrate in existing measurement data (Fig 5.2).
In typical print production, adding or swapping ink(s) requires the expense of printing a complete, full size test chart. The Edit Primaries tool simply requires the spectral data of the new ink(s) to be added or exchanged. It also recalculates all overprints based on intelligent spectral color models. One of the major features is its ability to dynamically choose the best patches from the data provided. The more complete the provided data, the more accurate the results. This improves the exchange of gradations of the primary color and overprint information, e.g., the primary combined with black. If the selected data contains overprints, such as secondary colors, the Adapt Secondaries feature will take the additional data into account.
Scenarios for potential efficiency gain with the Edit Primaries tool in production:
Modify channel names: Reorder channel names without modifying data
Variance in press condition: The characterization press run is slightly deficient in solid ink density or hue on one or more colors.
Exchange of paper/substrate: The inks are the same but a slightly different paper shall be used.
Exchanging inks in a print packaging production environment: Create a new profile that swaps colors, e.g., Blue for Cyan or Rhodamine Red for Magenta.
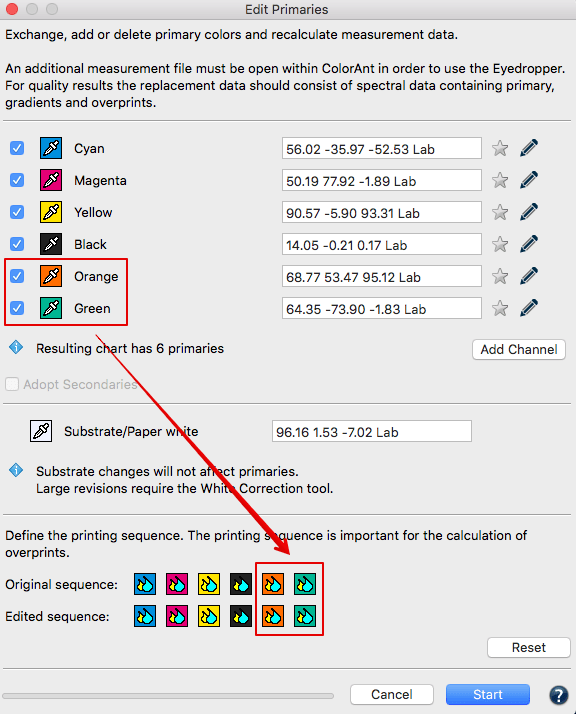
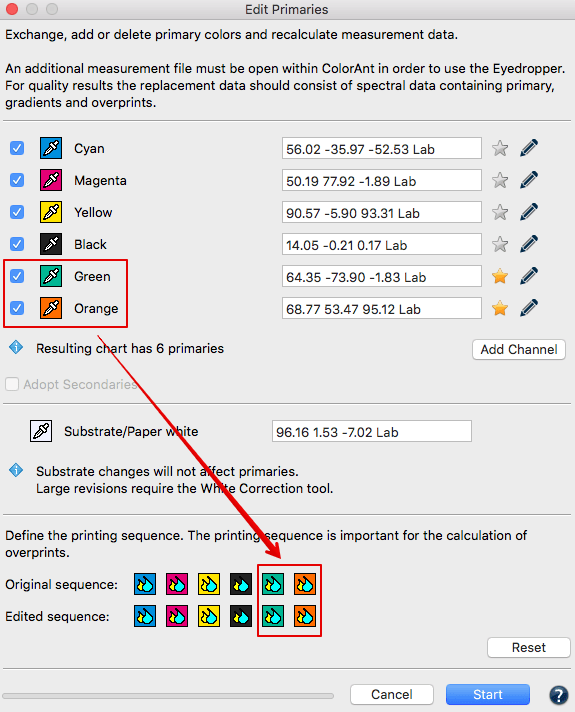
Adjusting the print sequence: Allows improved overprint calculations.
Flexibility for the packaging manufacturer: Create different color variants from a full size 7 color press characterization data set by deleting channels to building new characterization data sets without printing a new test chart. For example, from an original 7C data set (e.g., CMYK+Orange+Green+Violet) build variants for CMYK only, CMY+Violet, CMYK+Orange+Green or other combinations. The production facility would need to ensure the press is stable, and depending on the color needs of the job(s), print select the profile with the least amount of channels.
Increasing CMYK gamut: Adding a 5th, 6th or 7th color to the CMYK printing process.
Using Edit Primaries
We suggest loading another data set with the measured new primaries, gradations of the primaries and overprint information. Select the measurement data of a test chart measurement file for editing and click Edit Primary.
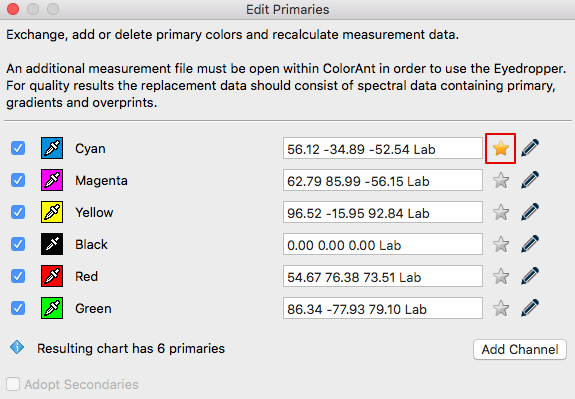
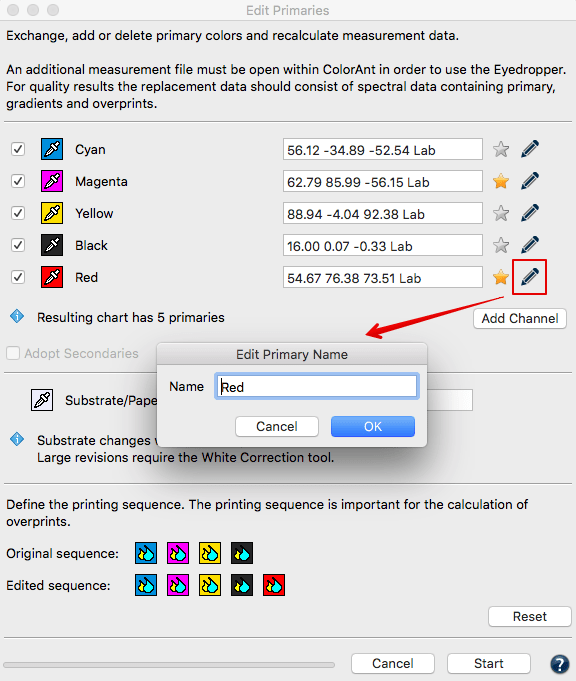
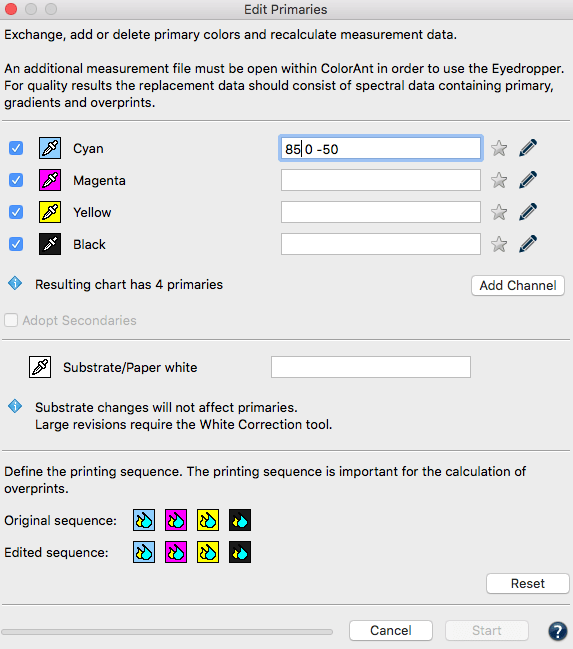
Exchanging a primary: Click on the Eyedropper icon of the color to be exchanged. Select the new primary from another data set loaded in ColorAnt. Click on the channel to be imported to the primary. Fig 5.2 shows a new Cyan ink that is slightly different. Selecting ink from other channels is also possible. Click OK and the data set will be modified.
Important: Using Lab values will not produce the highest quality results. ColorLogic recommends using spectral data. When a data set is present, enter a new Lab value for the selected color or select another channel from the same measurement data set to change the printing order.
Verify the exchange of primaries with the Compare tool.
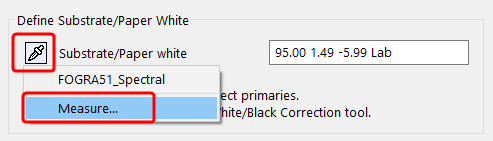
Exchange paper/substrate
Load the test chart measurement data and load the secondary file containing information of the measured paper white into ColorAnt.
Select the measurement data of a test chart for editing and click Edit Primaries.
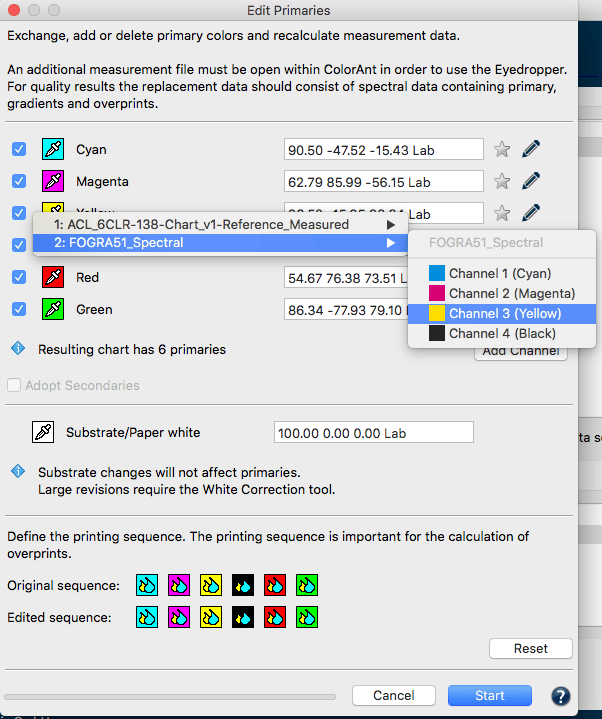
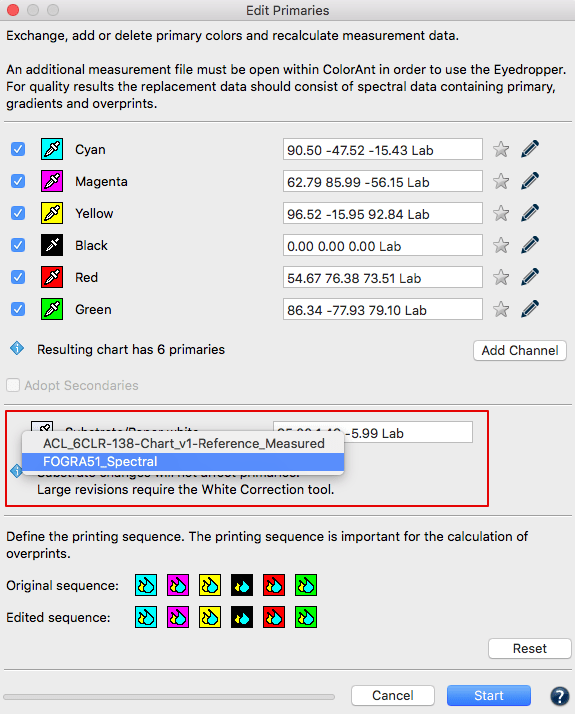
Click on the Eyedropper icon of the Substrate/Paper white and select the new paper white from another data set loaded in ColorAnt (Fig 5.3). Click on the name of the data set to import the data. The second option is to manually enter the new Lab values in the text field.
Click OK and the data set will be modified. For large differences in substrates, use the White/Black correction tool.
Adding channels
- Load the test chart measurement data and load the secondary information with the measured primaries, gradation and overprint information into ColorAnt.
- Select the measurement data you would like to edit and click Edit Primaries.
- Click on Add Channel. A new channel with default gray Lab values and the channel name Auto is added.
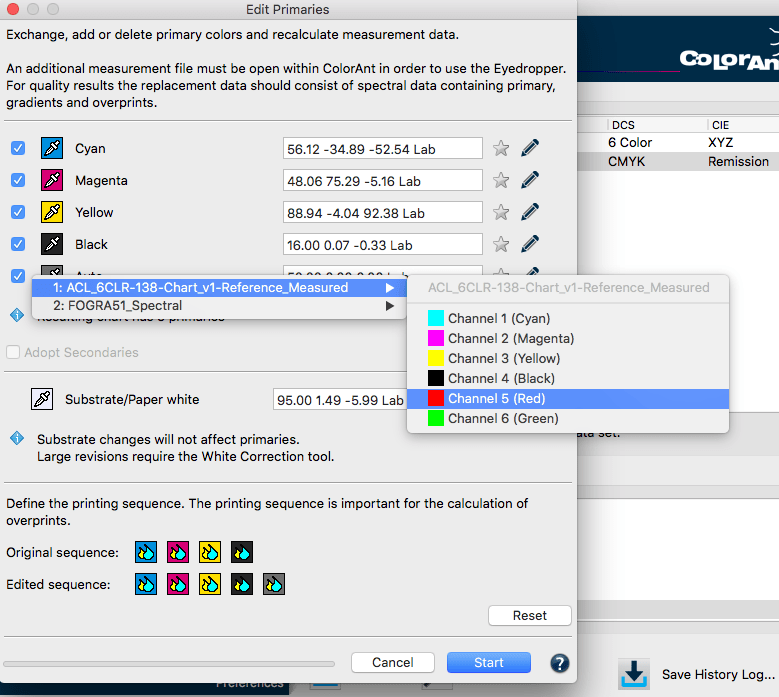
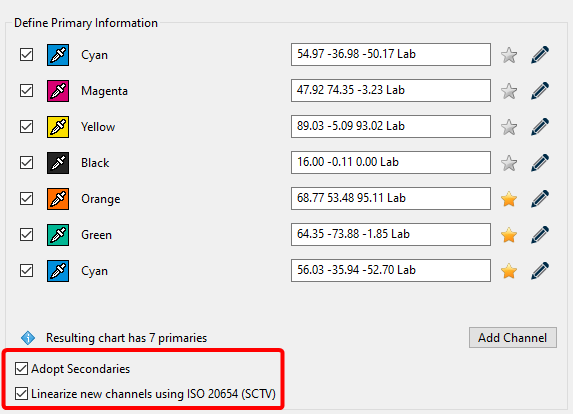
- Click on the Eyedropper icon of the new channel and select the new primary from another data set loaded in ColorAnt. Click on the channel to import the data. Fig 5.4 shows an example where a 5th Orange color has been added to an original CMYK data set. To rename the channel click on the Pencil icon and enter the new channel name. The new channel can be linearized according to the ISO 20654 (SCTV) standard by selecting the checkbox.
- Click OK to generate the new data set. To view the new data set, use the View tool and select the tabs 2D, 3D, Spider Web and TVI to verify all colors including overprints have been added. Additional edits can be made to the curves using the Tone Value tool.
Removing channels
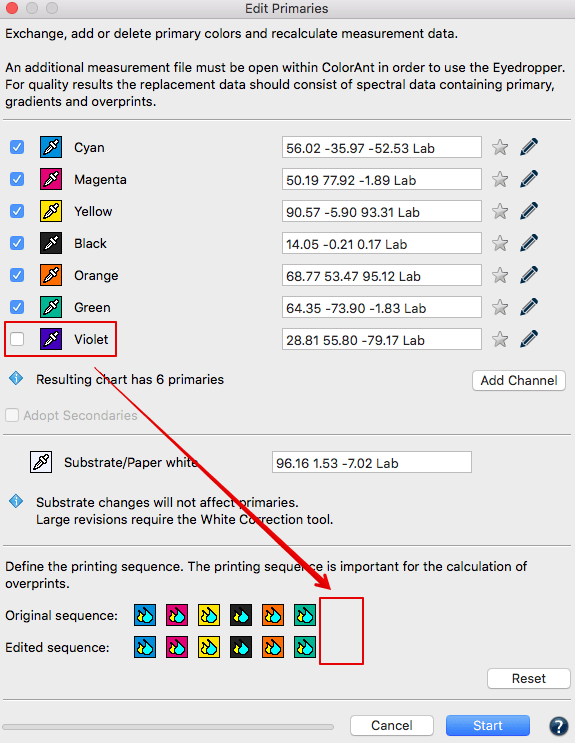
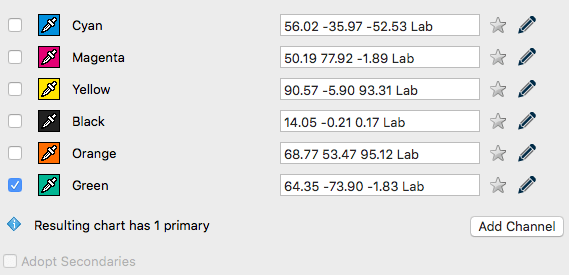
Load the measurement data of a test chart and click Edit Primary. Disable the check boxes in front of the channels that need to be deleted and click OK.The new data set will be reduced to the selected channels.
Color Editor
Edit color patches and process color conversions of spot colors.
Procedure
The Color Editor allows the user to edit patch names (Fig 5.5), Lab values or device color values (DCS).
Convert and optimize a complete spot color library to a target profile for RGB, CMYK or Multicolor.
To convert spot colors to a desired target profile, first load the spot colors into the ColorAnt Data Sets section, e.g., a Pantone spot color library (or any supported file format such as CxF), then click on Color Editor.
The window contains a table on the left showing all spot colors of the file and editing options on the right.
Select an ICC Profile from the drop-down list and a calculation Mode.
Six modes are available:
- Precise Match - Proofing
- Visual Match - Utilize More Channels
- Use the Least Amount of Channels
- Use one Output Channel only
- Use a Maximum of two Channels
- Use a Maximum of three Channels
The preset dE Limit highlights colors that exceed the defined threshold.
If a color is selected from the table, the device color values for each channel of the selected profile are shown under Optimize Destination Values.
As a default, the device values calculated via the ICC profile are shown without any optimization. By clicking on dE76 or dE00 the deltaE can be minimized (Fig 5.6) for each color.
Clicking on Automatic applies the selected calculation Mode which typically results in a reduced amount of channels for better printability.
Users can optimize each individual color and can even enter device values manually. By clicking on Start, the entire list of colors is generated in the Data Sets section including the calculated and possibly optimized device color values.
The values can be saved for further usage in other applications in any format supported by ColorAnt (CGATS TXT and XML, CXF3, Photoshop ASE and ACO, named color ICC profile or GMG CSC).