Iterate Spot Colors
Spot Color Iteration is a process that involves printing of the spot colors converted from ZePrA on the printer to be used for the print job, followed by measuring test charts and optimizing the color differences (expressed in deltaE2000) until the measured deltaE values are within the desired tolerances. Printing the test chart and applying the Iterate Spot Colors feature once only already results in an improved spot color rendering which is usually close to the optimum of this printer.
Why can spot color iteration be required?
First of all, be assured that ZePrA already calculates the best possible spot color conversion based on the target profile set under Configuration/Target Color Space. However, printers, inks and papers drift over time so that there are always some deviations from the state the printer was profiled. During spot color iteration we measure how converted spot colors are actually printed in the current state, and subsequently optimize the deltaE2000 values. The iteration report shows which colors are improved and where restrictions based on the color gamut or the spot color Calculation Method occur so they can’t be optimized further or if additional iteration steps are recommendable.
Procedure
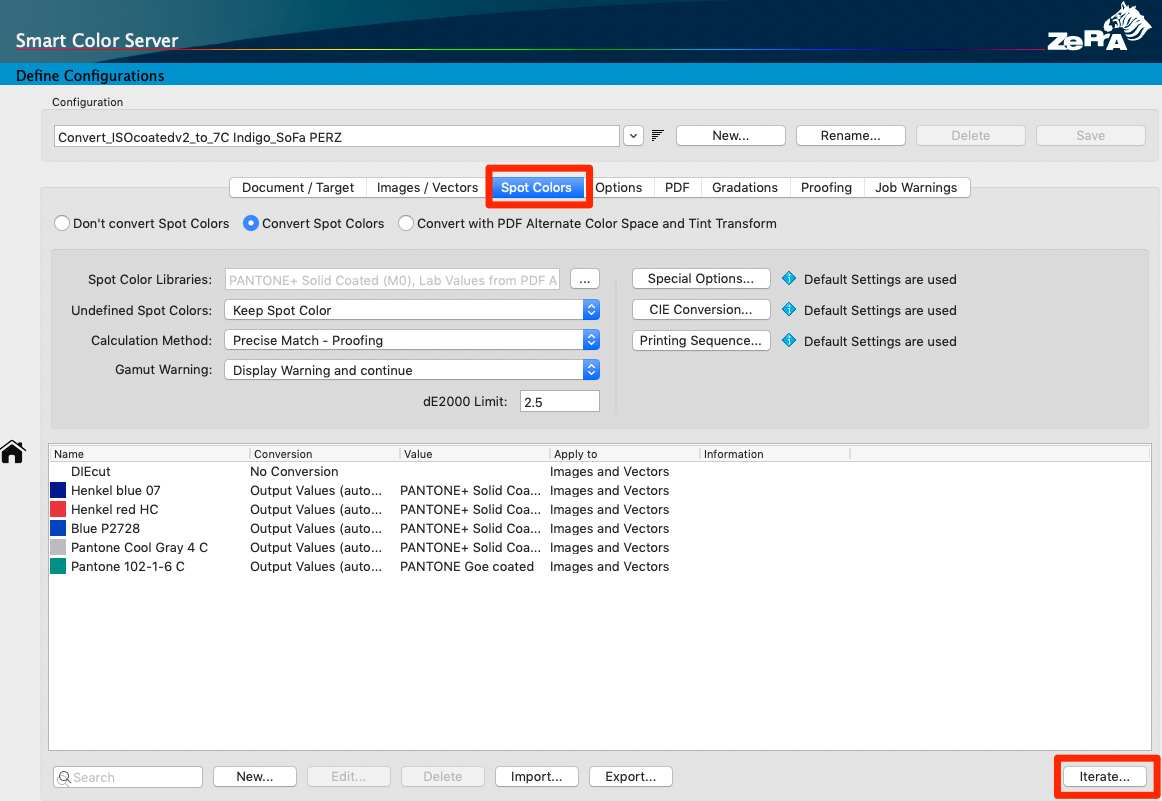
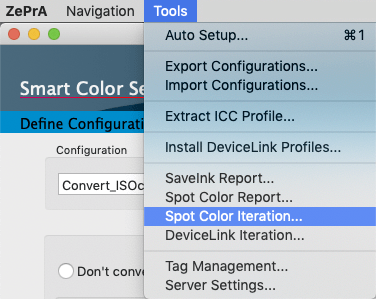
Open the Spot Color Iteration Wizard, either from:
- The Spot Colors tab under Configurations (Configurations > Spot Colors > Iterate at the bottom of the window).
- The Tools menu (Tools > Spot Color Iteration).
- Alternatively, if a job with spot colors has been converted via a queue and the associated configuration is set to Convert Spot Colors, the Spot Color Iteration Wizard can be started by right-clicking on this job in the Processed Jobs section of the Overview window and selecting Spot Color Iteration.

Note: A spot color module license is required to use the tool.
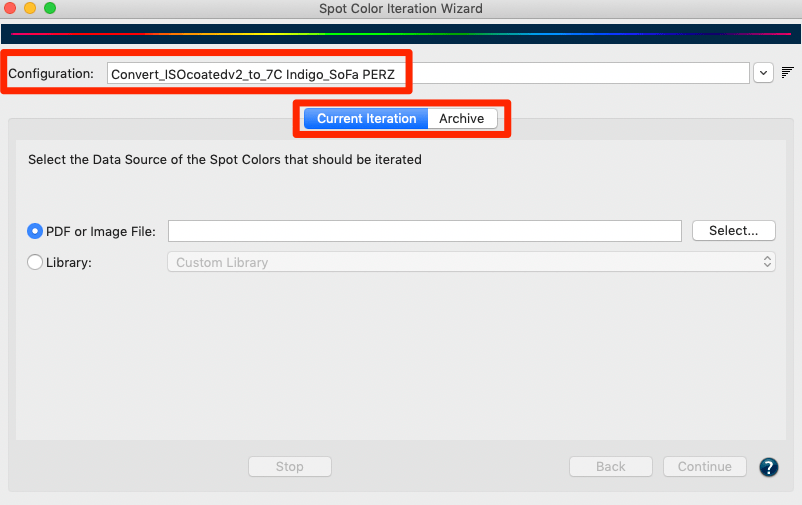
The Spot Color Iteration Wizard dialog consists of two tabs, the Current Iteration and the Archive tabs. The Current Iteration tab contains the actual iteration wizard and typically, if a configuration is selected that has not yet been iterated, the wizard is started directly there. The Archive tab contains all the iteration steps that have been carried out, including all the evaluation details.
The wizard guides the user through the iteration process in seven steps:
Step 1: First, select the Configuration you would like to use for printing. The option Convert Spot Colors must be enabled in this configuration.
Notes: When the Spot Color Iteration Wizard is started via Processed Jobs of the Overview, the Configuration is already preselected.
The best approach for the iteration of spot colors is to set the Calculation Method to Precise Match or Visual Match in the respective Configuration.
The setting Use the least Amount of Channels may be insufficient for iterating spot colors. Importantly, spot color iteration will not work when the spot color conversion is set to Convert using Alternate Color Space from PDF.
Step 2: Select the source of the spot colors you would like to optimize. You can either choose a PDF or Image File with spot colors or an entire spot color Library.
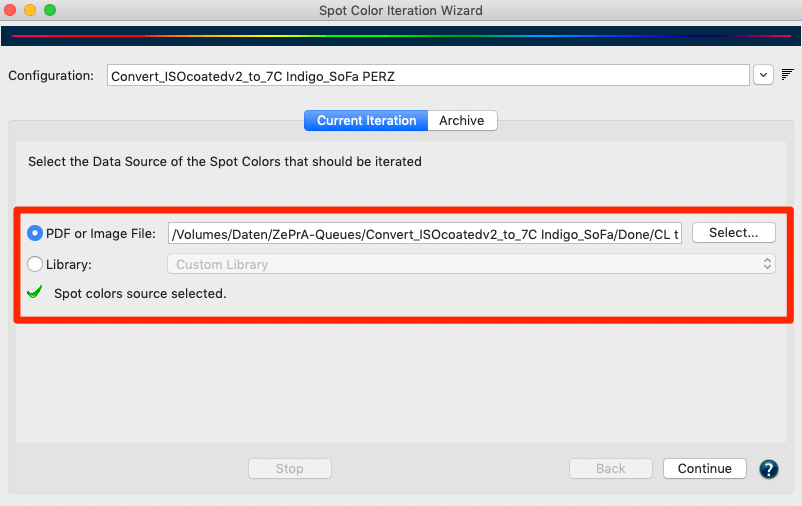
Note: When the Spot Color Iteration Wizard is started via Processed Jobs of the Overview, the Job (PDF or image file) is already preselected.
Step 3: Select one or more spot colors for iteration. All spot colors of the job, PDF or image file will be automatically extracted and displayed. Disable the colors that are not to be iterated. By default all spot colors are preselected.
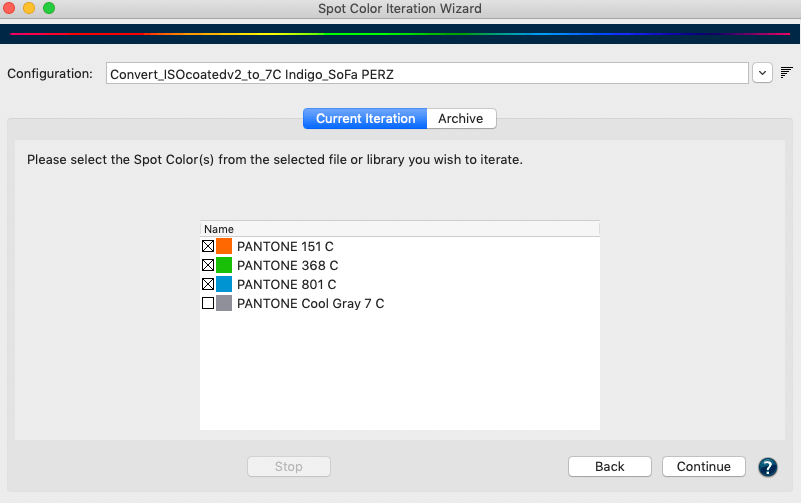
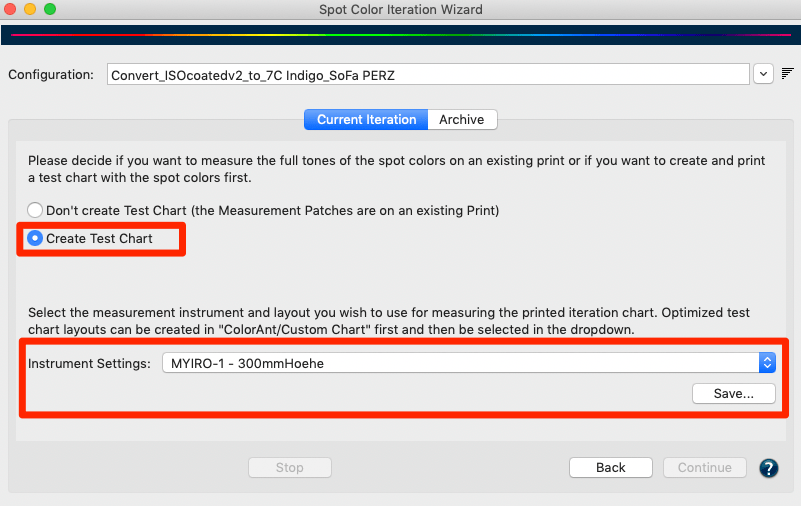
Step 4: Choose to Create a Test Chart or to measure the full tones of spot colors from an existing print (Don’t create Test Chart).
Create a Test Chart: Creates a test chart with the spot colors selected in the previous step. Select an Instrument Setting and click on Save to enable the Continue button.
Don’t create Test Chart: Some prints contain control patches of spot colors that can be used for measuring. Larger areas in the design that contain the 100% tone of a spot color can also be used.
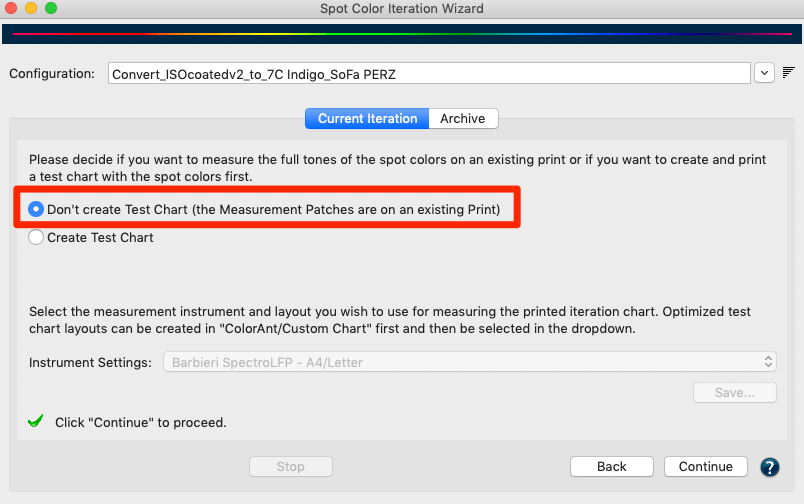
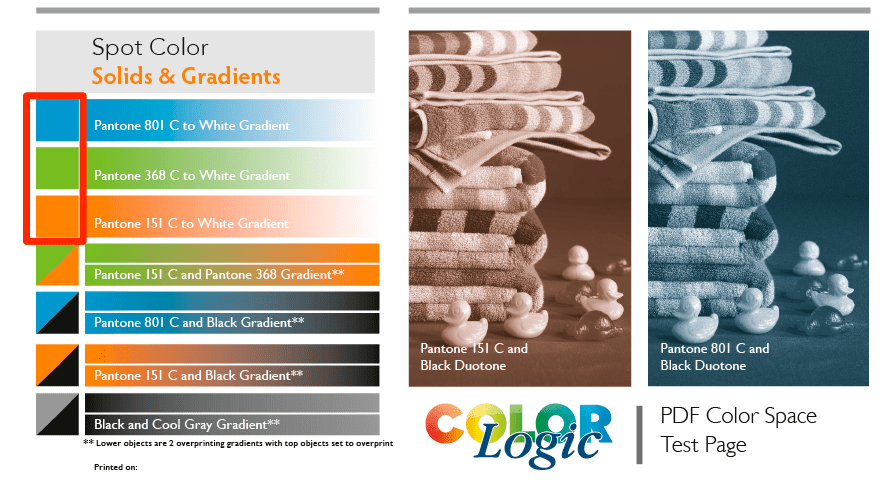
Note: The test chart contains the converted spot colors as given in the Configuration using the conversion settings and Calculation Method defined in the tab Spot Colors.
Step 5: Measure the printed spot colors. When using the test chart, it must be printed on the printer without any color management and can be measured after drying.
Measure: Starts the Measure Tool. You do not need to worry about the reference file and layout, as this is already preselected within the Measure Tool. Instructions on how to select your device and make measurements can be found under Measure.
Load: If you have created a test chart you can use the associated exported reference file and measure your printed chart with a different measurement tool. Make sure that the measurements are saved in standard file formats that can be read by ZePrA, such as CGATS TXT, XML or CXF3. The external measurement files can be loaded using the Load button.
Once the measurement data has been transmitted from Measure Tool or loaded from external sources, and it conforms to the printed chart which is indicated by a green check mark, you can proceed by clicking Continue.
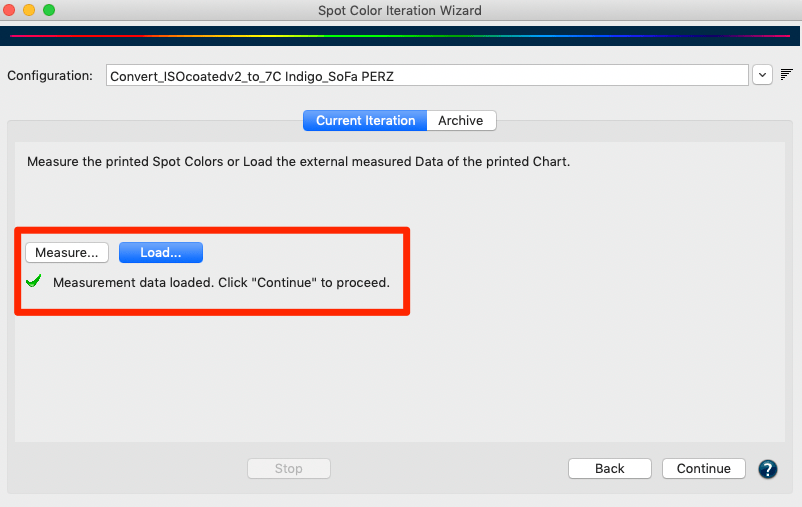
Note: When loading measurement data that does not match the chart layout or the corresponding patches in the reference file, you are alerted by a warning message and cannot proceed to the next step.
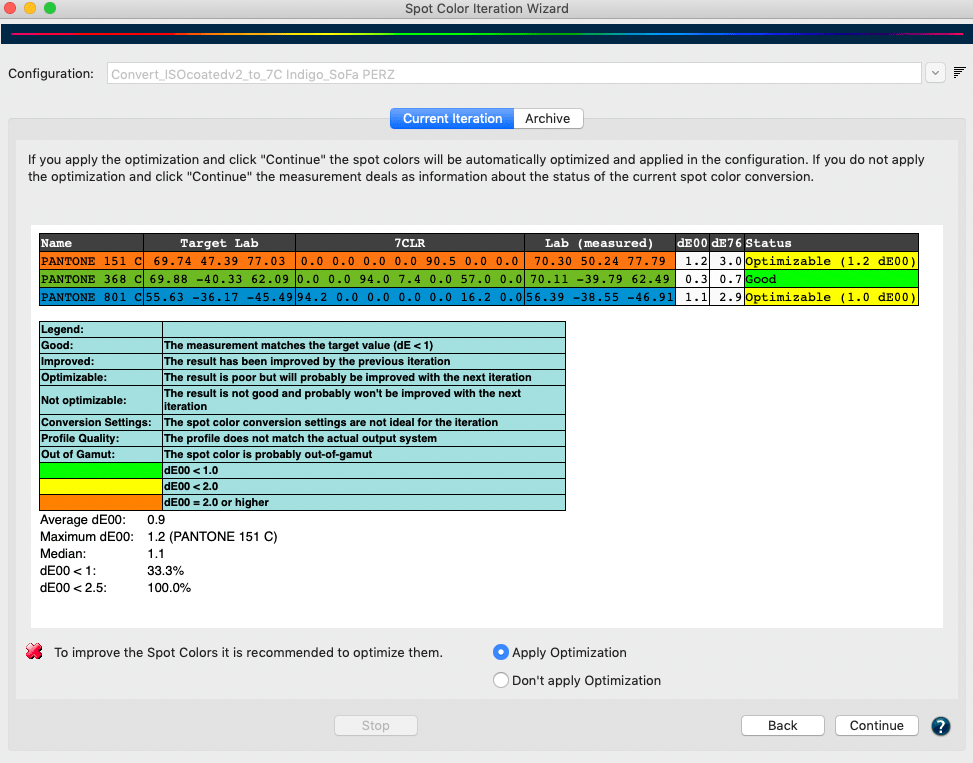
Step 6: The evaluation results of the measurements of each spot color are displayed in comparison to the reference Lab values of the original spot colors. In addition to the DeltaE2000 (dE00) and DeltaE76 values, a Status information text is also displayed, either in green, yellow or orange. The Legend below the table explains the indication colors and status information.

Green: The spot color match is less than 1 dE00 and a perfect match is achieved. Further optimization is then no longer required.
Yellow: The spot color match is less than 2 dE00 but higher than 1 dE00 and the Status column indicates that the match can further be improved.
Orange: The spot color has a higher deviation than 2 dE00 and the Status column indicates that the match can further be improved.
If a color is not optimizable or out-of-gamut, it can not be improved which is indicated in the Status information column, too.
ZePrA preselects one of the two options (Apply Optimization or Don’t apply Optimization) depending on the evaluation results. However, the preselection can be overridden and another iteration cycle can be applied if the results are to be improved even further. To do this, select the Apply Optimization radio button and click Continue. Alternatively, if you just need the measurements for evaluation select the Don’t apply Optimization radio button.
Step 7: The concluding step of the iteration cycle contains three options and a checkbox to choose from. Based on the previous results, the wizard already preselects a logical option for you to follow:
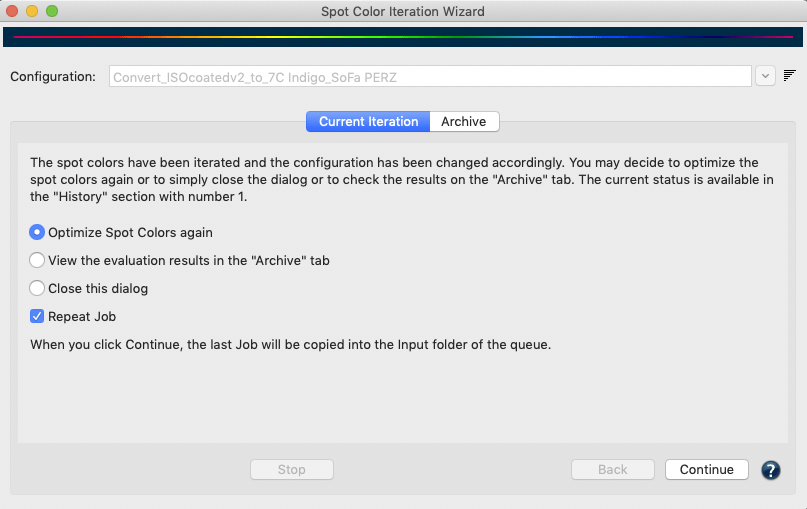
- Optimize Spot Colors again: Runs another iteration cycle, for example, to check whether a previously iterated spot color successfully passes the evaluation. If you select this radio button and click Continue, a new iteration cycle starts with step 1 and the selection of the spot colors to be optimized.
- View the evaluation results in the Archive tab: If you have already completed several iterations or would like to see the evaluation results once more, select this option. When you click Continue, the Archive tab opens.
- Close this dialog: If the evaluation results are fine or if you want to end the iteration process you can simply select Close this dialog and by clicking Continue the iteration is ended.
The checkbox Repeat Job works independently from the three radio buttons. If it is enabled when clicking Continue the last job is converted again with the configuration. This is especially helpful if the spot colors of that last job have been optimized by the wizard which in turn optimizes the spot color settings in the configuration to improve the spot color rendering.
You will find the optimized device values (Output values) in the table of the tab Spot Colors under Configuration. They will be marked as Iterated in the column Information of the table.
Archive
All data created during the iteration – such as test charts, reference data and measurement data, as well as the report – are stored in an internal database in addition to the save location defined by the user.
Therefore, if data is deleted from the save location it can still be restored from the internal database any time via the Archive tab. Users can stop an iteration process and even close the Spot Color Iteration Wizard dialog at any time and can revert back to the last completed step with the help of the information stored in the Archive.
The Archive tab shows all iteration steps and evaluation details. The History table contains a list of all iterations. More information for the selected iteration step is displayed under Details.
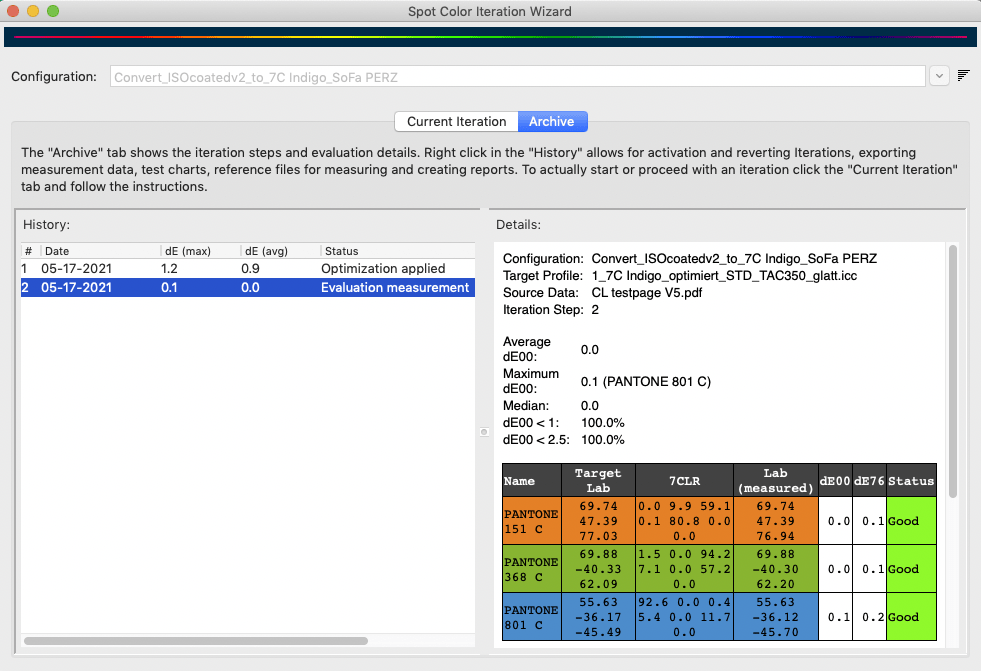
The columns of the History table show the iteration step number #, the maximum DeltaE00 value dE00 (max), the average DeltaE00 value dE00 (avg), the Status of the selected iteration step. It also shows some Information about the iteration process itself, such as Optimization applied, when the measurements done from the printed test chart have actually been used to iterate a spot color, or Evaluation measurement, when the measurements have been used for evaluation only and have not been used to iterate a spot color.
In addition, the iteration process (being performed in the Current Iteration tab) can be discontinued, which is indicated with various messages such as Next step: save chart, Next step: measure or load data, Next step: Evaluate.
Right clicking on an iteration step in the History displays a context menu with the following options:

Save Chart: Exports the test chart into a file selected by the user. The test chart is not newly created but only copied from the internal database. This implies that the file selection only supports the file type initially chosen by the user.
Save Reference Data: Exports the reference data that belongs to the test chart into a file selected by the user.
Save Measurement Data: Exports the measurement data into a file selected by the user.
Save Report: Saves a report containing all Details displayed on the right and the full information about each spot color. This is useful to identify colors with the highest or lowest deltaE values, or colors which are out of gamut. The report is explained in more detail below.
Revert to state before: This is only available for iterations with the status applied. Reverts back to the state before this iteration, giving the previous iteration, if any, the applied state. The status changes to evaluation measurement. All subsequent items are deleted.
Revert to state after: This is only available for iterations with the status applied. Proceeds to the state after this iteration step, making it the active iteration. The status of a next iteration, if available, would be evaluation measurement. All subsequent items after the next iteration are deleted.
Apply Optimization: This is only available for iterations with the status evaluation measurement. It can be used for evaluation measurements that have not been applied in the iteration process itself. Use this option if you want to apply an iteration later on.
Evaluation Results
The Evaluation Results shown under Details are always the evaluations of the previous step. This means, if an iteration has been applied in step 1, the evaluation results shown under Details for the selected step 1 are the values before the iteration has actually been applied. Therefore, in order to see the results of the first iteration a second step is necessary. The evaluation results shown for that second step are actually the iteration results of the first iteration step, and so on. This offers the possibility to use the results of an iteration itself for a second iteration. But again, another measurement step is needed to find out if this iteration actually improved the result.
The Report
By right-clicking on an iteration step in the left table, a report can be created for this step which can be saved in various formats such as PDF, HTML, XML and TXT. The PDF and HTML formats are the most common versions for end users, while the other formats are more intended for automation and usage in other systems such as a MIS (Management Information System). The following is a description of the PDF report.
The Report contains all information about the spot color Name, the device values generated by ZePrA (displayed in the color space of the target profile) and the measured Lab values as well as the dE2000 and dE76 deviations from the reference Lab values of the spot color and the Status. Under Status it is displayed whether the respective spot color has been well matched (less than 1 deltaE2000) and whether it can still be optimized. If the match of a spot color is smaller than 2 dE00 but larger than 1 dE00 and the match can be further improved, then it is displayed in yellow in the Status column. Finally, spot colors with a deviation higher than 2 dE00 will be highlighted in orange. If a color cannot be optimized or is out-of-gamut, it cannot be improved, which is also displayed in the Status information. The Legend below the table explains additional information messages that can be displayed.
Video Tutorial: Spot Color Iteration Wizard

