ColorAnt | Evaluate
Evaluate – Proof Evaluation
The Evaluate tool can be used to check whether the proof measurement data from a media wedge fulfills the requirements for a contract proof according to ISO 12647-7 or a validation print according to ISO 12647-8.
In addition, a PSD evaluation can be performed using two different evaluation methods: “Side-by-Side” or “Media Relative”.
Moreover, the Evaluation Method G7 gray balance allows the measurement data to be checked for G7® conformity.
Finally, a fully detailed report can be created with a pass/fail indicator.
Notes
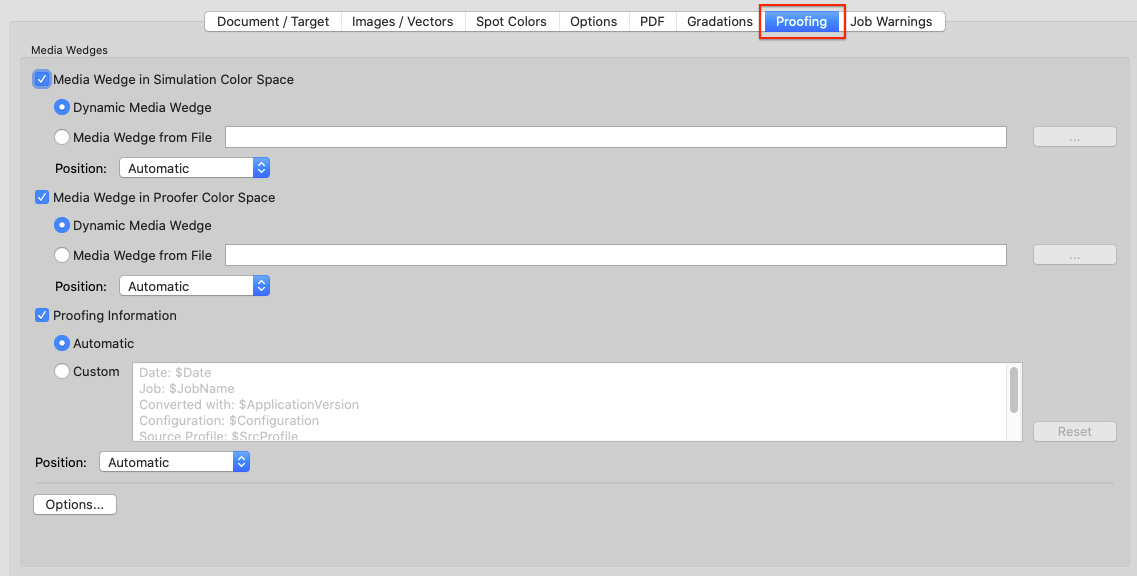
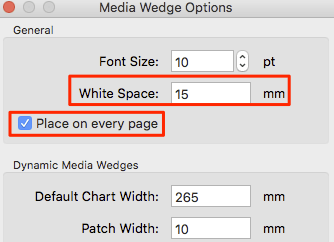
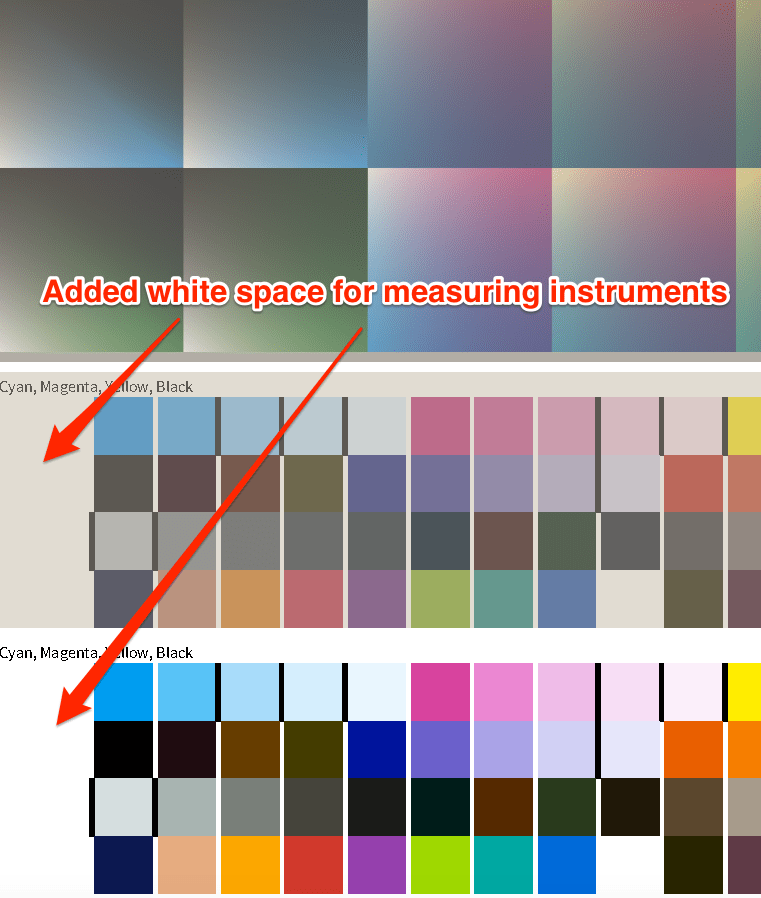
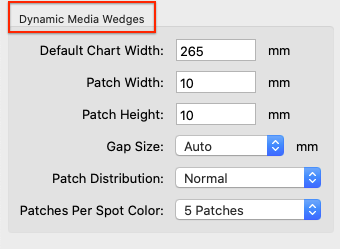
- The Proof Evaluate tool supports all color spaces including Multicolor and spot colors. It is a powerful addition to ZePrA’s proofing feature, as it allows you to use the reference files of the dynamic media wedges created by ZePrA for proof evaluation.
- For redundant measurement values, the median is determined and all duplicates (i.e., all patches with identical DCS values) are removed before evaluation.
This procedure prevents duplicates as well as outliers from unjustifiably influencing the proof evaluations. - The Evaluate tool supports all color spaces as either reference data or reference ICC profile. In addition, it checks whether the selected wedge is actually suitable for evaluation and displays a corresponding message.
- The Evaluate tool is available from ColorAnt L.
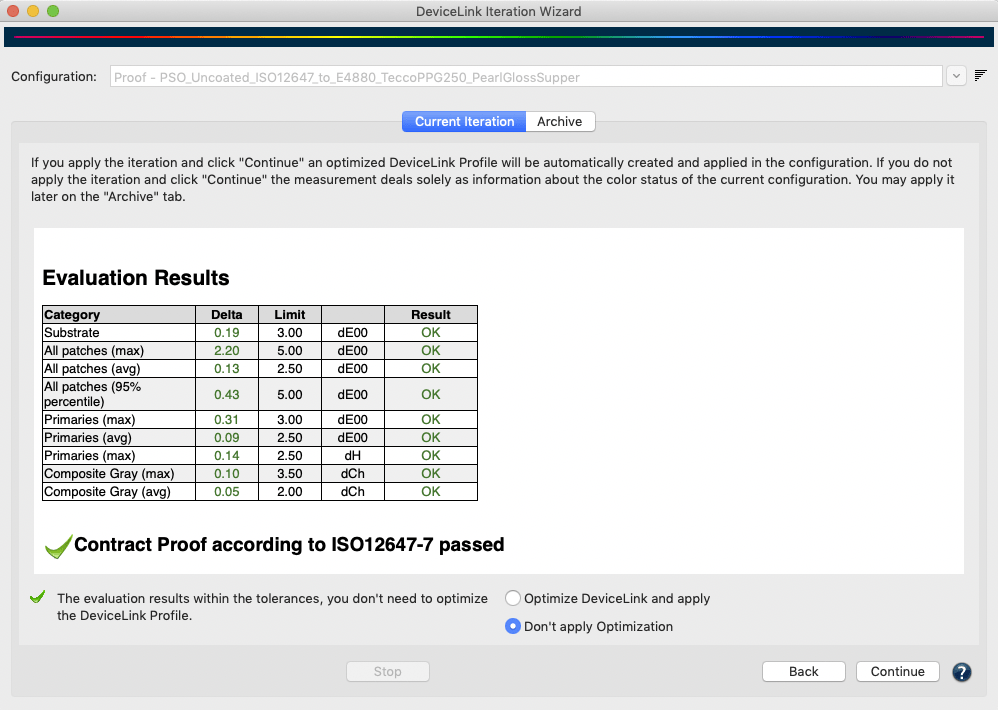
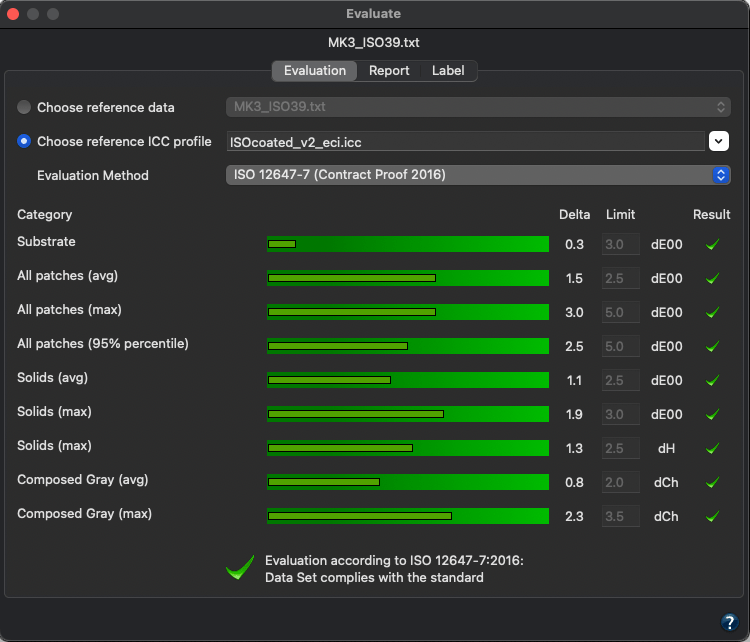
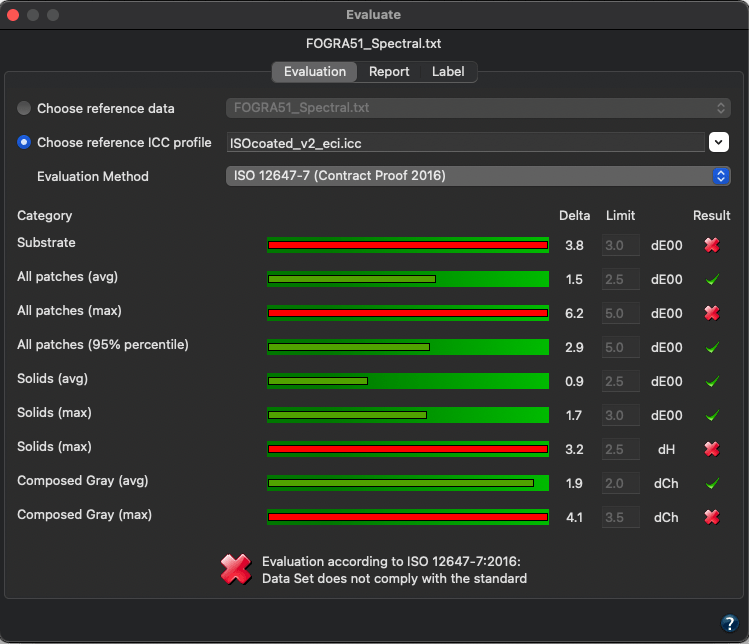
The Evaluation tab immediately shows the categories related to the chosen standard, the deltas to the reference, and a score with either a ✓ (passed) or an ✕(failed).
An overall score indicates if the proof has passed or failed.
There are two ways of selecting your reference:
- Choose reference data: This drop-down menu contains all data loaded under Data Sets that fit the selected proof measurement data as a reference, which means the number of patches and the color space must match. Select the reference that you want to compare with the selected media wedge measurement data. If dynamic media wedges were used in ZePrA, the corresponding reference data can be used for the proof evaluation in ColorAnt.
Using reference data from ZePrA:
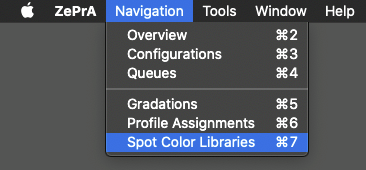
1. Open the reference file of the ZePrA configuration in ColorAnt. It is located in ZePrA’s Report folder of the corresponding queue.
2. Select Measure to measure the media wedge in the proof printout
3. Open the resulting measurement file and click the Evaluate button.
4. Select the original reference file from ZePrA under Choose reference data in the Proof Evaluation window. - Choose reference ICC profile: This drop-down menu contains all ICC profiles that fit the selected proof measurement data as reference in terms of the same color space. Choose the reference ICC profile that you want to compare with the selected media wedge measurement data.
Note: The ICC profile is used to create virtual reference values (absolute colorimetric). Depending on the accuracy of the ICC profile, the quality of the reference data can vary from very exact (e.g., CMYK profiles created by CoPrA) to less exact (e.g., small Multicolor profiles).
Evaluation method: Select a method to either evaluate a Contract Proof according to the ISO 12647-7 standard, a Validation Print according to the ISO 12647-8 standard, to evaluate your data according to Fogra’s PSD standard (ProcessStandard Digital), or to check the measurement data for G7® conformity. The PSD standard is based on the tolerances defined by Fogra and provides guidelines to increase process stability in digital printing. Further information can be found on the Fogra website.

ISO 12647-7 (Contract Proof 2016): For the evaluation of a binding contract proof use this method.
ISO 12647-8 (Validation Print 2021): Checks the conformance of printing systems that produce a hard-copy validation print, directly from digital data, which is intended to simulate the expected appearance of material printed per a characterized printing condition. The method considers the latest tolerances published in 2021.
G7 gray balance: This method checks the measurement data for G7® conformity to ensure accurate and consistent color reproduction. G7® is an internationally recognized method for calibrating printing presses and proofing systems.
Notes
- Recently, other visualizations of the final printed product have found a place in the printing/proofing workflow because designers and print buyers prefer not to go to the expense of using an ISO 12647-7 compliant contract proof any earlier in the process than necessary. In many situations, participants in the workflow require a hardcopy visual reference of lesser quality than a contract proof. In the past, those prints varied widely in quality and were often referred to as design proofs, concept proofs, layout prints, etc. That quality level is here being referred to as a validation print.
- The All Patches ratings do not include Boundary Patches for wedge evaluations.
- Wedge evaluation: For small charts with less than 150 patches, such as Media Wedges, all Boundary Patches are omitted.
- Chart evaluation: For larger charts with more than 150 patches, such as the IT-8, the Boundary Patches are taken into account.
PSD Evaluation
The PSD reflects the different customer requirements for the degree of color match with three different quality levels, the quality types A, B and C. Here, A represents a better approximation than B, which in turn is better than C. The overall rating depends on the lowest rated Category. If a value exceeds the tolerance limit, a red X indicates that the evaluation has failed. Quality types A to C thus indicate that all values are within the respective tolerances and that the evaluation has passed (shown in shades of green).
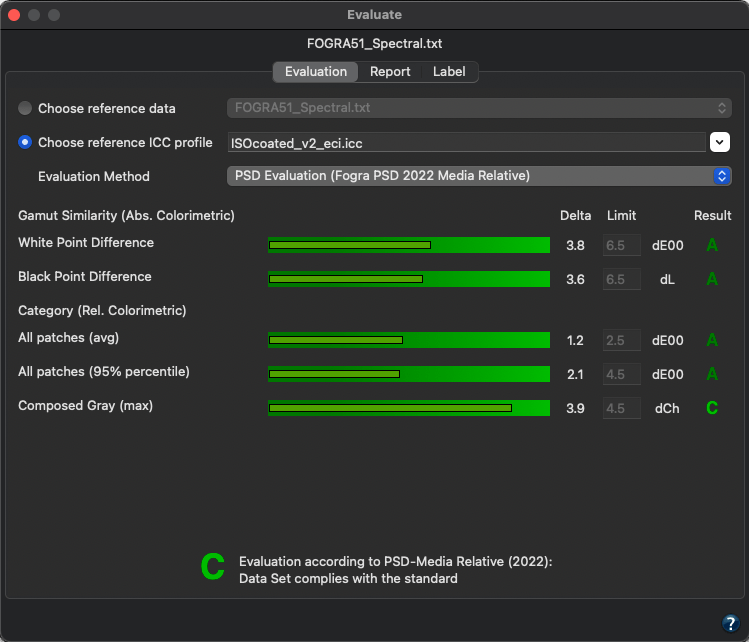
This gradual evaluation of the quality with regard to color reproduction can be achieved with two different evaluation methods: Side-by-Side or Media Relative.
PSD Evaluation (FOGRA PSD 2022 Side-by-Side): Side-by-side is a long-established method based on simultaneous and immediately adjacent color matching. The deviation tolerances apply to the comparison of the target values, defined by the color reference, and the measured values of the OK sheet.

From the Fogra PSD Handbook: Deviation tolerances for Side-by-Side reproductions. Version: PSD 2022

From the Fogra PSD Handbook: CIEDE2000 tolerances for spot colors. Version: PSD 2022
PSD Evaluation (FOGRA PSD 2022 Media Relative): The media-relative evaluation consists of two steps. First, the similarity between the reference and the current output color gamut is checked using the white and black points. A similarity is mandatory to perform the colorimetric evaluation in the second step.

From the Fogra PSD Handbook: CIELAB tolerances for gamut differences to check if media-relative is applicable. The color differences for the white color are very similar when using ΔE ab or CIEDE2000. The CIEDE2000 tolerances shall take precedence. CIELAB 1976 color differences are given in brackets. Version: PSD 2022
The calculation of the media-relative CIELAB color values only takes place if the criteria specified for the first step are met. They are the starting point for the final color evaluation based on all control patches in the second step.

From the Fogra PSD Handbook: Deviation tolerances for media-relative reproductions. Version: PSD 2022
Note: Reliable results can only be achieved with absolute colorimetric measurement data, so please do not use relative or scaled (e.g., converted with perceptual rendering intent) measurement data.
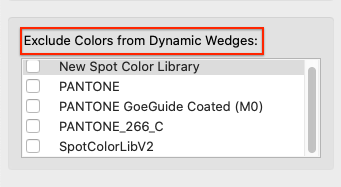
Specify spot colors: When evaluating Multicolor measurement data, the additional colors can be evaluated as process colors or as spot colors. In most cases, with typical Multicolor media wedges, all colors are process colors, but with ZePrA-created dynamic media wedges, additional spot colors may also be included in the file.
Specify spot colors opens a dialog where you can define whether a color is included in the selected Evaluation Method calculation as a Process color or as a Spot color.
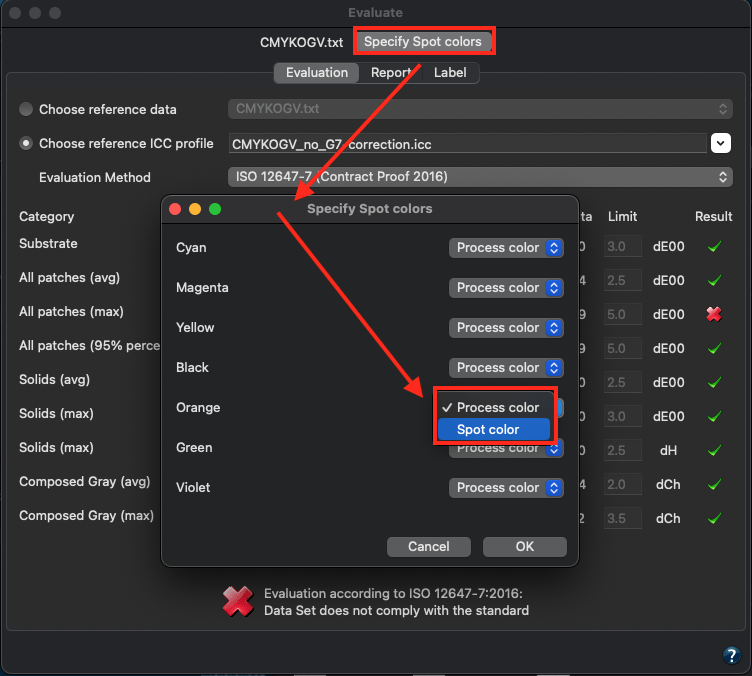
By default, all channels of Multicolor data are defined as process colors and included in the evaluation All Patches.
However, if spot colors are present and should not be treated as process colors, e.g., in the case of dynamic media wedges in ZePrA, they can be defined as spot colors. In this case, they are not included in the All Patches evaluation, but are evaluated separately and displayed in a separate Spot color evaluation line.
Note: The button for the Specify spot colors dialog is shown for Multicolor data only.
Report
The available input fields depend on the selected Evaluation method. Enter the required information according to the selected ISO standard.
Save Report: Saves the report in the location and format (PDF, HTML, XML) specified in Settings.
The report contains all the information that you have entered, the summary from the evaluation dialog, a list of all patches with their names or IDs, the device color space, the Lab reference values, the Lab measurement value and the delta.
Label
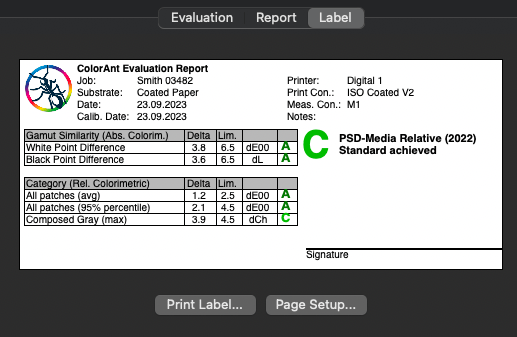
Allows you to print a label with the evaluation results directly from within ColorAnt. The tab shows a preview of the label to be printed. The label contains the data entered in the Report tab and a table with the data from the Evaluation tab. It also indicates if the print is Accepted or if the evaluation has failed (X) and provides space for a signature.
Note: The label layout is optimized for DYMO 99012 labels (format 89mm x 36mm). For other formats, adjustments may be necessary to achieve optimum results.
Video Tutorial
How to Use the Proof Evaluation Tool in ColorAnt in combination with ZePrA
Learn step-by-step how to use the Proof Evaluation tool in ColorAnt for the evaluation of a proofing media wedge created with ZePrA. In this example, we will be demonstrating the special feature of ZePrA to create a dynamic media wedge using process and spot colors and how to use the supplied reference data from ZePrA for evaluation of a Contract Proof.


