

Spot Color Report
Overview
The spot color report shows the results achieved with a spot color conversion in relation to deltaE00, deltaE76, and the separation into process colors. This allows the accuracy of spot color conversions to be checked before processing or printing, and to determine in advance how ZePrA converts spot colors (e.g., Pantone® or other spot colors).
Procedure
- Open the Spot Color Report from the Tools menu.

- Configurations: Select one or more configurations from the list which contain all settings for the conversion. Only Configurations which have the option Convert Spot Colors enabled are displayed in the list.
- Select a single PDF or image file, a spot color library or multiple files under Source Data.
PDF or Image File: Select the PDF or pixel image file with spot colors to be processed using the settings of the selected configuration.
Library: Select the spot color library to be converted using the settings of the selected configuration.
File List: Add multiple files which will be checked simultaneously. - Select the Sort order.
Sorts the list according to various criteria. When sorting by Delta E, spot colors with the lowest deltaE are listed at the top, and the highest deltaE at the bottom. - Create the report. It can be created in various formats (see below).
Save: Creates the spot color report and saves it. Optionally, a Preview can be created beforehand.
Supported file formats
The Spot Color Report can be saved in various formats:

- HTML
- XML (both legacy and new formats)
- Text
- CGATS
- CxF
- JSON
Note: Saving as CGATS text and Color Exchange Format (CxF) allows the file to be opened in external tools such as ColorAnt. This way, the device values (DCS) after optimization by ZePrA and the resulting Lab values can be examined. The Lab values of the spot colors in this file reflect the actual achievable Lab values resulting from the conversion via ZePrA and may differ from the original Lab values (due to out-of-gamut or other limitations).
The two file formats JSON Files and XML Files at the bottom of the list are optimized for machine reading and are best for use by external systems to extract data for reports.
Note: The XML (legacy format) option is only available for downwards compatibility to older ZePrA systems.
Best Configuration: Automatically determines the Best Configuration to match the spot colors of one or several jobs from a list of selected configurations.
Note: The configuration with the highest Score is automatically determined as Best Configuration and listed on top of the report. The highest score is always achieved by the configuration with the lowest number of channels while maintaining an equal or slightly poorer colorimetric result (compared to configurations with target profiles that use more channels).
For example, if the spot colors of a job can be processed equally well with 7, 6 or 5 process colors on the same press, the configuration using 5 process colors is the best because it saves on inks and costs during production.
Overview: The Preview and the spot color PDF report show an Overview and a Best Configuration section that describes how the file(s) were processed with the various user-selectable configurations.
Score: Shows the percentage match of each tested configuration to achieve the spot colors of a job when converting spot colors to process colors (0% - no match, 100% - perfect match using a maximum of three process colors).
Note: The calculation of the Score considers the maximum dE00, the average value (Avg dE00) over all individual dE00s of the spot color conversions and the number of channels. The configuration achieving the highest score will be listed on top under Best Configuration.
The screenshot shows two files tested with four configurations. The Best Configuration section lists the configurations that achieve the best Score for each file.
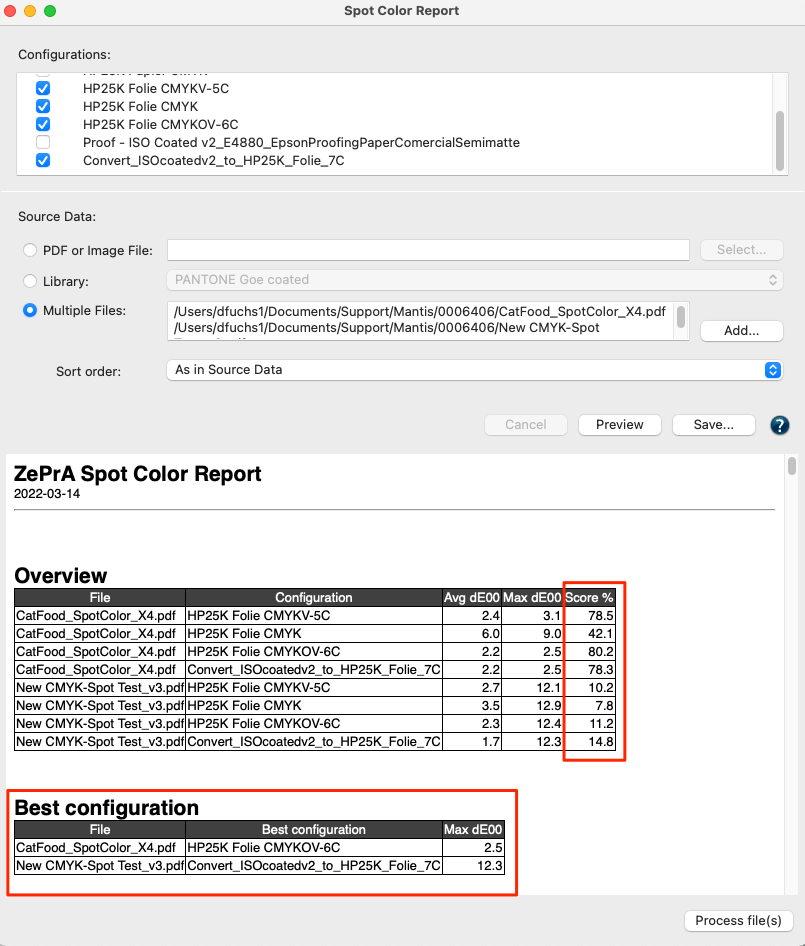
Process File(s): Selected files can be processed directly from the Spot Color Report window with the best configuration. The files are automatically moved to the Input folder of the corresponding configuration and automatically processed.
The spot color report shows the results achieved with a spot color conversion in relation to deltaE00, deltaE76, and the separation into process colors.
Note: When creating the report, all spot color settings made in the Configurations are used, including manual settings and warnings. Colors with warnings are displayed in red deltaE values.
If the Minimize Channel function is activated, the report lists all profile variants that are created in this configuration and the spot color conversion using these variants. Hence, this can become quite a long report, which can also take considerable time to calculate and create, especially if several configurations are to be checked.
A table of contents (TOC) in the PDF report file allows easy navigation to the details of each configuration. This is especially helpful in getting directly to the details of the individual configuration results if a spot color library has hundreds or even thousands of spot colors that have been evaluated.
Basically, the report is structured so that the analyzed files are listed at the top in the Details section. Underneath are the configurations used per file, followed by the profile variants and their details.
Features to streamline production
Instead of using a single configuration with the Minimize Output Channels function, several configurations can be set up, for example for printing with the same printer but using different target profiles with CMYK, 5 colors, 6 colors or 7 colors. Then the production PDF file(s) can be checked with all possible color configurations. It may be found that the production PDF file(s) do not need 7C, but are already well suited with a certain set of 5 colors or even CMYK.
This way, many clicks in digital printing or many plate productions in conventional printing could be saved. After checking the file(s) and determining the best matching configurations, the file(s) can be automatically processed with the configurations having the lowest maximum DeltaE directly from the Spot Color Report dialog.
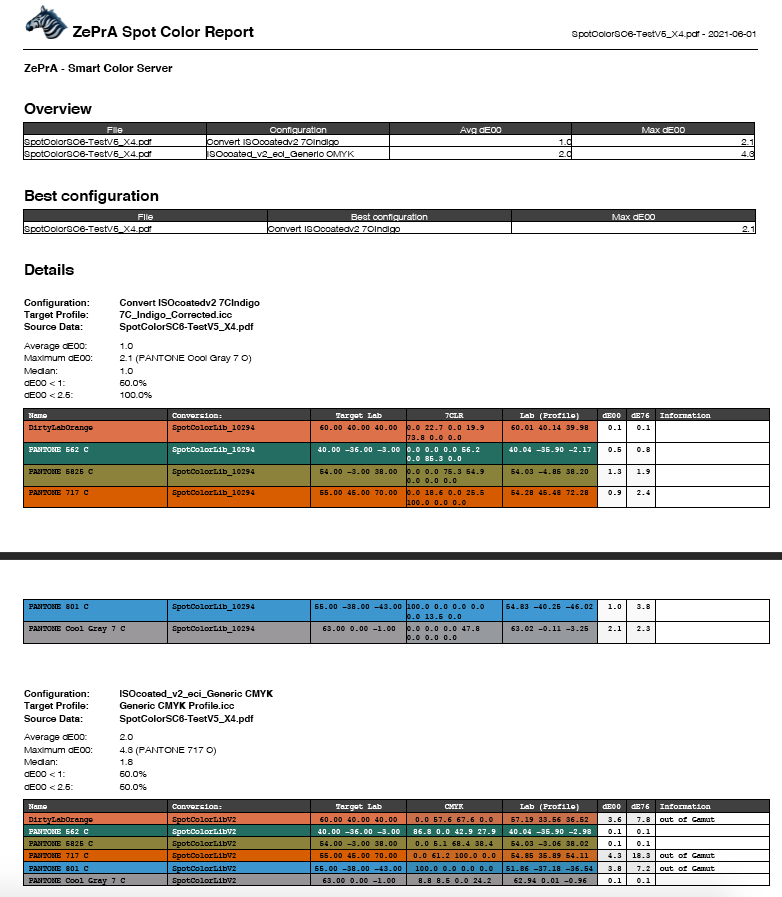
Spot Color Report Example: The screenshot shows the preview for processing spot colors with two different configurations. All spot colors found in the PDF file are included. One configuration uses a CMYK target profile and the other a 7C target profile. The report shows that in this case the 7C profile is much better suited for simulating the spot colors of the PDF file.
Spot Color Iteration
If spot colors have been iterated (see number 1 in the screenshot) the displayed Lab measurements and deltaE values (2) originate from the Spot Color Iteration process.

If a final evaluation measurement has been conducted, a single asterisk is shown in the Information column (2) and the corresponding information message (3) indicates that The Lab and dE values are based on the measurements of the Spot Color Iteration.
If no final evaluation measurement has been carried out, a message with two asterisks indicates that The Lab and dE values are based on the last applied Spot Color Iteration and may not match the actual print.