Profile Filter
Profile Filter: Offers various filters for searching profiles and a profile list showing all available profiles on your system.
Profile Filter
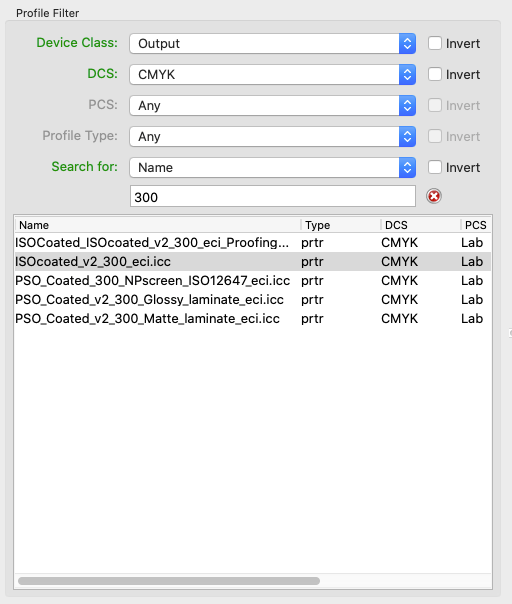
Filters for Searching Profiles
Using the four drop-down menus and the text input box narrows down the search to find profiles more quickly.
Device Class: Displays all profiles of a specific device class. You can exclusively display Input (scnr), Output (prtr), Monitor (mntr), DeviceLink (link), Color Space (spac), Abstract (abst) or Named (nmcl) profiles.
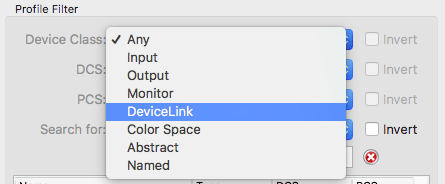
Choosing a Device Class
DCS and PCS: With DCS (Device Color Space) and PCS (Profile Connection Space) all profiles of a specific color space can be viewed.
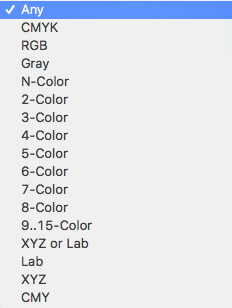
Select a color space
Profile Type: Limits the search to profile types. Returns fast search results, especially in combination with Search for file name.
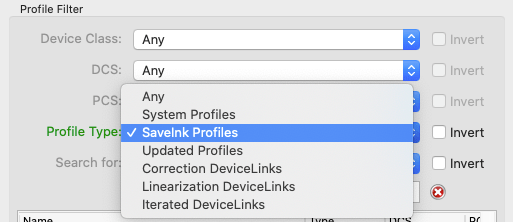
Choosing a Profile Type
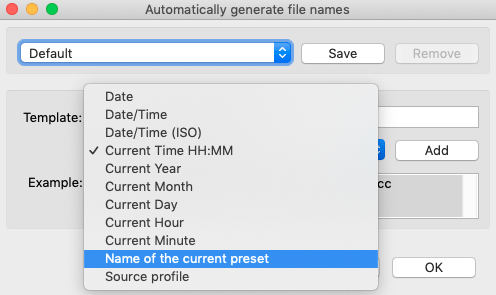
Search for: Enter a search term to search specifically for a particular text in the profile name. For example, by entering ‘preview’ all preview profiles are shown. Searching for Name, Manufacturer, Creator, Date, Notes, System Profiles, SaveInk Profiles, Updated Profiles or Correction DeviceLinks is also possible.
Note: Narrowing down the search to a specific date can be useful to display all profiles that have been created on a given day.
Invert: All filters and keywords can be inverted by clicking on the corresponding checkbox. For example, by selecting DeviceLink under Device Class, all DeviceLink profiles will be shown. By activating the checkbox Invert, all profiles except DeviceLink profiles will be shown.
A click on X resets all filters and displays all profiles.
Profile List
The list of available profiles is updated automatically every time Profile Manager is accessed (at program start or whenever it is brought to the foreground).
Context menu
A right-click on a profile opens a context menu. The following options are available (depending on the profile type and the licensed modules):
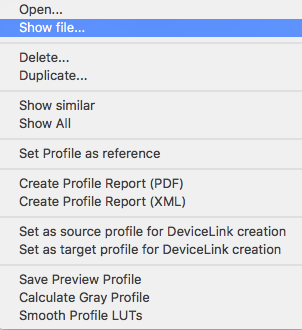
Right-click contextual menu options
The entries Create Profile Report (PDF)/(XML), Save Preview Profile, Calculate Gray Profile and Smooth Profile LUTs are only available if a valid license for the corresponding modules exists.
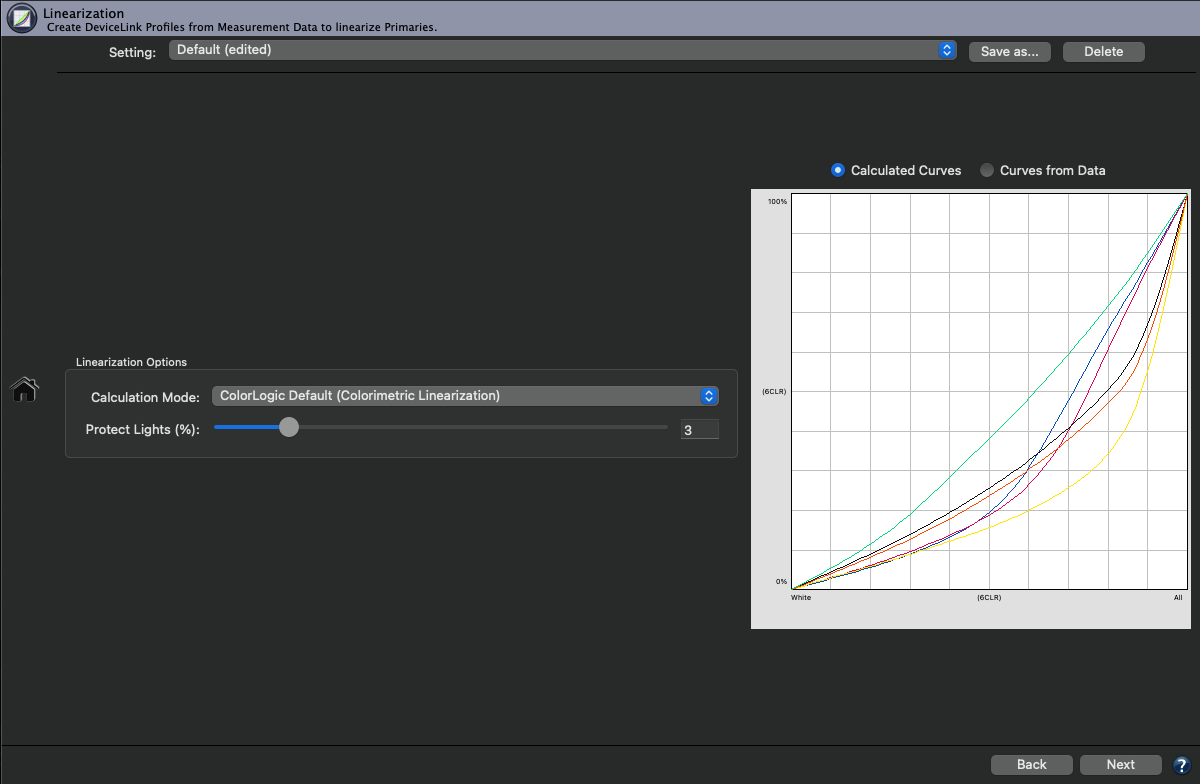
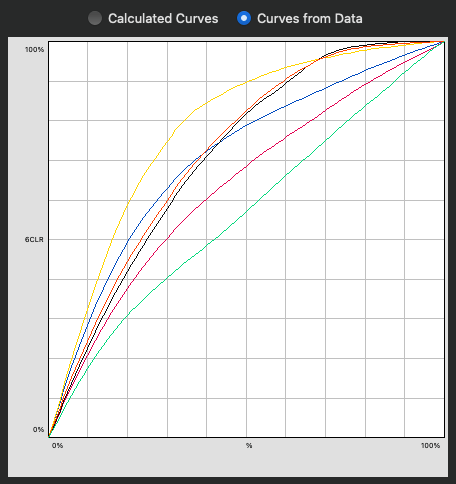
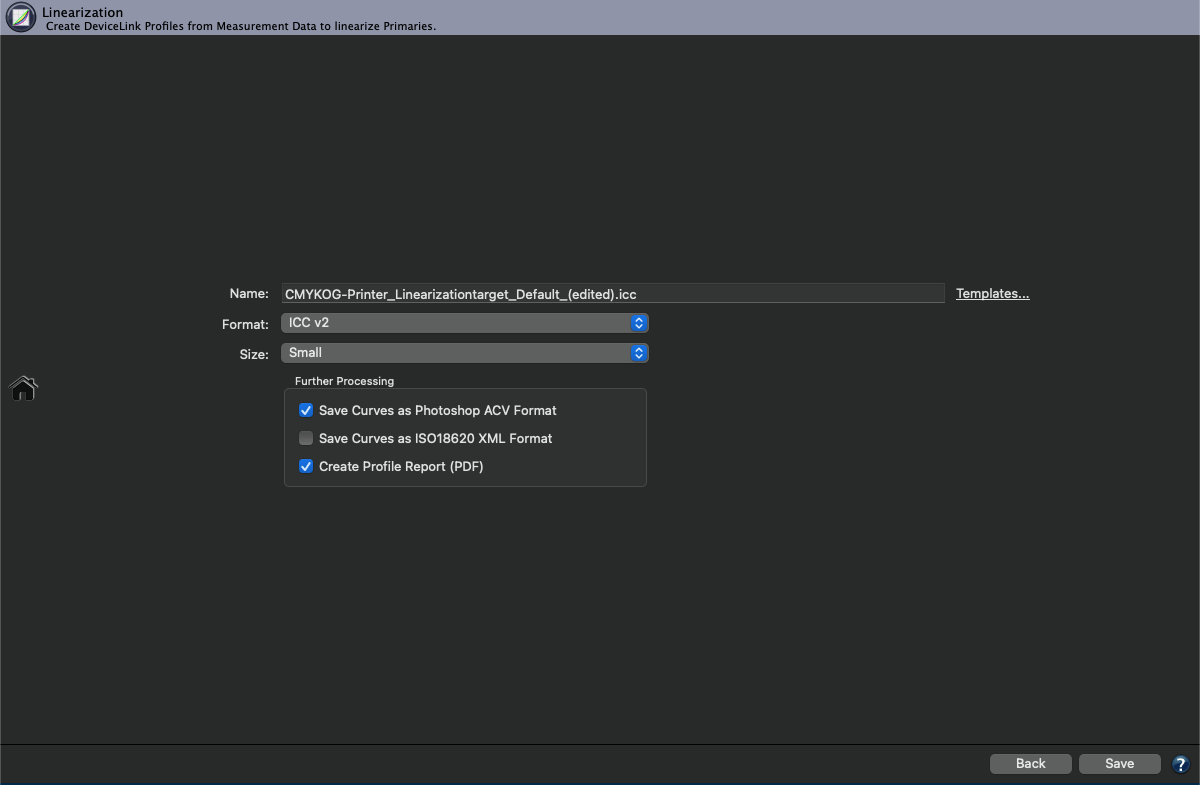
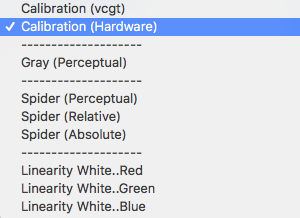
The context menu also allows you to create ACV or XML curves from a selected Linearization DeviceLink profile.
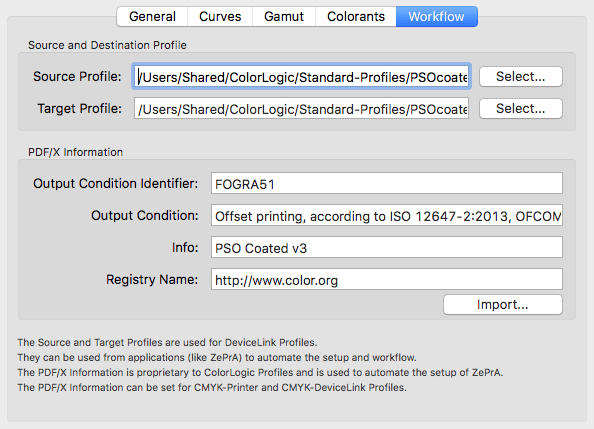
Extract source and target ICC printer profiles of DeviceLinks
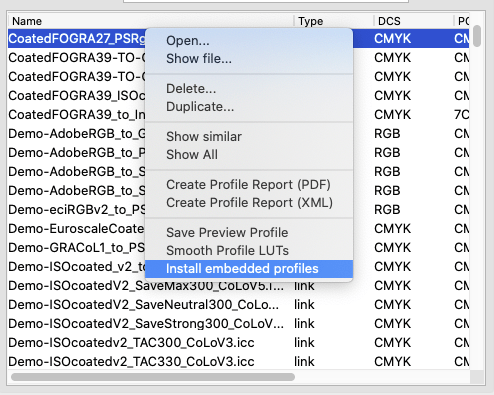
Embedded source and target ICC printer profiles of DeviceLinks can be extracted using the Install embedded profiles option (only available when embedded profiles are present). This is useful if you have been sent a DeviceLink profile and the required printer profiles are not available on your system.
Open the context menu by right-clicking on the respective DeviceLink profile and click on Install embedded profiles. The extracted profiles are stored in your profile library. A message at the bottom of the window confirms the action and the location.
Extracting DeviceLink profiles
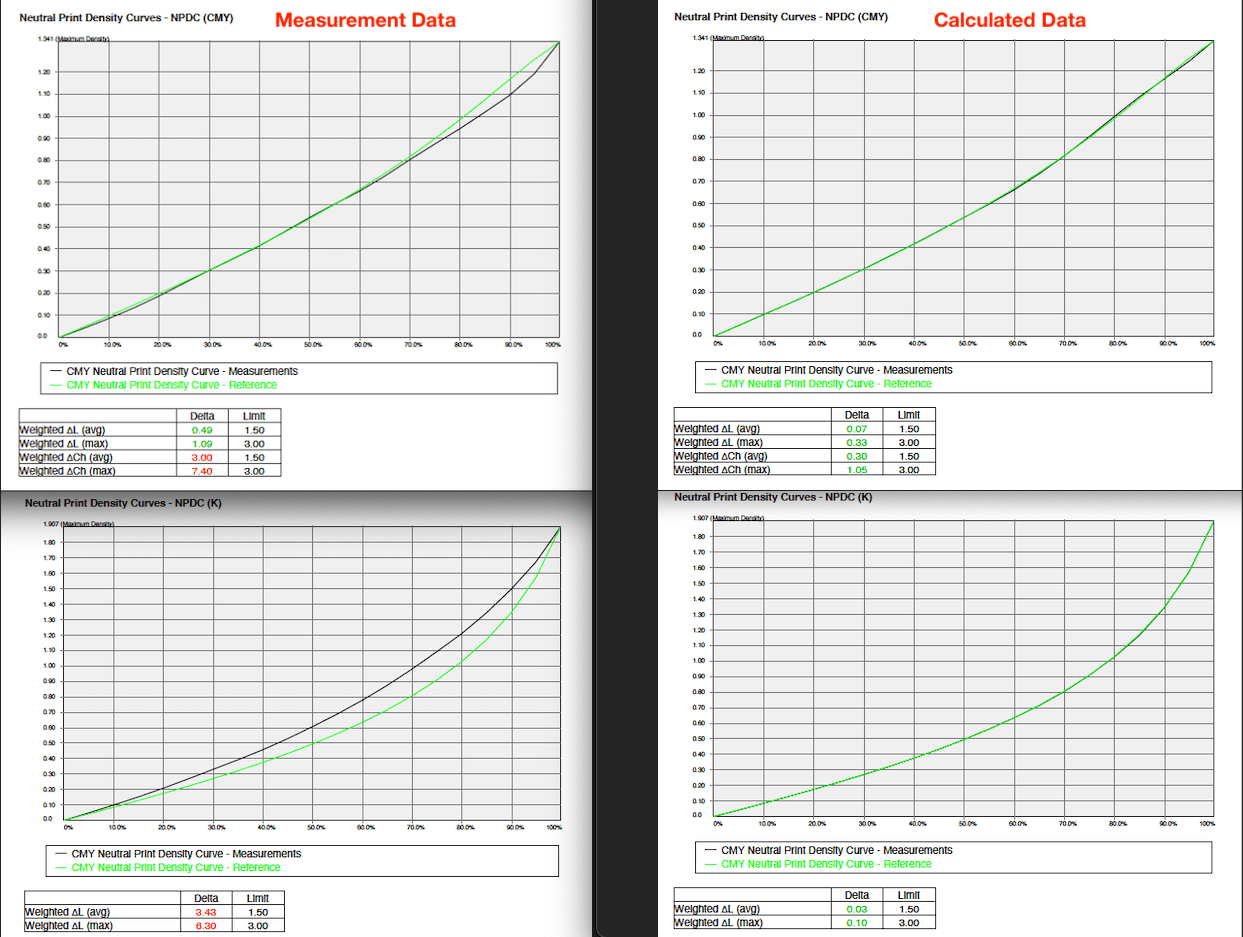
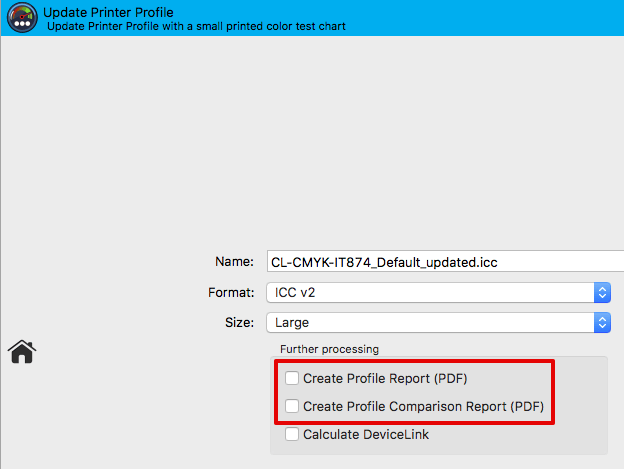
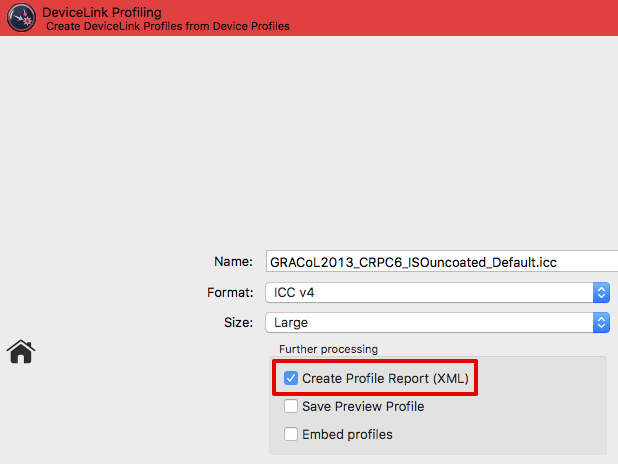
Create Profile Report (PDF/XML): Based on the selection of the profiles the profile reports will be created and stored in the dedicated Documents folder. Multiple reports can be created simultaneously.
macOS: /Users/USERNAME/Documents/CoPrA/Reports/
Windows: C:\Users\USERNAME\Documents\CoPrA\Reports
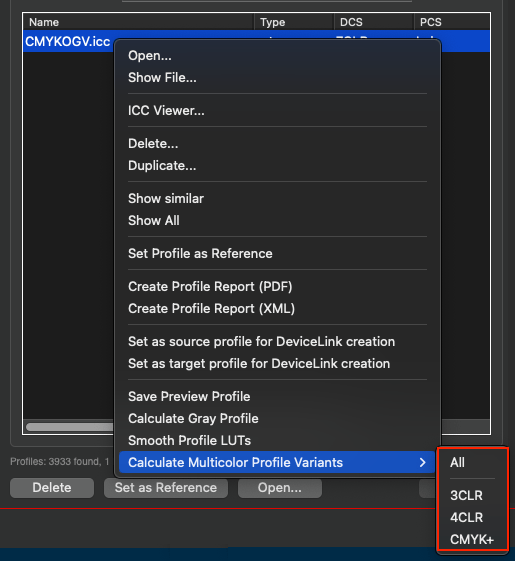
Calculate Multicolor Profile Variants: This option creates various profile combinations of the selected Multicolor profile. All possible profile variants such as 3CLR, 4CLR or CMYK+ can be created automatically at the same time, but they can be created individually as well.
Multicolor profile variants, e.g., of a 7C output profile, are useful for determining whether fewer than 7 colors, e.g., 5 or 6 colors, or even the CMYK colors alone are sufficient for printing a given job. After all, it is not always necessary to use all available process colors and costs can be saved by using fewer channels.
Note: The creation of 4CLR variants also creates a CMYK profile. For CMYK+ profiles, 5CLR and higher variants are created using CMYK and all spot color combinations.
The four buttons below the profile list differ for macOS and Windows (see screenshots).
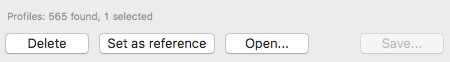
macOS buttons
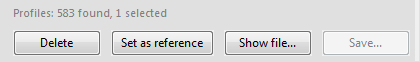
Windows buttons
Delete: Deletes the selected profile.
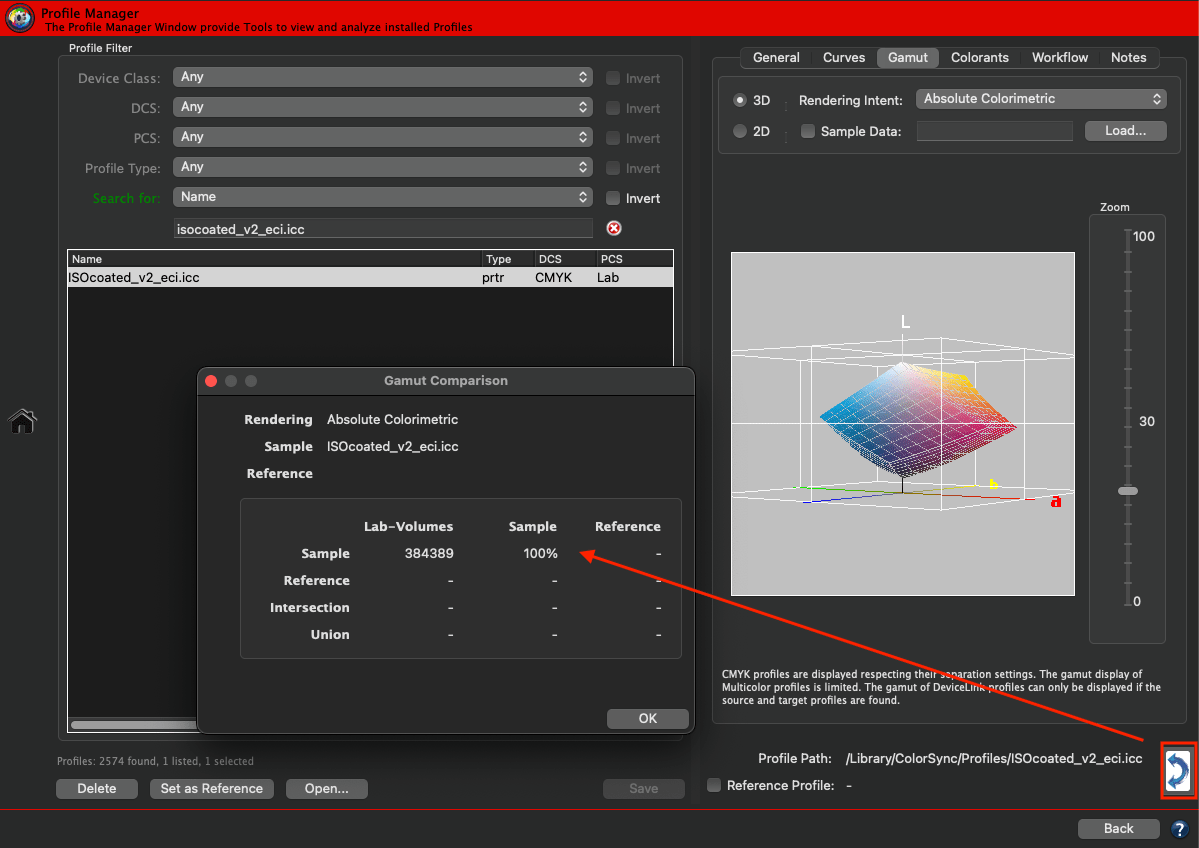
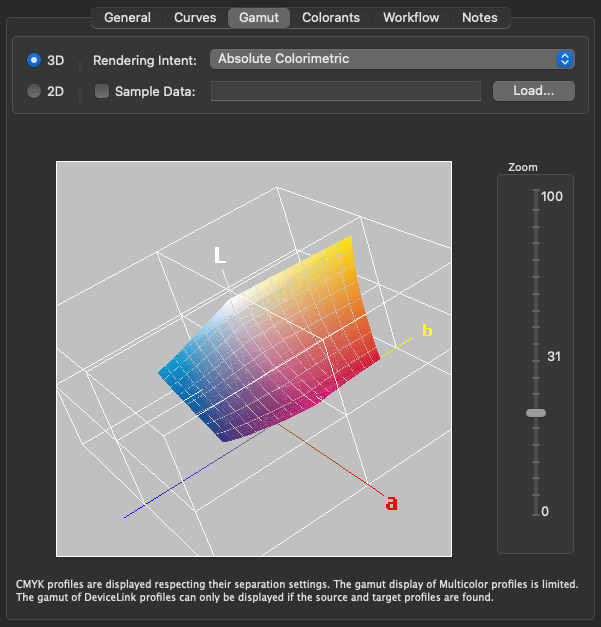
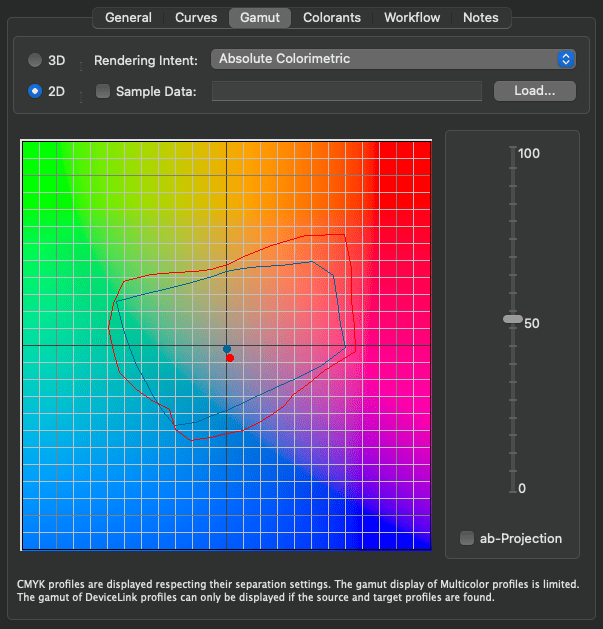
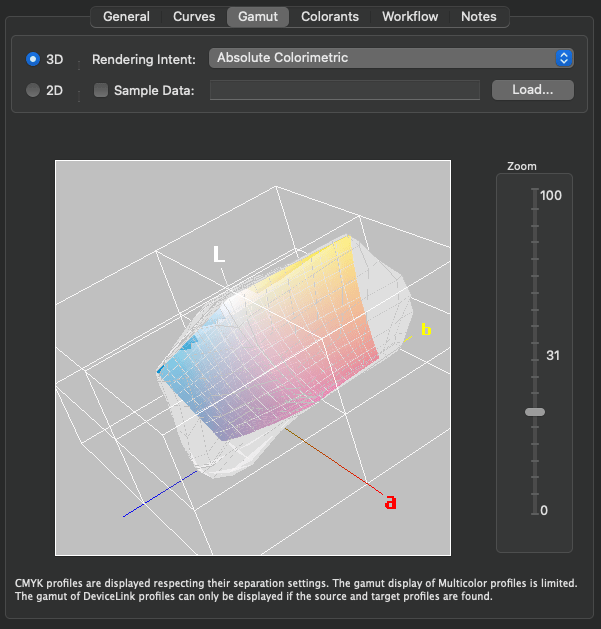
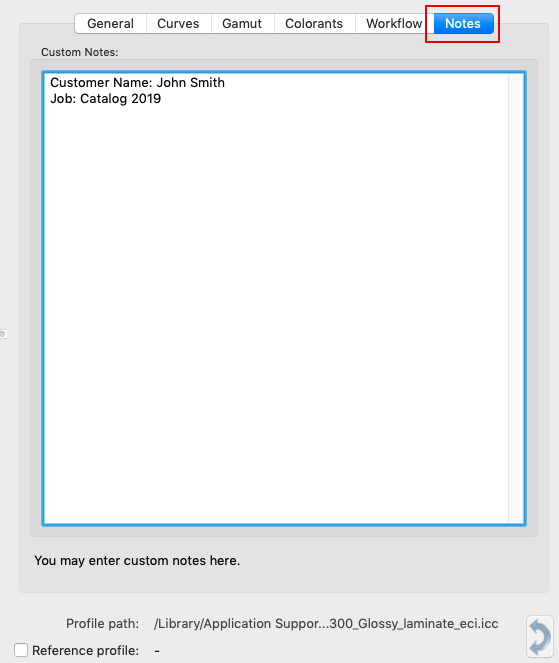
Set as reference: The selected profile acts used as reference profile for a gamut comparison with another profile. It is displayed at the right bottom of the window under Reference profile and can be activated or deactivated by its checkbox. After activation it is available for a Gamut Comparison (see below) and will be shown in the 3D and 2D view of the gamut together with the selected profile. To view only the selected profile, hide the reference profile by unticking the checkbox.
Save: Saves any changes to a given profile.
macOS:
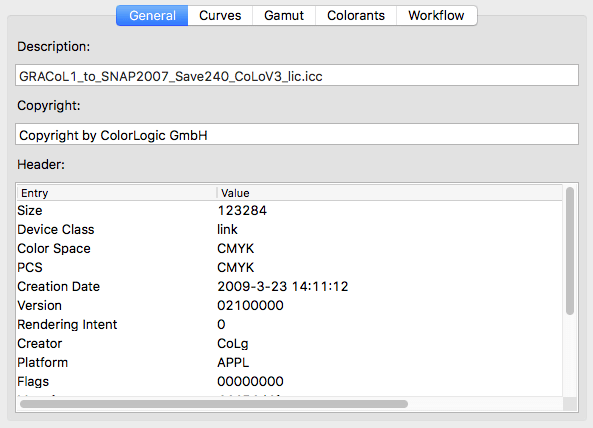
Open: Opens the ICC profile using the default system program. macOS opens the ColorSync Utility which displays individual tags and tables of the selected profile.
Windows:
Show file: Opens the folder in which the selected profile is stored.