ColorAnt | Workflow EN

Workflow

Customized automatic processing and optimization of measurement data

Custom Workflows

The Workflow feature enables automatic processing and optimization of measurement data. The application of various tools for data correction and optimization can be defined and adapted to the requirements of specific jobs, which means that measurement data can be automatically processed in a precisely specified manner.

Creating a Workflow

To create a custom Workflow, simply load a measurement file and apply any desired data correction and optimization tools from the Editing sidebar area with all required settings.

Afterwards open the context menu with a right click and select the entry Create Workflow.

Create Workflow: Shows all tools with all settings applied to the selected measurement file. Underneath, the workflow can be assigned a custom name and saved. Workflows are saved in the user Documents folder under ColorAnt\Workflows as xml files which can be transferred to other systems (by copy and paste or import/export).

Applying a Workflow

To apply a custom workflow to one or more measurement file(s), open the Workflow feature either from the context menu or the sidebar.

Select the desired workflow from the drop-down menu, and click Start.

All data correction and optimization steps of the workflow are now applied to the selected file in the specified order.

The settings of the selected workflow can be viewed (magnifying glass icon), and workflows can be renamed (pencil icon) or deleted (trash can icon).

ZePrA | Automation EN

Automation and Connectivity

Job Control Files – Command Line Interface – Auto Import Folder – Enfocus Switch Integration – Push-2-ZePrA

Automation and Connectivity

ZePrA’s automation capabilities allow for complex workflows with dynamic changes on a job-by-job basis.

One of ZePrA’s greatest quality is its versatility:

  • ZePrA can be used as stand-alone color sever or connected to other workflows.
  • ZePrA can be operated via the user interface or completely faceless via the Command Line interface (CLI).
  • The Push-2-ZePrA Adobe Photoshop extension allows color converting image files – selected in Photoshop – with ZePrA, without having to leave Photoshop.
  • Multiple ZePrA instances in larger organizations can all share a common folder – the Auto Import folder – to connect to each other and share configurations, spot color libraries and profiles to synchronize each other.
  • ZePrA Connector launched in cooperation with sister company HYBRID Software and links ZePrA with CLOUDFLOW enterprise packaging software.
  • The Enfocus Switch ZePrA configurator allows ZePrA to be integrated into more complex workflows. Integration with the Impressed Workflow Server (IWS) is also possible.
  • With Job Control Files almost every function in ZePrA can be controlled remotely without the need to intervene in ZePrA’s user interface. Job Control Files are XML or JSON files with ZePrA commands and are placed in the Input folder of a ZePrA Queue or used as argument in a command line


Push-2-ZePrA

Push-2-ZePrA is an Adobe Photoshop extension that allows color converting an image file selected in Photoshop with ColorLogic’s color server ZePrA from Photoshop.

Depending on the color server settings high quality color conversions with DeviceLink profiles will be performed leading to better color rendering of images than typical color conversion with Photoshop. Even spot colors can be converted if the selected ZePrA configuration is set up accordingly. The converted file will be opened up in Photoshop so that you do not need to leave Photoshop in order to get the best possible color converted images.

Detailed Information is available on the Push-2-ZePrA page.

Automatic Import – ZePrA’s cloud function

When ZePrA is used on multiple computers within a company, the cloud feature Automatic Import allows sharing configurations and spot color libraries by deploying a shared folder in the cloud (DropBox, Google Drive, internal cloud) or on the internal network. The folder supports ZePrA’s spot color libraries (*.ccf files), spot colors in CxF files, ZePrA configurations (*.ccf files), and CoPrA DeviceLink settings for SmartLink (*.dlcfg and *.sicfg files).

Specifying the location for the Auto Import folder

Example: A flexo printer is continuously adding new spot colors for use in ZePrA’s spot color conversion. By saving the spot color library to the shared folder, each ZePrA installation, no matter where it is located, will automatically receive the updated file. It is important that all ZePrA applications have access to the cloud folder.

Files (such as ICC profiles, configurations, spot color libraries, gradations or SmartLink settings) that are moved or copied into the Auto Import folder are transferred to ZePrA’s internal dataset and can then be used by ZePrA.

When the file in the Auto Import folder is replaced by a newer version, it will be updated in ZePrA’s internal datasets as well.

Note: If a file in the Auto Import folder is deleted, it is not deleted in ZePrA’s internal dataset. For example if a SmartLink setting has been deleted in the Auto Import folder, it is still available in ZePrA’s internal dataset and if this setting is deleted in ZePrA’s dataset, it is still available in the Auto Import folder.

HYBRID CLOUDFLOW Integration

CLOUDFLOW Colorspace

Launched in partnership with sister company HYBRID Software, CLOUDFLOW Colorspace delivers state-of-the-art spectral color predictions for CLOUDFLOW enterprise packaging software. CLOUDFLOW Colorspace is based on ZePrA and uses ZePrA’s innovative technologies for spot color calculations and color conversions.

CLOUDFLOW’s modular production workflow suite is tailor made for the label and packaging industry and offers file processing, asset management, soft proofing and workflow automation tools.

CLOUDFLOW Colorspace is driven seamlessly from CLOUDFLOW and supplies automatic color optimizations for enhanced spot color performance, cost optimizations linked to Extended Color Gamut printing and ink-saving technology, and improved press uptime and performance through reduced waste and energy usage.

Elevate color capabilities with CLOUDFLOW Colorspace:

  • State-of-the-art spectral color predictions
  • Drive ZePrA in an easy to use and configurable UI within CLOUDFLOW
  • Unlock cost optimisations with Extended Color Gamut printing and ink saving technology
  • Color targeted for your unique printing condition
  • Tight integration into your unique business processes
  • Automated decision analysis of spot color performance
  • Routing flexibility to conventional and digital printing

Learn more about CLOUDFLOW at cloudflow.hybridsoftware.com.

About HYBRID Software

With offices in Belgium, Germany, US, UK, Spain, France, Italy, and China plus a global partner network, HYBRID Software is an enterprise software development company focused on innovative productivity tools for the graphic arts industry.

HYBRID Software’s CLOUDFLOW workflow, PACKZ and STEPZ editors, and print quality solutions offer a unique set of advantages that include native PDF workflows, enterprise cloud solutions, scalable technology with low cost of ownership, and direct integration with leading MIS solutions and output devices. These products are used by thousands of customers worldwide in all areas of prepress and print, including labels and packaging, folding cartons, corrugated, wide format and digital printing. HYBRID Software is a subsidiary of Hybrid Software Group.

www.hybridsoftware.com

Contact: marketing@hybridsoftware.com

Enfocus Switch Integration

Working with Enfocus Switch

Even for highly advanced and efficiently configured applications like ZePrA, there are still application scenarios where special file treatment or an additional approval step for optimized PDF files make sense. This particularly applies to print providers and printing companies who receive PDF data from numerous customers that have been produced in a variety of different ways. The combination of ZePrA with Enfocus Switch and a preflighting solution has proven to be very successful for this kind of application.

Job Control Files

Job Control Files are XML or JSON files containing ZePrA commands and are placed in the Input folder of a ZePrA queue or used as an argument in a command line. With the Job Control Files almost every function in ZePrA can be controlled remotely without the need to intervene in ZePrA’s user interface. The Job Control File feature can also be used independently from the CLI in regular ZePrA operations.

The working principle of Job Control Files is explained in the video below.

To get started, we have compiled a few Job Control Files examples that can be used to familiarize yourself with the functionality and the application (Download here).

The technical documentation on Configuration Options and Job Control File File format can be downloaded as PDF.

For 3rd parties intending to parse and use the information provided in the ZePrA Job Report, the ZePrA_JobProperties.pdf file is available, which contains a description of the ZePrA Job Properties in JSON format.

Using Job Control Files with the ZePrA CLI and the ZePrA GUI

ZePrA Job Control Files

This section describes the usage of Job Control Files with the ZePrA CLI and the ZePrA GUI. The content and format of Job Control Files are specified in detail in JobControlFileFormat.pdf and ConfigurationOptions.pdf.

Basics

  • Job Control File is an XML or JSON file
  • Job Control File can be processed using the CLI (via command line) or the ZePrA user interface (via Queues)
  • The Job Control File contains information about the input file, the desired output file and the to be used configuration and options

Configuration

The configuration can be specified in three ways:

  1. Name of an existing configuration plus options. A temporary copy of the existing configuration is modified with the options and the file is processed with the resulting configuration.
  2. Auto setup plus options. A temporary configuration is created with auto setup and modified with the options and the file is processed with the resulting configuration.
  3. Pure options. A temporary configuration is created “from scratch” based on the options and the file is processed with the resulting configuration. In this case, the options completely define the configuration.

In any case, creation or modification of configurations are only temporary and have no effect on the saved settings of ZePrA.

Input file

The input file can be specified in different ways:

  • full path
  • relative path (also a pure file name)
  • The input file is a file with the same base name and same path as the Job Control File. That means, if the Job Control File is “test.xml”, ZePrA looks for a file name “test.pdf”, test.tif”, etc. at the same location.

Output file

The output file can be specified in different ways:

  • full path
  • file name without path
  • default

Reporting

  • In the Job Properties (e.g. available in the Overview dialog of ZePrA via right click on a processed job) in section Processing there is an entry Job Control File containing the Job Control File file name.

Queues (GUI only)

  • Job Control File are not supported with drag & drop
  • For hot folder queues, the Waiting time for Job Control Files can be activated with a checkbox in the Define Queues settings in the Options
  • In the Pending Jobs list on the Overview dialog, the target file name defined in the Job Control File is shown in the first place. The name of the Job Control File is displayed in brackets as additional information.
  • When a Job Control File arrives in a hot folder queue, ZePrA waits a certain time until the target file completely arrives. After the time elapsed an error is displayed.
  • When a PDF, TIFF, … file arrives in a hot folder queue, ZePrA waits a certain time until a Job Control File arrives, which is recognized as belonging to the target file. When the time elapsed, one of the following happens, depending on the queue settings:
    • the file is processed as usual
    • the file is processed as usual, and a yellow job warning is generated
    • a job error occurs, and the file is placed in the Error folder

  • After processing, the Job Control File is removed from the Input folder and moved into the Done folder
  • The location of the output file depends on the input file and other settings in the Job Control File.

Command Line Interface – CLI

There are two ways of using a Job Control File with the CLI:

  1. Placing the Job Control File as argument of the -j option:
    zcmd -j <job control file> <inputfile> -o <outputfile>
    The file is converted using the configuration specified in the Job Control File.
    The Job Control File should not specify “Input File” and “Output File”.
  2. Placing the Job Control File on the command line (without using -j):
    zcmd <job control file>
    The Job Control File should contain “Input File” and “Output File”.

ZePrA | Spot Color Iteration (ZePrA 9 and higher)

Spot Color Iteration

Iterate spot colors to improve or maintain quality

Iterate Spot Colors

Spot Color Iteration is a process that involves printing of the spot colors converted from ZePrA on the printer to be used for the print job, followed by measuring test charts and optimizing the color differences (expressed in deltaE2000) until the measured deltaE values are within the desired tolerances. Printing the test chart and applying the Iterate Spot Colors feature once only already results in an improved spot color rendering which is usually close to the optimum of this printer.

Why can spot color iteration be required?

First of all, be assured that ZePrA already calculates the best possible spot color conversion based on the target profile set under Configuration/Target Color Space. However, printers, inks and papers drift over time so that there are always some deviations from the state the printer was profiled. During spot color iteration we measure how converted spot colors are actually printed in the current state, and subsequently optimize the deltaE2000 values. The iteration report shows which colors are improved and where restrictions based on the color gamut or the spot color Calculation Method occur so they can’t be optimized further or if additional iteration steps are recommendable.

Procedure

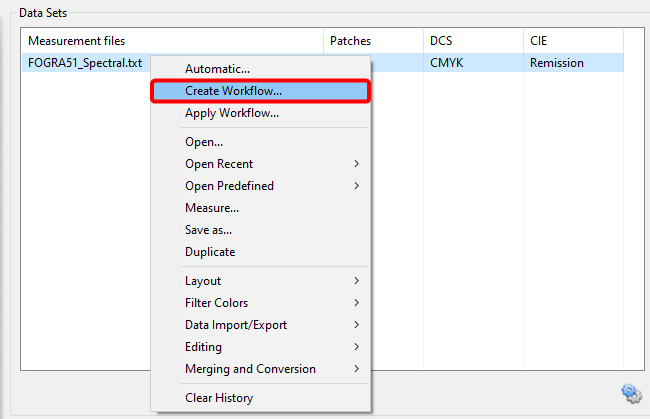
Open the Spot Color Iteration Wizard, either from:

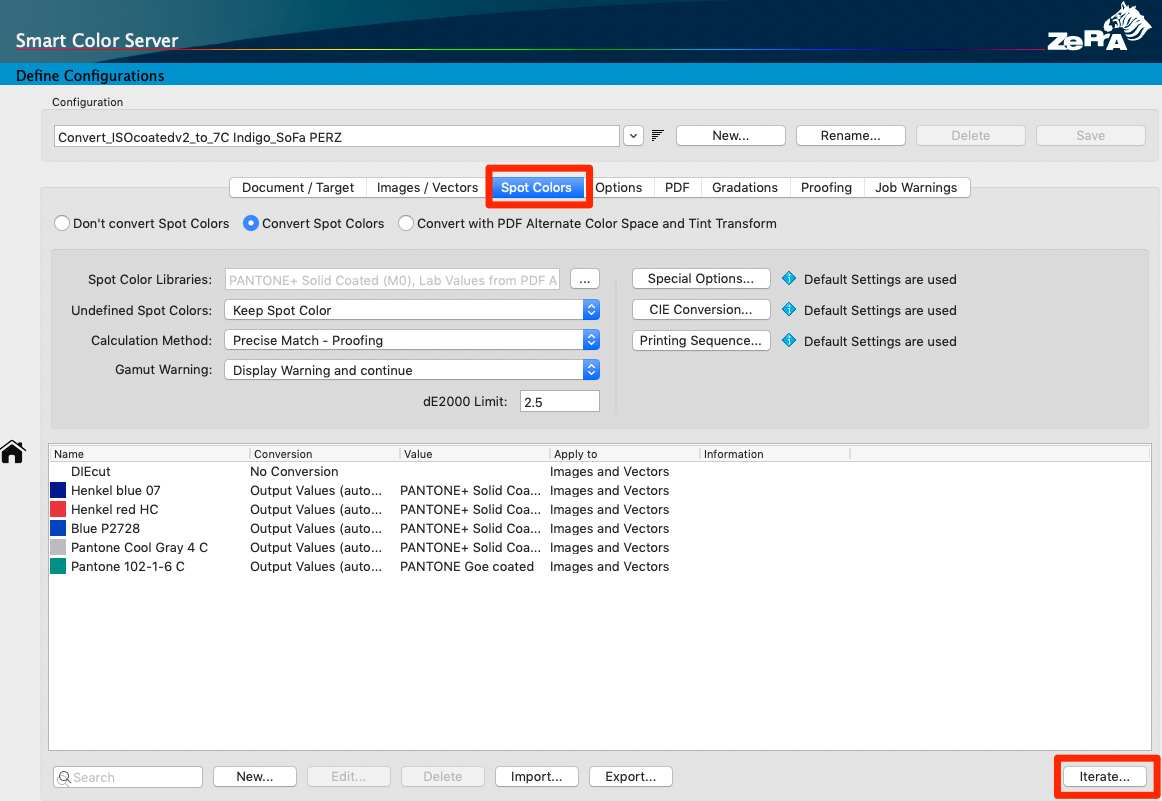
  1. The Spot Colors tab under Configurations (Configurations > Spot Colors > Iterate at the bottom of the window).

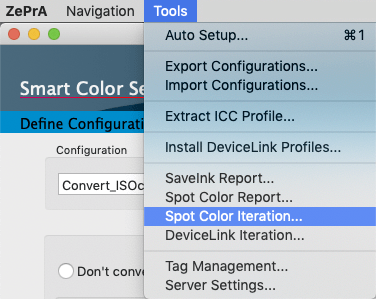
  2. The Tools menu (Tools > Spot Color Iteration).

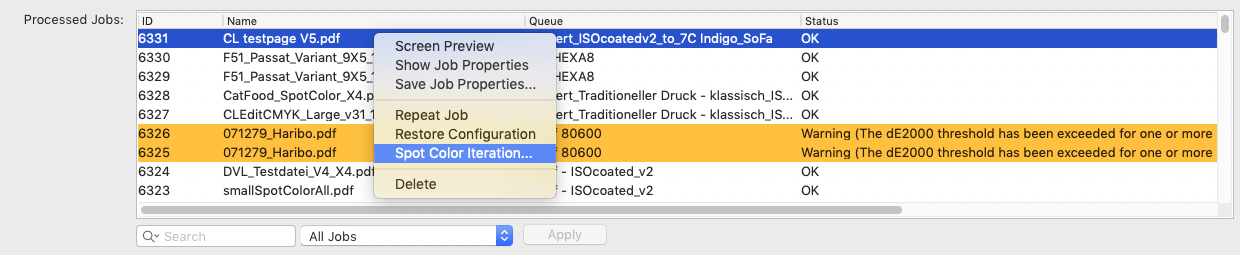
  3. Alternatively, if a job with spot colors has been converted via a queue and the associated configuration is set to Convert Spot Colors, the Spot Color Iteration Wizard can be started by right-clicking on this job in the Processed Jobs section of the Overview window and selecting Spot Color Iteration.

Note: A spot color module license is required to use the tool.

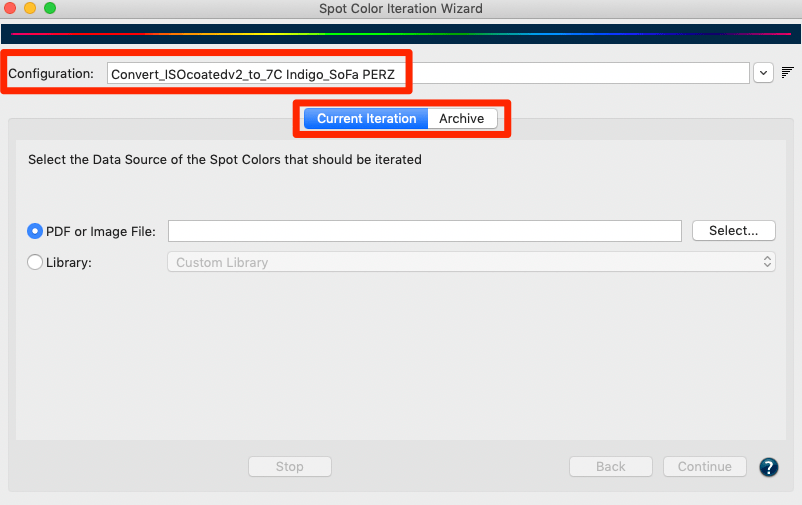
The Spot Color Iteration Wizard dialog consists of two tabs, the Current Iteration and the Archive tabs. The Current Iteration tab contains the actual iteration wizard and typically, if a configuration is selected that has not yet been iterated, the wizard is started directly there. The Archive tab contains all the iteration steps that have been carried out, including all the evaluation details.

The wizard guides the user through the iteration process in seven steps:

Step 1: First, select the Configuration you would like to use for printing. The option Convert Spot Colors must be enabled in this configuration.

Notes: When the Spot Color Iteration Wizard is started via Processed Jobs of the Overview, the Configuration is already preselected.
The best approach for the iteration of spot colors is to set the Calculation Method to Precise Match or Visual Match in the respective Configuration.
The setting Use the least Amount of Channels may be insufficient for iterating spot colors. Importantly, spot color iteration will not work when the spot color conversion is set to Convert using Alternate Color Space from PDF.

Step 2: Select the source of the spot colors you would like to optimize. You can either choose a PDF or Image File with spot colors or an entire spot color Library.

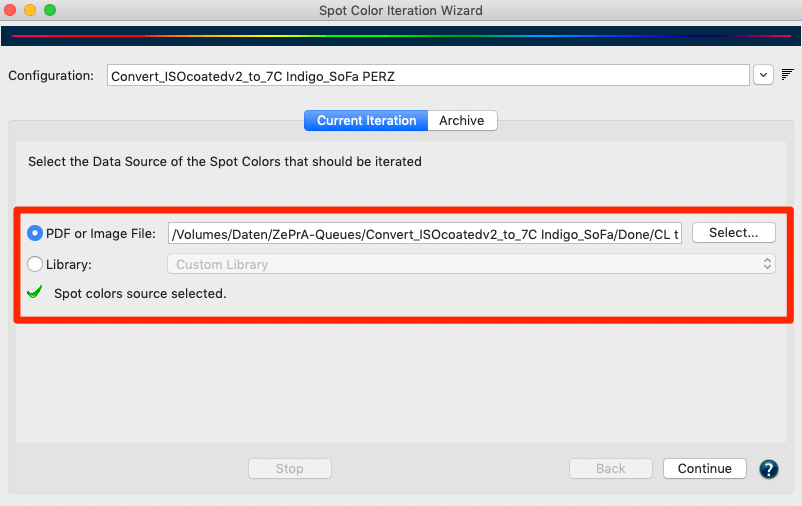
Note: When the Spot Color Iteration Wizard is started via Processed Jobs of the Overview, the Job (PDF or image file) is already preselected.

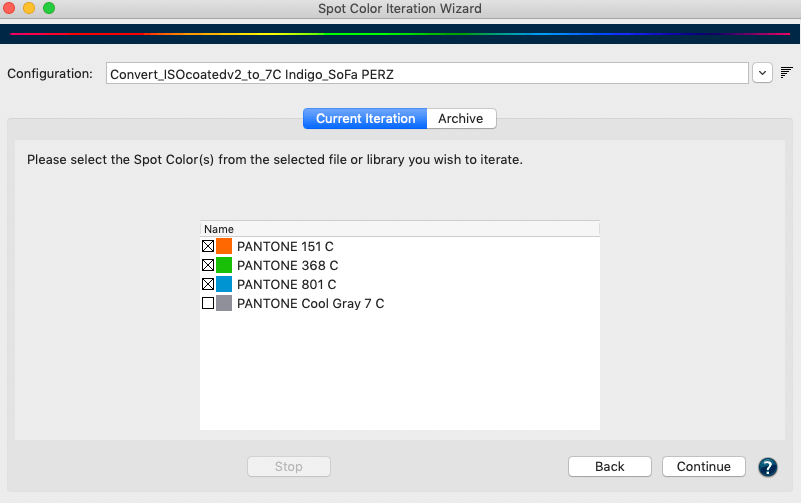
Step 3: Select one or more spot colors for iteration. All spot colors of the job, PDF or image file will be automatically extracted and displayed. Disable the colors that are not to be iterated. By default all spot colors are preselected.

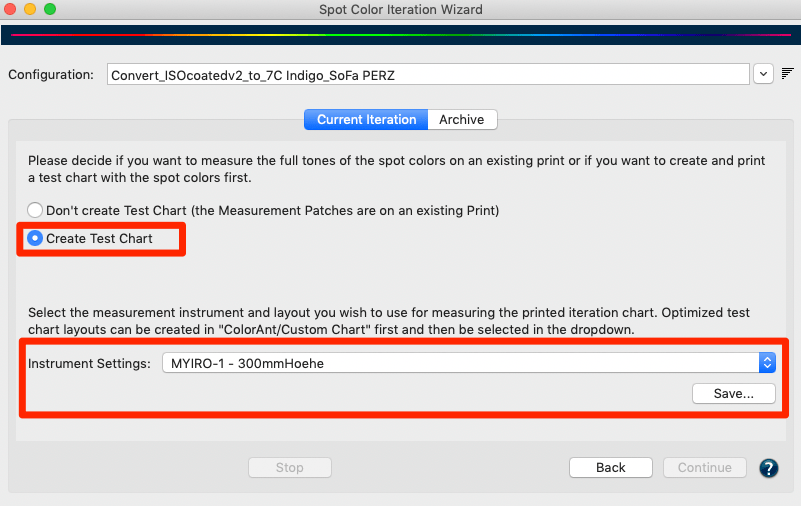
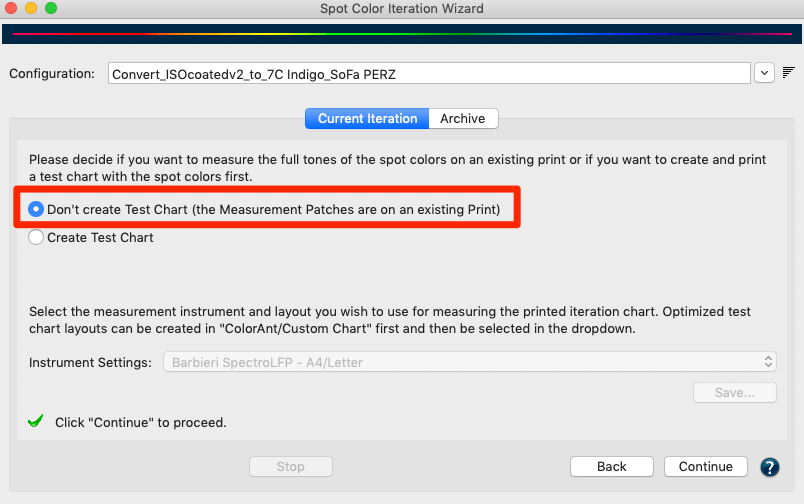
Step 4: Choose to Create a Test Chart or to measure the full tones of spot colors from an existing print (Don’t create Test Chart).
Create a Test Chart: Creates a test chart with the spot colors selected in the previous step. Select an Instrument Setting and click on Save to enable the Continue button.

Don’t create Test Chart: Some prints contain control patches of spot colors that can be used for measuring. Larger areas in the design that contain the 100% tone of a spot color can also be used.

Note: The test chart contains the converted spot colors as given in the Configuration using the conversion settings and Calculation Method defined in the tab Spot Colors.

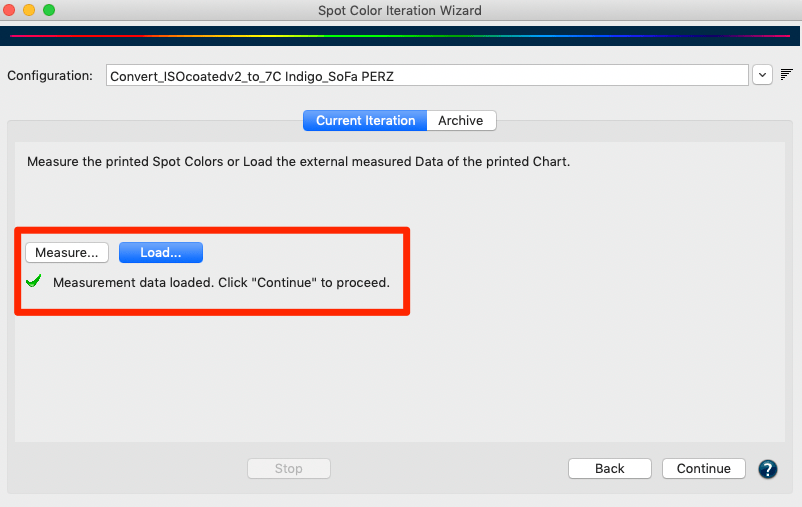
Step 5: Measure the printed spot colors. When using the test chart, it must be printed on the printer without any color management and can be measured after drying.
Measure: Starts the Measure Tool. You do not need to worry about the reference file and layout, as this is already preselected within the Measure Tool. Instructions on how to select your device and make measurements can be found under Measure.

Load: If you have created a test chart you can use the associated exported reference file and measure your printed chart with a different measurement tool. Make sure that the measurements are saved in standard file formats that can be read by ZePrA, such as CGATS TXT, XML or CXF3. The external measurement files can be loaded using the Load button.

Once the measurement data has been transmitted from Measure Tool or loaded from external sources, and it conforms to the printed chart which is indicated by a green check mark, you can proceed by clicking Continue.

Note: When loading measurement data that does not match the chart layout or the corresponding patches in the reference file, you are alerted by a warning message and cannot proceed to the next step.

Step 6: The evaluation results of the measurements of each spot color are displayed in comparison to the reference Lab values of the original spot colors. In addition to the DeltaE2000 (dE00) and DeltaE76 values, a Status information text is also displayed, either in green, yellow or orange. The Legend below the table explains the indication colors and status information.

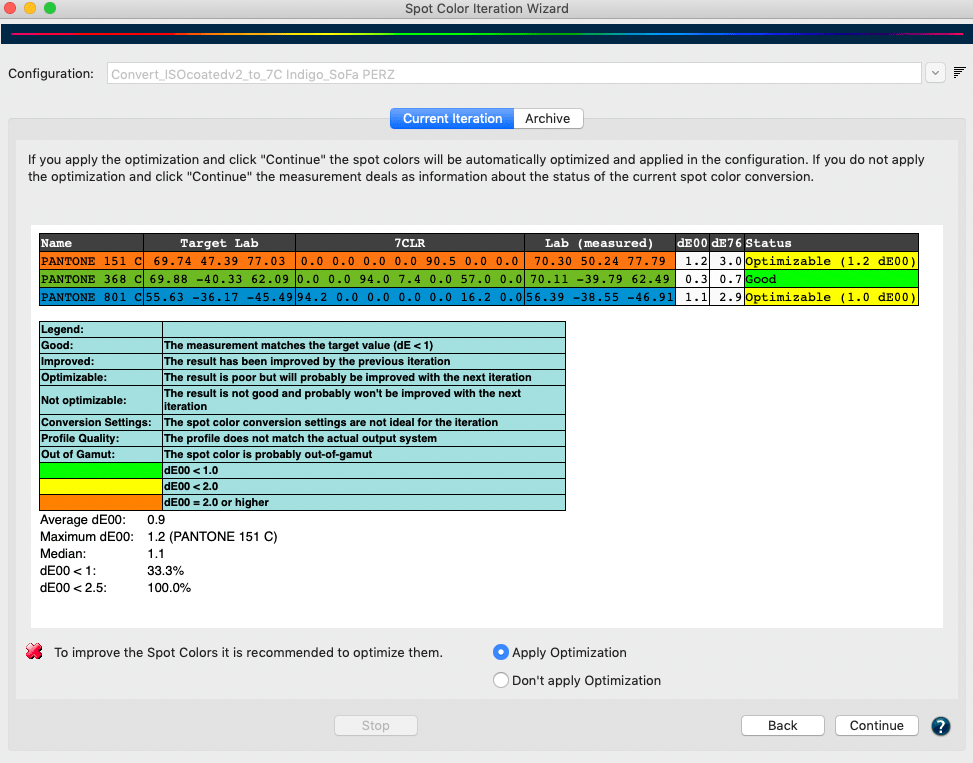
Green: The spot color match is less than 1 dE00 and a perfect match is achieved. Further optimization is then no longer required. 

Yellow: The spot color match is less than 2 dE00 but higher than 1 dE00 and the Status column indicates that the match can further be improved.

Orange:  The spot color has a higher deviation than 2 dE00 and the Status column indicates that the match can further be improved.

If a color is not optimizable or out-of-gamut, it can not be improved which is indicated in the Status information column, too.

ZePrA preselects one of the two options (Apply Optimization or Don’t apply Optimization) depending on the evaluation results. However, the preselection can be overridden and another iteration cycle can be applied if the results are to be improved even further. To do this, select the Apply Optimization radio button and click Continue. Alternatively, if you just need the measurements for evaluation select the Don’t apply Optimization radio button.

Step 7: The concluding step of the iteration cycle contains three options and a checkbox to choose from. Based on the previous results, the wizard already preselects a logical option for you to follow:

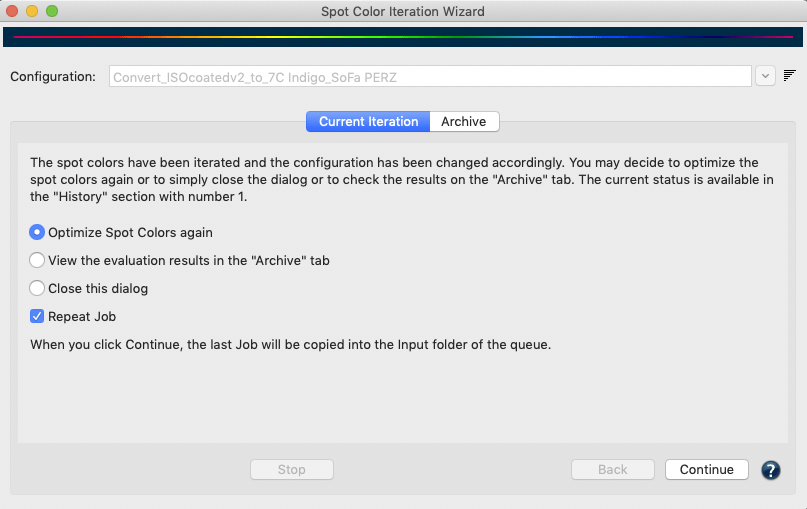
  1. Optimize Spot Colors again: Runs another iteration cycle, for example, to check whether a previously iterated spot color successfully passes the evaluation. If you select this radio button and click Continue, a new iteration cycle starts with step 1 and the selection of the spot colors to be optimized.
  2. View the evaluation results in the Archive tab: If you have already completed several iterations or would like to see the evaluation results once more, select this option. When you click Continue, the Archive tab opens.
  3. Close this dialog: If the evaluation results are fine or if you want to end the iteration process you can simply select Close this dialog and by clicking Continue the iteration is ended. 

The checkbox Repeat Job works independently from the three radio buttons. If it is enabled when clicking Continue the last job is converted again with the configuration. This is especially helpful if the spot colors of that last job have been optimized by the wizard which in turn optimizes the spot color settings in the configuration to improve the spot color rendering. 

You will find the optimized device values (Output values) in the table of the tab Spot Colors under Configuration. They will be marked as Iterated in the column Information of the table. 

Archive

All data created during the iteration – such as test charts, reference data and measurement data, as well as the report – are stored in an internal database in addition to the save location defined by the user.

Therefore, if data is deleted from the save location it can still be restored from the internal database any time via the Archive tab. Users can stop an iteration process and even close the Spot Color Iteration Wizard dialog at any time and can revert back to the last completed step with the help of the information stored in the Archive.

The Archive tab shows all iteration steps and evaluation details. The History table contains a list of all iterations. More information for the selected iteration step is displayed under Details.

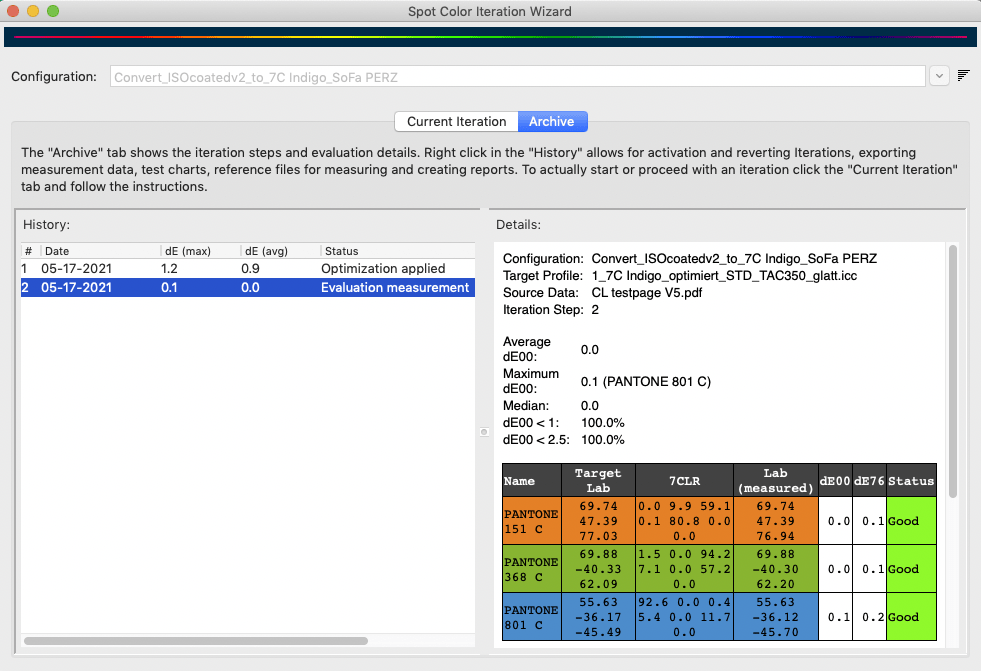
The columns of the History table show the iteration step number #, the maximum DeltaE00 value dE00 (max), the average DeltaE00 value dE00 (avg), the Status of the selected iteration step. It also shows some Information about the iteration process itself, such as Optimization applied, when the measurements done from the printed test chart have actually been used to iterate a spot color, or Evaluation measurement, when the measurements have been used for evaluation only and have not been used to iterate a spot color.

In addition, the iteration process (being performed in the Current Iteration tab) can be discontinued, which is indicated with various messages such as Next step: save chart, Next step: measure or load data, Next step: Evaluate.

Right clicking on an iteration step in the History displays a context menu with the following options:

Save Chart: Exports the test chart into a file selected by the user. The test chart is not newly created but only copied from the internal database. This implies that the file selection only supports the file type initially chosen by the user.

Save Reference Data: Exports the reference data that belongs to the test chart into a file selected by the user.

Save Measurement Data: Exports the measurement data into a file selected by the user.

Save Report: Saves a report containing all Details displayed on the right and the full information about each spot color. This is useful to identify colors with the highest or lowest deltaE values, or colors which are out of gamut. The report is explained in more detail below.

Revert to state before: This is only available for iterations with the status applied. Reverts back to the state before this iteration, giving the previous iteration, if any, the applied state. The status changes to evaluation measurement. All subsequent items are deleted.

Revert to state after: This is only available for iterations with the status applied. Proceeds to the state after this iteration step, making it the active iteration. The status of a next iteration, if available, would be evaluation measurement. All subsequent items after the next iteration are deleted.

Apply Optimization: This is only available for iterations with the status evaluation measurement. It can be used for evaluation measurements that have not been applied in the iteration process itself. Use this option if you want to apply an iteration later on.

Evaluation Results

The Evaluation Results shown under Details are always the evaluations of the previous step. This means, if an iteration has been applied in step 1, the evaluation results shown under Details for the selected step 1 are the values before the iteration has actually been applied. Therefore, in order to see the results of the first iteration a second step is necessary. The evaluation results shown for that second step are actually the iteration results of the first iteration step, and so on. This offers the possibility to use the results of an iteration itself for a second iteration. But again, another measurement step is needed to find out if this iteration actually improved the result.

The Report

By right-clicking on an iteration step in the left table, a report can be created for this step which can be saved in various formats such as PDF, HTML, XML and TXT. The PDF and HTML formats are the most common versions for end users, while the other formats are more intended for automation and usage in other systems such as a MIS (Management Information System). The following is a description of the PDF report.

The Report contains all information about the spot color Name, the device values generated by ZePrA (displayed in the color space of the target profile) and the measured Lab values as well as the dE2000 and dE76 deviations from the reference Lab values of the spot color and the Status. Under Status it is displayed whether the respective spot color has been well matched (less than 1 deltaE2000) and whether it can still be optimized. If the match of a spot color is smaller than 2 dE00 but larger than 1 dE00 and the match can be further improved, then it is displayed in yellow in the Status column. Finally, spot colors with a deviation higher than 2 dE00 will be highlighted in orange. If a color cannot be optimized or is out-of-gamut, it cannot be improved, which is also displayed in the Status information. The Legend below the table explains additional information messages that can be displayed.

Video Tutorial: Spot Color Iteration Wizard

ColorAnt | Evaluate

Evaluate - Proof Evaluation

Evaluation of Proof Measurement Data

Evaluate – Proof Evaluation

The Evaluate tool can be used to check whether the proof measurement data from a media wedge fulfills the requirements for a contract proof according to ISO 12647-7 or a validation print according to ISO 12647-8.

In addition, a PSD evaluation can be performed using two different evaluation methods: “Side-by-Side” or “Media Relative”.

Moreover, the Evaluation Method G7 gray balance allows the measurement data to be checked for G7® conformity.

Finally, a fully detailed report can be created with a pass/fail indicator.

Notes

  • The Proof Evaluate tool supports all color spaces including Multicolor and spot colors. It is a powerful addition to ZePrA’s proofing feature, as it allows you to use the reference files of the dynamic media wedges created by ZePrA for proof evaluation.
  • For redundant measurement values, the median is determined and all duplicates (i.e., all patches with identical DCS values) are removed before evaluation.
    This procedure prevents duplicates as well as outliers from unjustifiably influencing the proof evaluations.
  • The Evaluate tool supports all color spaces as either reference data or reference ICC profile. In addition, it checks whether the selected wedge is actually suitable for evaluation and displays a corresponding message.
  • The Evaluate tool is available from ColorAnt L.

The Evaluation tab immediately shows the categories related to the chosen standard, the deltas to the reference, and a score with either a ✓ (passed) or an ✕(failed).

An overall score indicates if the proof has passed or failed.

There are two ways of selecting your reference:  

  • Choose reference data: This drop-down menu contains all data loaded under Data Sets that fit the selected proof measurement data as a reference, which means the number of patches and the color space must match. Select the reference that you want to compare with the selected media wedge measurement data. If dynamic media wedges were used in ZePrA, the corresponding reference data can be used for the proof evaluation in ColorAnt.

    Using reference data from ZePrA:
    1. Open the reference file of the ZePrA configuration in ColorAnt. It is located in ZePrA’s Report folder of the corresponding queue.
    2. Select Measure to measure the media wedge in the proof printout
    3. Open the resulting measurement file and click the Evaluate button.
    4. Select the original reference file from ZePrA under Choose reference data in the Proof Evaluation window.
  • Choose reference ICC profile: This drop-down menu contains all ICC profiles that fit the selected proof measurement data as reference in terms of the same color space. Choose the reference ICC profile that you want to compare with the selected media wedge measurement data.
    Note: The ICC profile is used to create virtual reference values (absolute colorimetric). Depending on the accuracy of the ICC profile, the quality of the reference data can vary from very exact (e.g., CMYK profiles created by CoPrA) to less exact (e.g., small Multicolor profiles).  

Evaluation method: Select a method to either evaluate a Contract Proof according to the ISO 12647-7 standard, a Validation Print according to the ISO 12647-8 standard, to evaluate your data according to Fogra’s PSD standard (ProcessStandard Digital), or to check the measurement data for G7® conformity. The PSD standard is based on the tolerances defined by Fogra and provides guidelines to increase process stability in digital printing. Further information can be found on the Fogra website.

ISO 12647-7 (Contract Proof 2016): For the evaluation of a binding contract proof use this method. 

ISO 12647-8 (Validation Print 2021): Checks the conformance of printing systems that produce a hard-copy validation print, directly from digital data, which is intended to simulate the expected appearance of material printed per a characterized printing condition. The method considers the latest tolerances published in 2021.

G7 gray balance: This method checks the measurement data for G7® conformity to ensure accurate and consistent color reproduction. G7® is an internationally recognized method for calibrating printing presses and proofing systems.

Notes

  • Recently, other visualizations of the final printed product have found a place in the printing/proofing workflow because designers and print buyers prefer not to go to the expense of using an ISO 12647-7 compliant contract proof any earlier in the process than necessary. In many situations, participants in the workflow require a hardcopy visual reference of lesser quality than a contract proof. In the past, those prints varied widely in quality and were often referred to as design proofs, concept proofs, layout prints, etc. That quality level is here being referred to as a validation print.
  • The All Patches ratings do not include Boundary Patches for wedge evaluations.
  • Wedge evaluation: For small charts with less than 150 patches, such as Media Wedges, all Boundary Patches are omitted.
  • Chart evaluation: For larger charts with more than 150 patches, such as the IT-8, the Boundary Patches are taken into account.

PSD Evaluation

The PSD reflects the different customer requirements for the degree of color match with three different quality levels, the quality types A, B and C. Here, A represents a better approximation than B, which in turn is better than C. The overall rating depends on the lowest rated Category. If a value exceeds the tolerance limit, a red X indicates that the evaluation has failed. Quality types A to C thus indicate that all values are within the respective tolerances and that the evaluation has passed (shown in shades of green).

This gradual evaluation of the quality with regard to color reproduction can be achieved with two different evaluation methods: Side-by-Side or Media Relative.

PSD Evaluation (FOGRA PSD 2022 Side-by-Side): Side-by-side is a long-established method based on simultaneous and immediately adjacent color matching. The deviation tolerances apply to the comparison of the target values, defined by the color reference, and the measured values of the OK sheet.

From the Fogra PSD Handbook: Deviation tolerances for Side-by-Side reproductions. Version: PSD 2022

From the Fogra PSD Handbook: CIEDE2000 tolerances for spot colors. Version: PSD 2022

PSD Evaluation (FOGRA PSD 2022 Media Relative): The media-relative evaluation consists of two steps. First, the similarity between the reference and the current output color gamut is checked using the white and black points. A similarity is mandatory to perform the colorimetric evaluation in the second step.

From the Fogra PSD Handbook: CIELAB tolerances for gamut differences to check if media-relative is applicable. The color differences for the white color are very similar when using ΔE ab or CIEDE2000. The CIEDE2000 tolerances shall take precedence. CIELAB 1976 color differences are given in brackets. Version: PSD 2022

The calculation of the media-relative CIELAB color values only takes place if the criteria specified for the first step are met. They are the starting point for the final color evaluation based on all control patches in the second step.

From the Fogra PSD Handbook: Deviation tolerances for media-relative reproductions. Version: PSD 2022

Note: Reliable results can only be achieved with absolute colorimetric measurement data, so please do not use relative or scaled (e.g., converted with perceptual rendering intent) measurement data.

Specify spot colors: When evaluating Multicolor measurement data, the additional colors can be evaluated as process colors or as spot colors. In most cases, with typical Multicolor media wedges, all colors are process colors, but with ZePrA-created dynamic media wedges, additional spot colors may also be included in the file.
Specify spot colors opens a dialog where you can define whether a color is included in the selected Evaluation Method calculation as a Process color or as a Spot color.

By default, all channels of Multicolor data are defined as process colors and included in the evaluation All Patches.

However, if spot colors are present and should not be treated as process colors, e.g., in the case of dynamic media wedges in ZePrA, they can be defined as spot colors. In this case, they are not included in the All Patches evaluation, but are evaluated separately and displayed in a separate Spot color evaluation line.

Note: The button for the Specify spot colors dialog is shown for Multicolor data only.

Report

The available input fields depend on the selected Evaluation method. Enter the required information according to the selected ISO standard.

Save Report: Saves the report in the location and format (PDF, HTML, XML) specified in Settings.

The report contains all the information that you have entered, the summary from the evaluation dialog, a list of all patches with their names or IDs, the device color space, the Lab reference values, the Lab measurement value and the delta.

Label

Allows you to print a label with the evaluation results directly from within ColorAnt. The tab shows a preview of the label to be printed. The label contains the data entered in the Report tab and a table with the data from the Evaluation tab. It also indicates if the print is Accepted or if the evaluation has failed (X) and provides space for a signature.

Note: The label layout is optimized for DYMO 99012 labels (format 89mm x 36mm). For other formats, adjustments may be necessary to achieve optimum results.

Video Tutorial

How to Use the Proof Evaluation Tool in ColorAnt in combination with ZePrA

Learn step-by-step how to use the Proof Evaluation tool in ColorAnt for the evaluation of a proofing media wedge created with ZePrA. In this example, we will be demonstrating the special feature of ZePrA to create a dynamic media wedge using process and spot colors and how to use the supplied reference data from ZePrA for evaluation of a Contract Proof.

ZePrA | Apply Photoshop color corrections to PDF files

Apply Photoshop color corrections to PDF files

In some applications it is not possible to use measurement based DeviceLink profiles. This is true, for example, if a customer brings print data and a print that should be as accurate as possible in the production run without a correct proof. If you view the print data on a monitor with a soft proof of the print standard for the production run, clear deviations from the print that you have brought with you can become visible.

In this case you could either print outside the standard and try to recreate the default – either by making gradation corrections in ZePrA or by using the capabilities of the printing press – or print inside the standard by applying Photoshop corrections to the PDF file. The latter has the advantage that you can proof the color-corrected data according to the standard and have it approved by the customer. This procedure requires an experienced Photoshop user and CoPrA’s Editing tool.

For a test with production data the demo version of the programs can also be used. To do this, meaningful objects must be combined from the existing PDF data into one file in Photoshop and combined with CoPrA’s test chart (EditTarget). This test file is then corrected under softproof conditions on the monitor. The edited image is imported into CoPrA and the corrections are taken into account in the created DeviceLink profile.

Then the DeviceLink profile can be used in ZePrA to correct the color of the original PDF data. If necessary, the corrections can be approved by the customer on a proof before printing. The printer can work as usual according to standard and reach the proof reliably.

The individual steps are described in detail in the chapter How to create DeviceLink profiles with edited charts in the CoPrA Help.