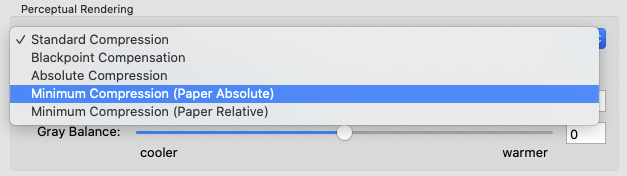
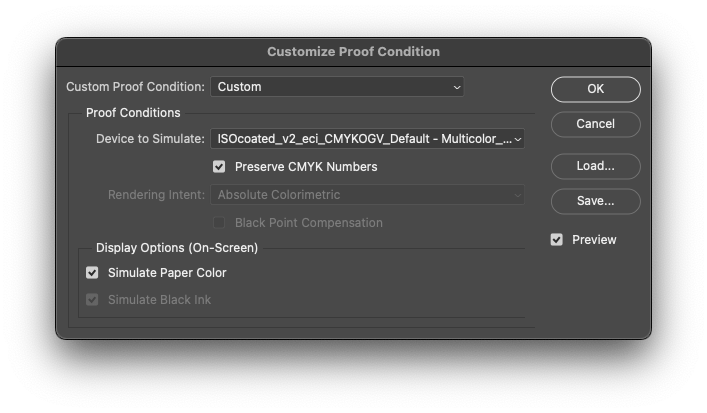
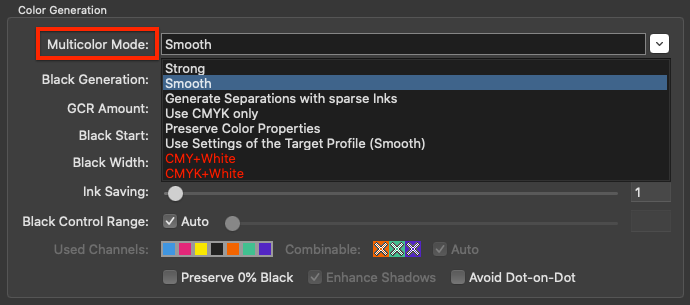
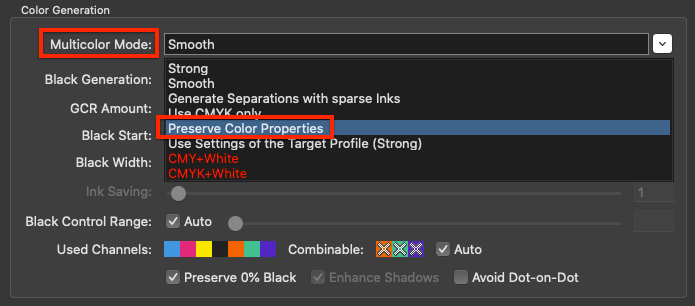
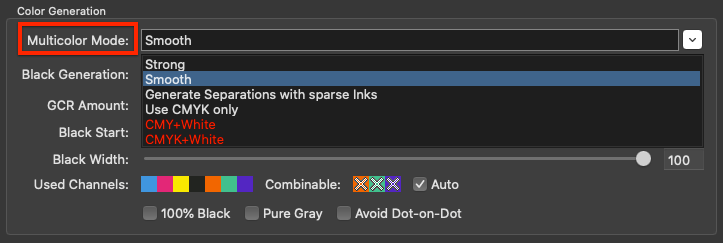
Multicolor Mode: Determines how colors will be built up in individual separations. Is only available when Multicolor measurement data has been loaded. A Multicolor license is required to use Multicolor features.
Note: Multicolor modes that are not recommended for the loaded measurement data are marked red in the drop-down menu.
In some cases, a warning or information message is shown below at the bottom of the window in case the loaded data may require a different mode than the selected one.
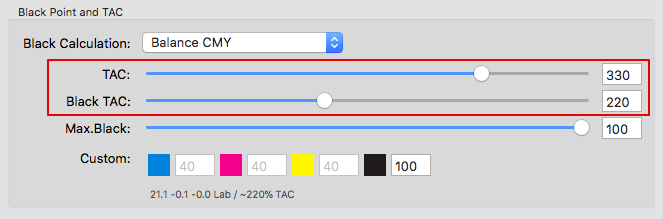
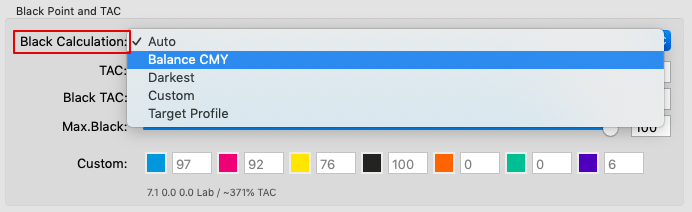
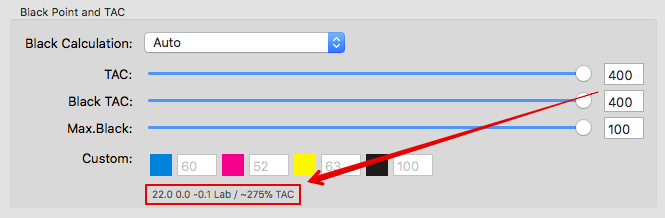
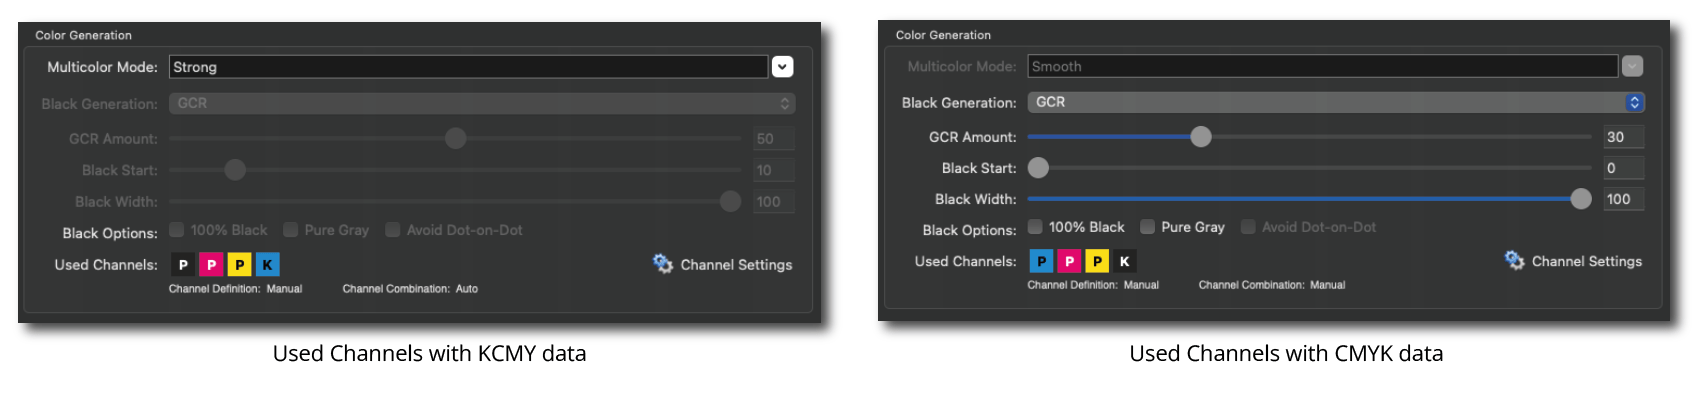
In CoPrA, the first three channels represent primary colors (usually CMY). They should form a sound color space (gamut) and should also be able to create a gray axis. The fourth channel should be black if a separation with UCR/GCR is desired. If black is absent in the Multicolor measurement data while automatic Black Calculation is selected, it will be recognized by CoPrA and the separation will not be generated. Black separation is disabled if the value for Max. Black in the Black Point and TAC setting is 0%. Additional spot color channels (e.g., Orange, Green or Violet in a CMYK-OGV 7 color data set) are regarded as color space expanding colors. The Multicolor Mode determines how color space expanding colors are factored in together with primary colors.
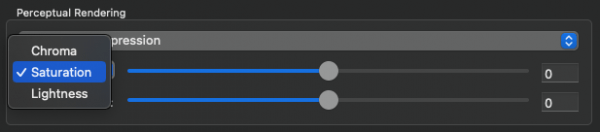
Strong: As much spot color as possible will be applied. Accordingly, less primaries will be used in the highly saturated color areas. This results in a greater use of color space expanding spot colors and therefore in highly saturated colors in the printout.
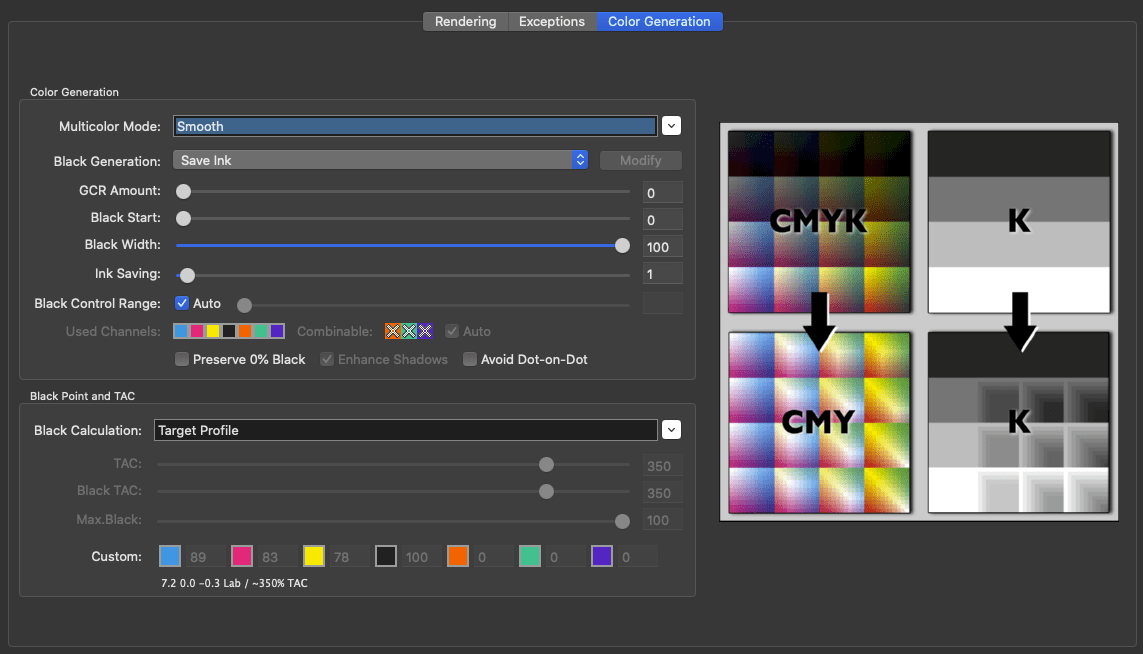
Smooth: Use this method when more CMY is required and if a particularly smooth and harmonious separation with the extended colors is needed.
Note: The two Multicolor modes Smooth and Strong are similar but Smooth uses less color space expanding spot color channels.
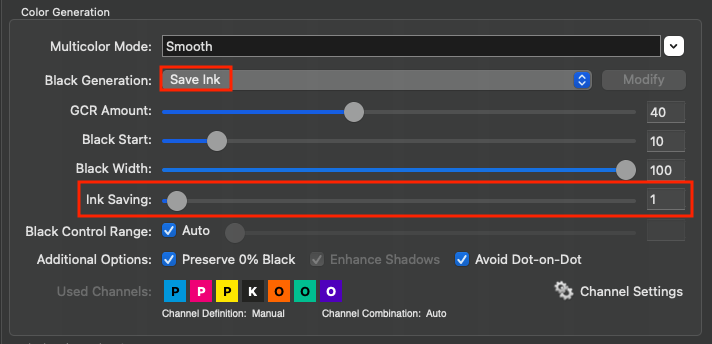
Generate separations with sparse inks: This mode is of interest for the packaging market, as color separations are created in such a way that a certain hue uses as much as possible of a related spot color and very little or no primary colors. For example, in order to create a red hue, as much as possible of a reddish spot color is used, but very little to no magenta or yellow. A maximum of two or three colors are used for each color segment and, therefore, this Multicolor mode is practical to save process colors. However, black generation cannot be controlled and is based on the (separation) mode MaxK.
Note: The Setting “Sparse Ink” is recommended for easier use of this mode. In contrast to the Multicolor modes Smooth, Strong and Use CMYK only, the Multicolor mode Generate separations with sparse inks does not allow regulation of the Black Generation. Accordingly, these settings are grayed out.
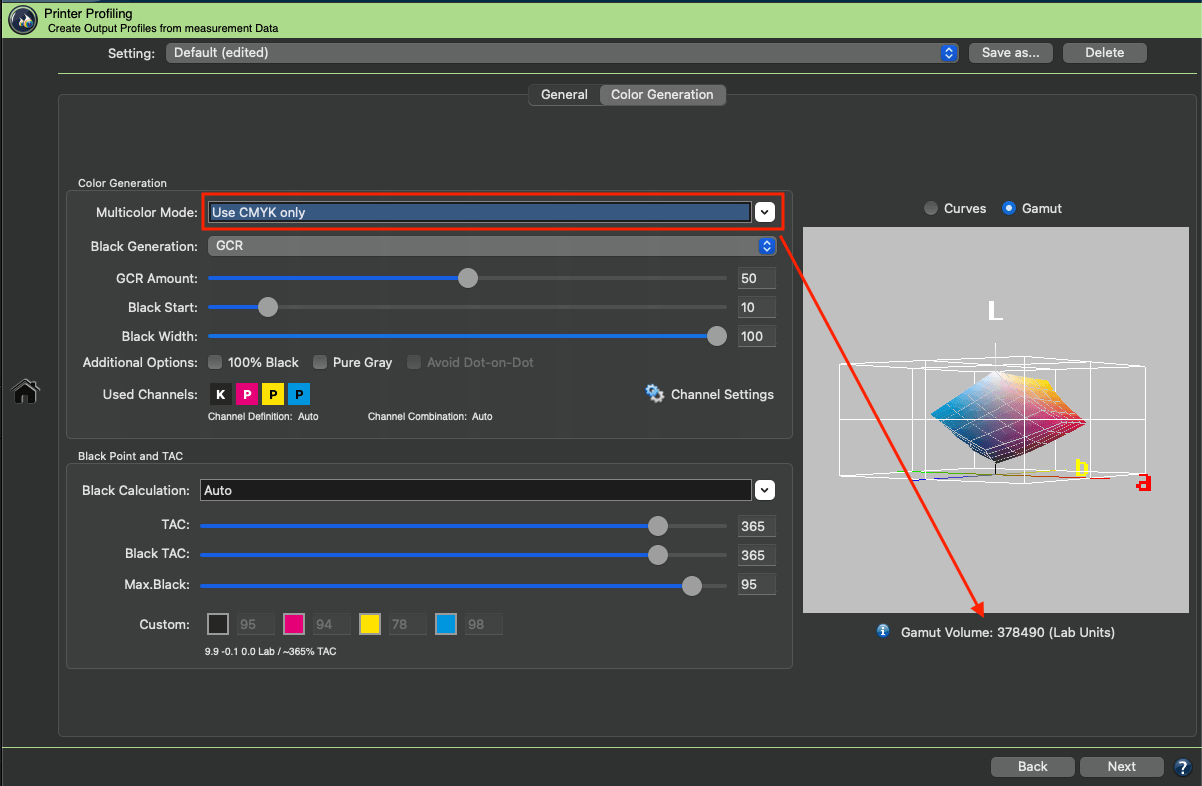
Use CMYK only: Selecting this method results in a Multicolor printer profile that creates the desired number of channels (e.g., 7 channels) but is only composed of CMYK. The color space expanding spot color channels are not used for the separation but are used for the simulation of colors.
Notes:
- In package printing, there is sometimes a request for images and vectors composed of CMYK to be generated with only minimal changes to CMYK values and without spot colors - despite conversion into a Multicolor space. In this case, only spot colors, like Pantone colors, which are present as DeviceN in the PDF should be converted into the large Multicolor space. Such a workflow is possible in two easy steps:
(1) Creation of a separation-preserving CMYK-to-Multicolor DeviceLink profile in CoPrA using the Multicolor method Use CMYK only.
(2) Spot color conversion of the PDF using ColorLogic's color server ZePrA.
- In CoPrA all settings of Color Generation (i.e. the entire tab) depend on black being present in the measurement data. Therefore, black must be present in the measurement data or ICC profiles as fourth channel.
If black is not present in the measurement data as the fourth channel, this channel will be treated as if it were the black channel. As an example, if blue is present as the fourth channel, then all settings in the tab Color Generation will still treat the fourth - now blue - channel as a black channel. In this situation, spot colors can be used for the calculation of the gray balance and the black point.
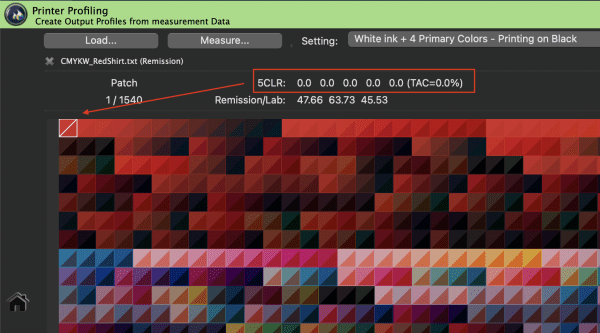
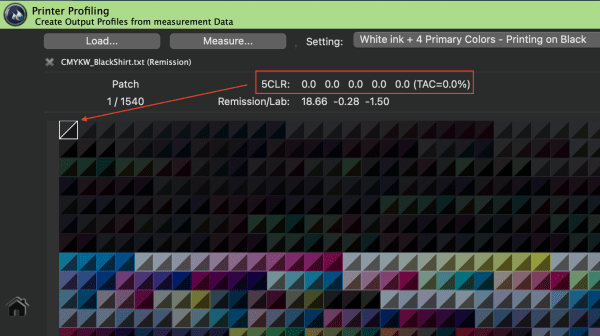
CMY+White: If the measurement data includes White as a color channel in addition to 3 primary colors, this Multicolor Mode must be selected. CMY refers to any 3 primary colors that form a sound color space and include a gray balance. This mode predefines the separation settings to use the color of the background (e.g., the black substrate) and the white ink within the separation. It automatically selects the optimal settings so that all other Color Generation controls are disabled and only the overall TAC can be adjusted under Black Point and TAC.
Please be aware that the resulting ICC profile is a Multicolor profile (4CLR profile).
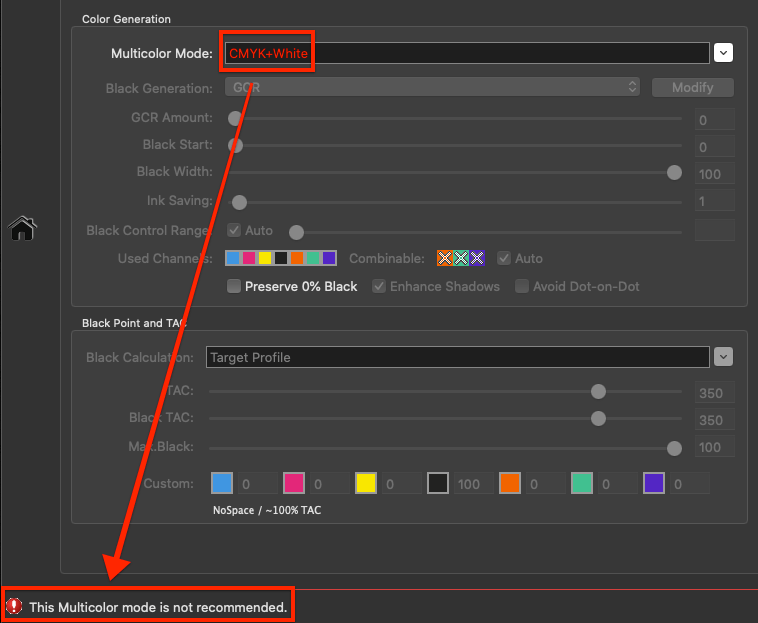
CMYK+White: If the measurement data includes White as a color channel in addition to Black and 3 primary colors, this Multicolor Mode must be selected. CMY refers to any 3 primary colors that form a sound color space and include a gray balance. This mode predefines the separation settings to use the color of the background (e.g., the black substrate) and the white ink within the separation. It automatically selects the optimal settings so that all other Color Generation controls are disabled and only the overall TAC can be adjusted under Black Point and TAC. The assumed black point, e.g., the darkest color, uses a predefined combination of 100% Black printed on the black substrate.
Please be aware that the resulting ICC profile is a Multicolor profile (5CLR profile).
Background: For color managed color prints on black substrates, such as textiles, white ink must be used first and colors must be applied on top of the white ink to obtain colorful graphics.
Note: To create profiles with White, special test charts are required, which can be found in the test charts subfolder Special for the two cases CMY+White_on_Black and CMYK+White_on_Black.
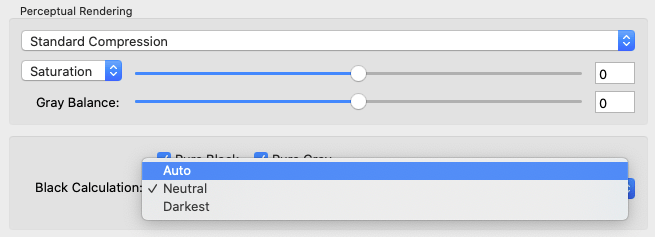
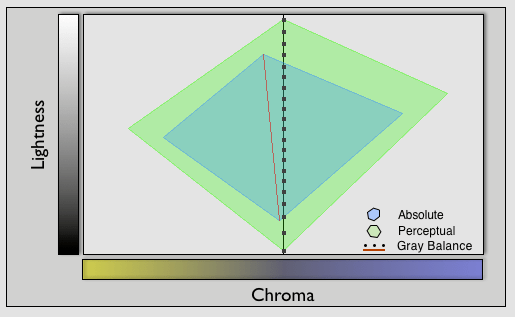
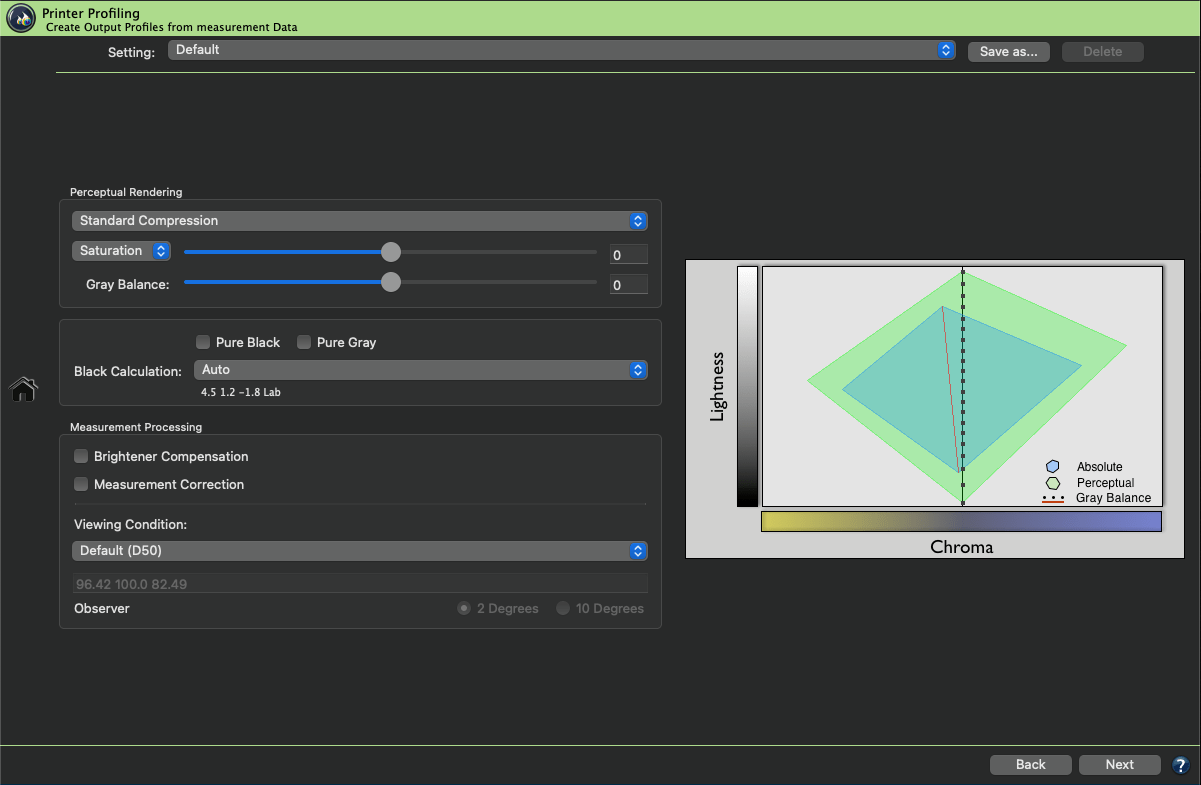
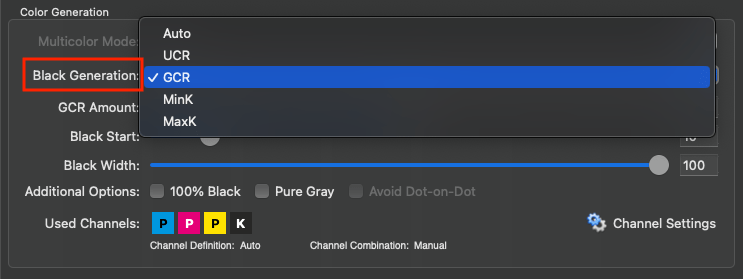
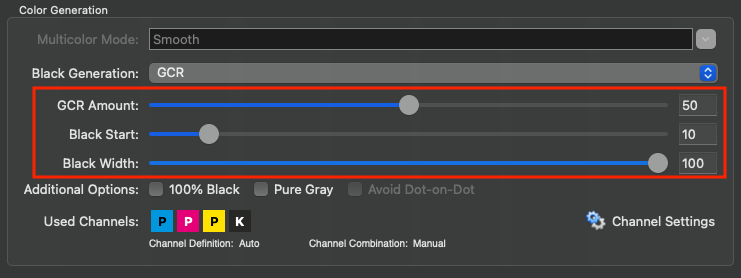
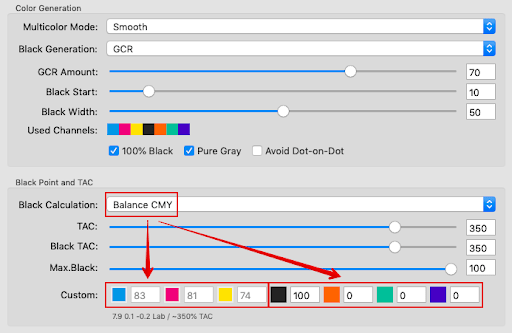
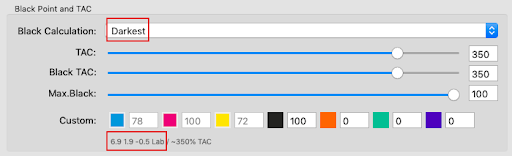
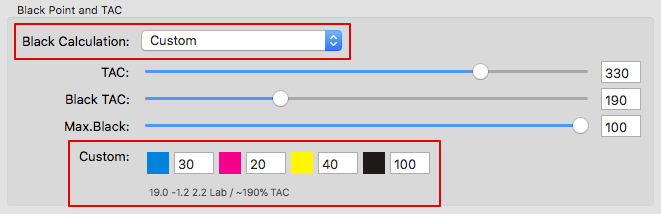
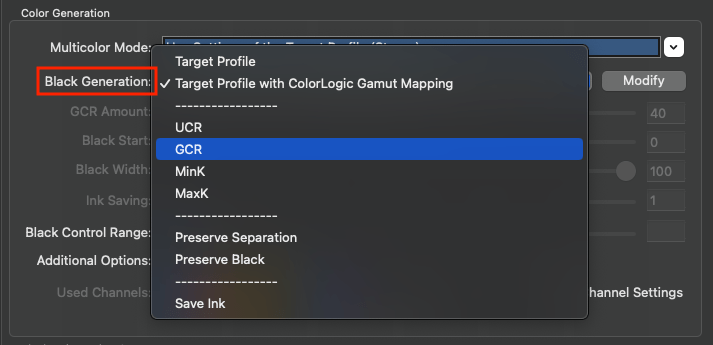
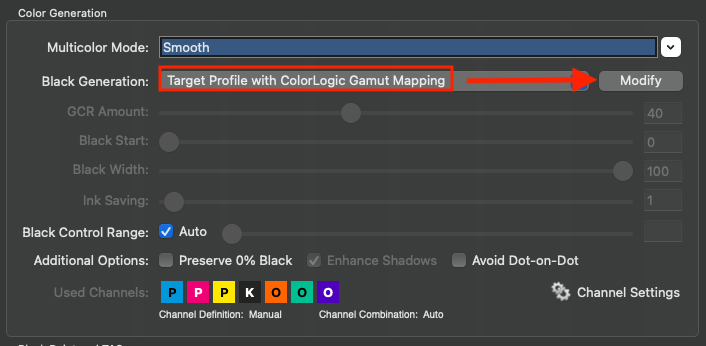
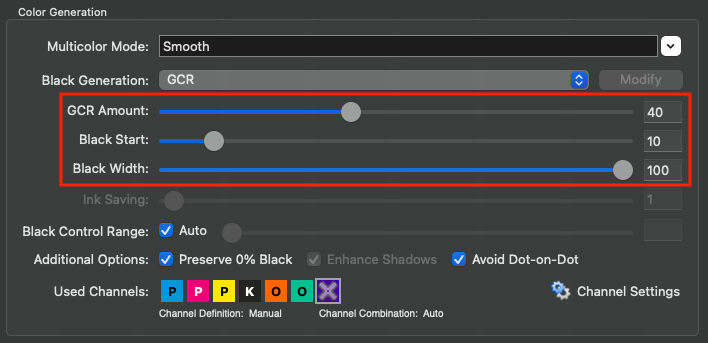
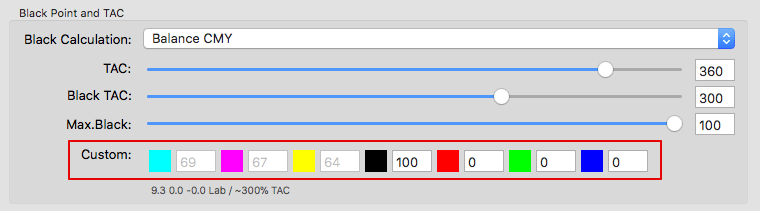
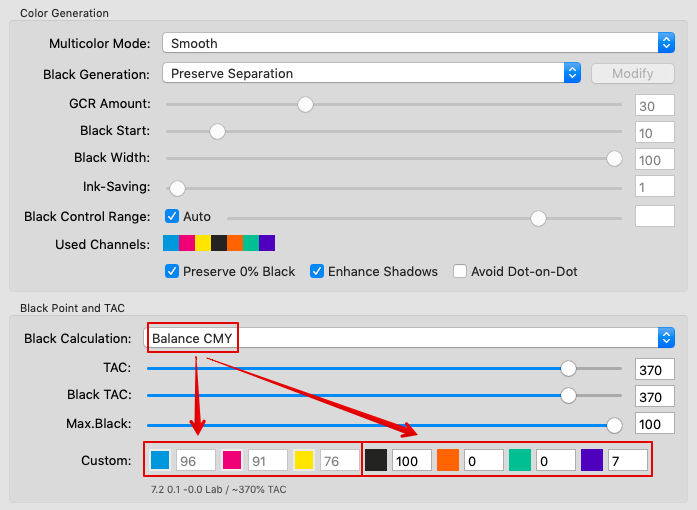
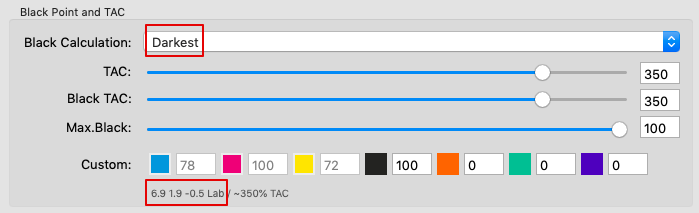
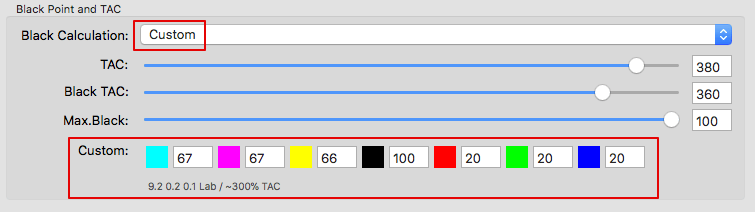
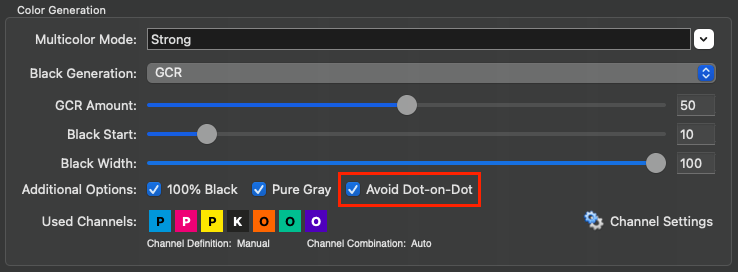
Black Generation: Defines the method for the generation of black in the target color space and therefore influences the separation comprehensively.
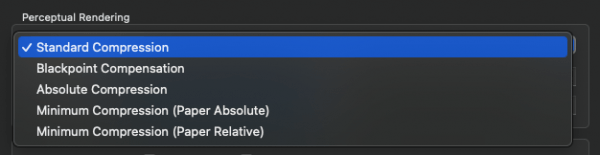
The following modes are available in the drop-down menu:
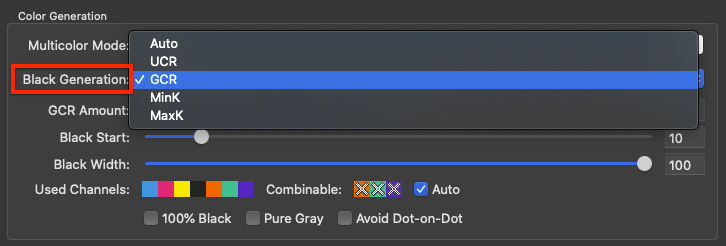
Auto: Uses a medium GCR amount which is based on the measurement data.
UCR: Allows adjustment of the settings Black Start and Black Width.
GCR: Additionally allows the adjustment of the setting GCR Amount.
MinK: Uses only a minimal amount of black and generates a separation using the maximum amount of CMY.
MaxK: Uses a maximal amount of black and generates a separation using the minimum amount of CMY.
The methods UCR, GCR, MinK and MaxK generate a new separation, regardless of the separation of the target profile.
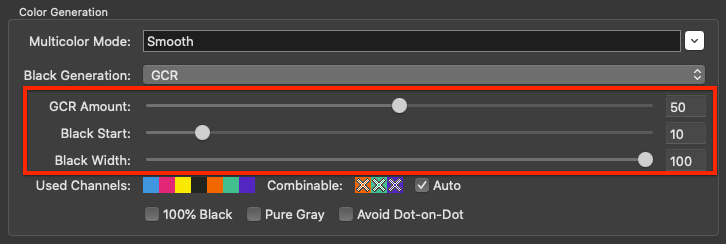
GCR Amount: Defines the amount of CMY that is replaced by black. At 0 only a low GCR amount is used which mainly impacts the shadows whereas at 100 a very strong GCR is used which affects the shadows and the highlights.
Black Start: Defines the starting point for the black generation. Black will be used if the minimum amount of CMY exceeds this limit.
Black Width: Defines the range in which black is generated outside the color-neutral area. The lower the value, the less black will be generated outside the color-neutral area.
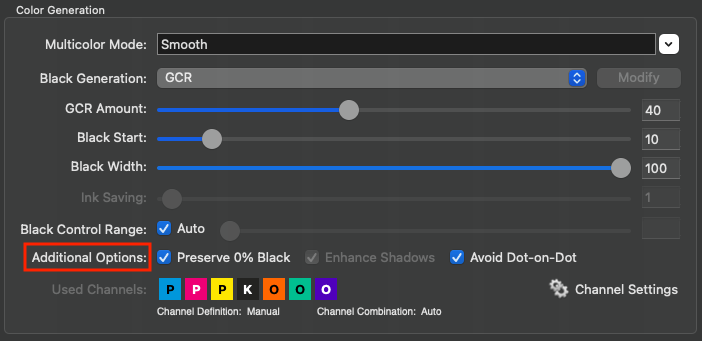
Additional Options
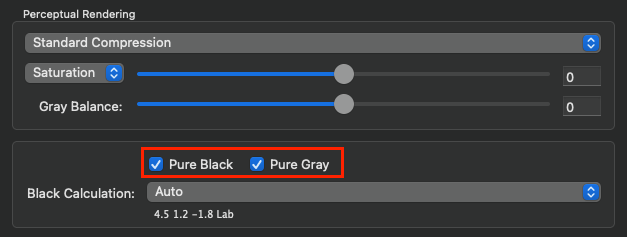
100% Black: Prevents a pure black RGB text from being printed in four colors after conversion into a CMYK profile which would result in a blurred looking text. This is often the case with Office documents. Enabling 100% Black converts an RGB value of 0-0-0 to CMYK 0-0-0-100 (i.e. 100% black).
Pure Gray: Enabling this checkbox in a CMYK printer profile results in a gray balance which is composed of black ink only. However, this only makes sense if the printing system features a very neutral black from shadows to highlights.
Enabling Pure Gray in an RGB printer profile results in a gray balance which is composed of equal amounts of RGB values. This proves to be useful in RGB controlled (inkjet) print drivers.
Avoid Dot-on-Dot: Prevents Black and Violet/Blue color combinations that could produce dot-on-dot effects in AM printing. Replaces some of the Black by CMY, therefore avoiding dot-on-dot effects.
Background: When using gamut extending process colors in traditional AM screening, such as CMYK+Orange+Green+Violet/Blue, the process colors Violet or Blue are often on the same screening angle as Black which can cause dot-on-dot issues leading to color and lightness variances. However, avoiding Black and Violet/Blue color combinations in separations would reduce the available gamut considerably and would also prevent dark bluish spot colors from being reproduced faithfully. By activating this feature, the separation uses more of the CMY colors instead of Black thereby preventing dot-on-dot effects. For this function to work best, use a late Black Start and a rather weak GCR or even a UCR Black Generation setting.
Note: Other color combinations using the same AM screening angles such as Cyan and Orange or Magenta and Green are not affected by this feature as those combinations are rarely used in separations anyway.
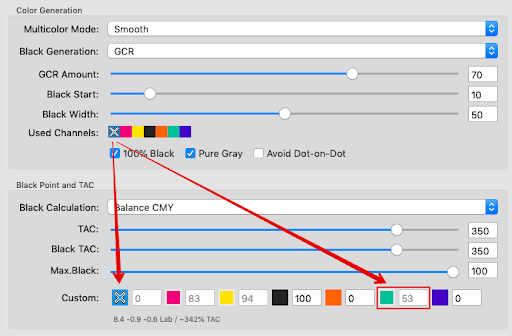
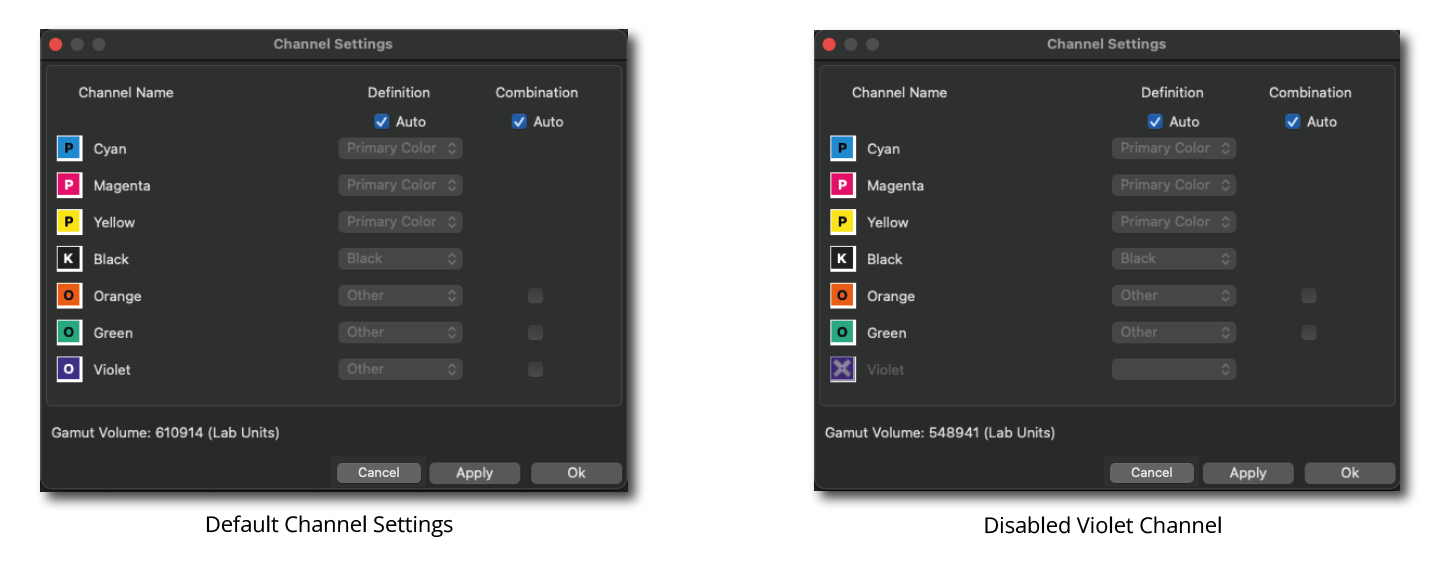
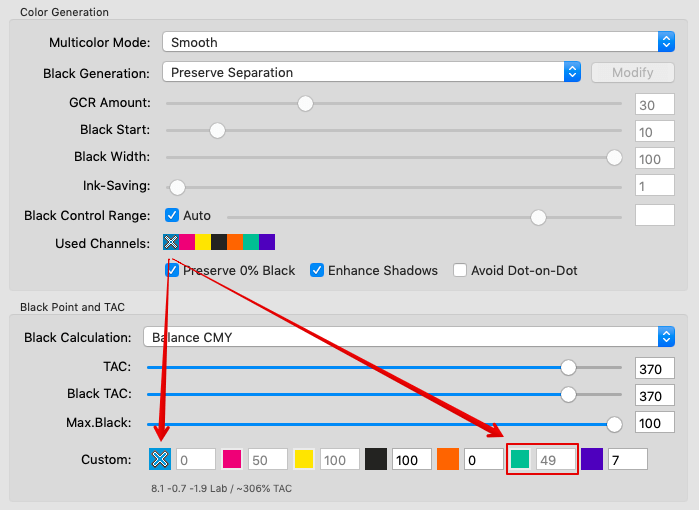
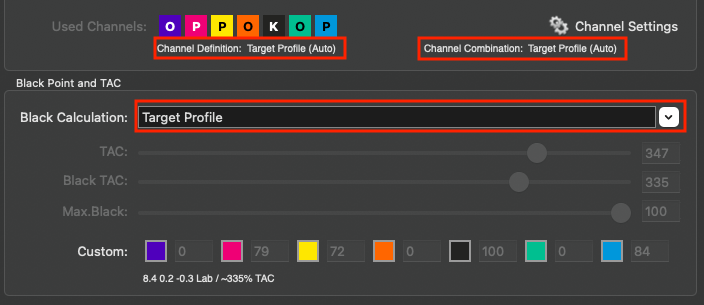
Used Channels: Displays the channels to be used in a profile. Excluded channels are grayed out and marked with an X. All settings that affect channels, such as channel definition, channel combination, or enabling/disabling channels, can be configured in the Channel Settings. This can be done both automatically and manually.

The effect of selecting or excluding colors on Curves and the Gamut is immediately visualized in the graphic and the Black Point value.
Note: The excluding channels function is particularly intelligent for Multicolor profiles, as it searches for replacement colors in the Multicolor channels when excluding a channel (e.g., Cyan), which can compensate for the missing channel in the gray balance. The alternatively calculated Multicolor channels are displayed grayed out in the panel Black Point and TAC (further information can be found in the toggle Black Point and TAC).
Example: If a brown chocolate artwork is intended to be printed in CMYK without using any Cyan in the separation, a CMYK printer profile can be created which only uses MYK. These types of profiles avoid unwanted Cyan dots in the separation and the converted artwork would appear visually close to a conversion with a complete CMYK profile. Obviously such a profile should not be used if the artwork contains Cyan based color combinations, such as cyan tones and blue or violet colors.
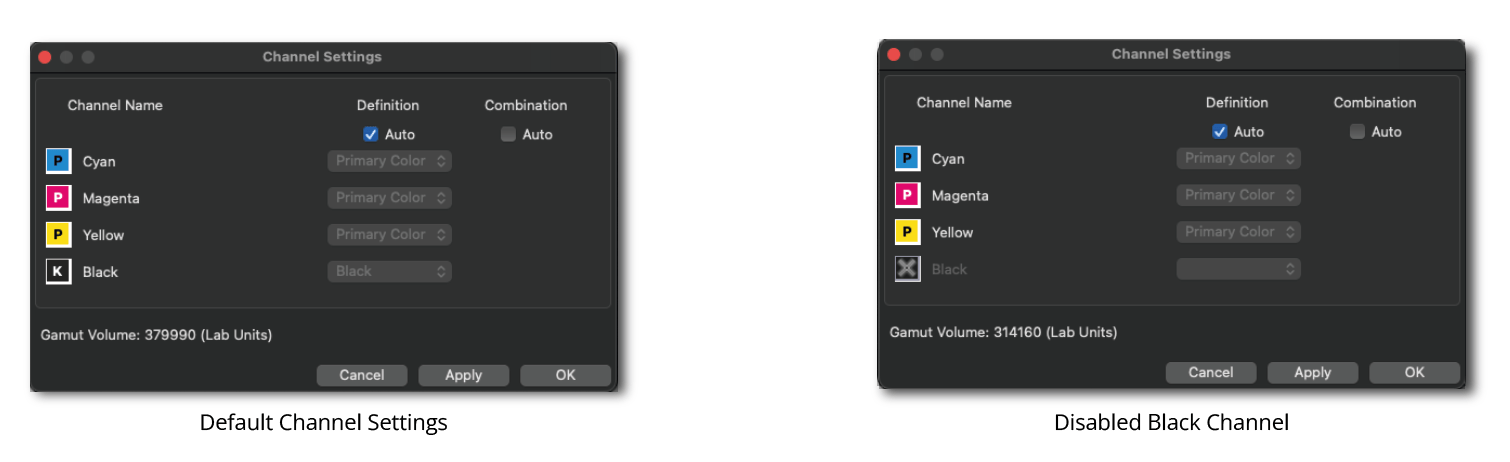
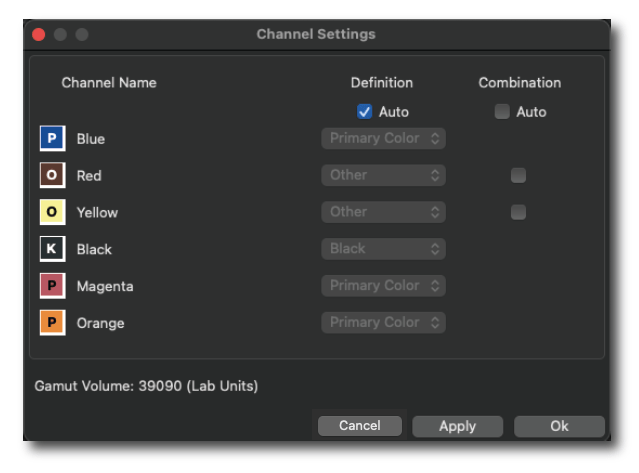
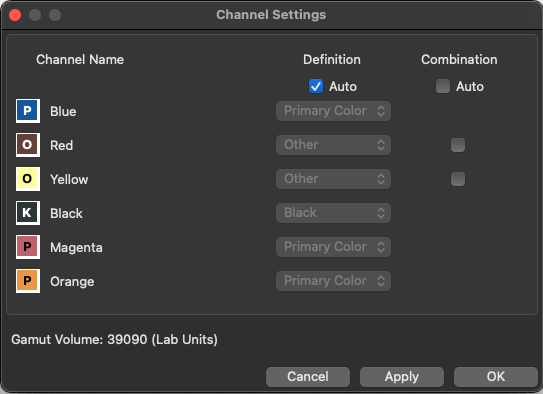
Channel Settings: By default, all channels of the profile are enabled, and all Channel Settings are set to Auto. Channels can be enabled or disabled by clicking on the icon of the desired channel. It is possible to exclude multiple channels.

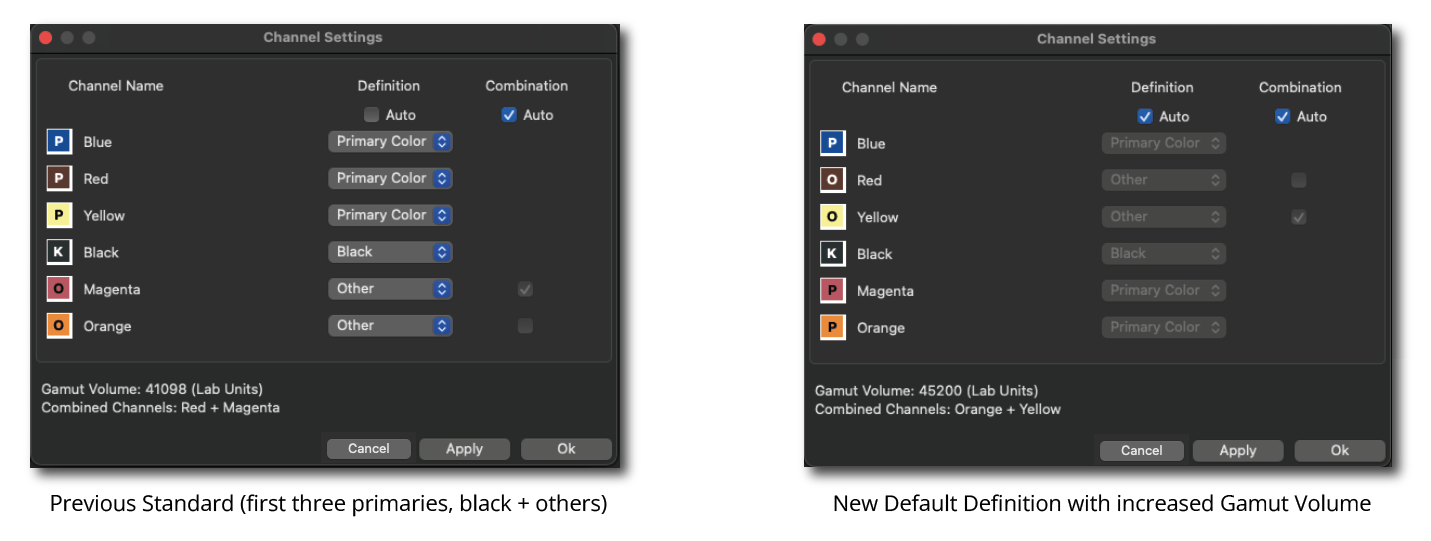
Note: In CoPrA, the default channel order in the measurement data has always been: Three primary colors (P), optional black (K) and optional additional (other) colors (O). This definition was applied regardless of whether the order could be handled correctly or not.
The Channel Settings option allows editing channels that are not defined in the correct order so that they can be used correctly in CoPrA.
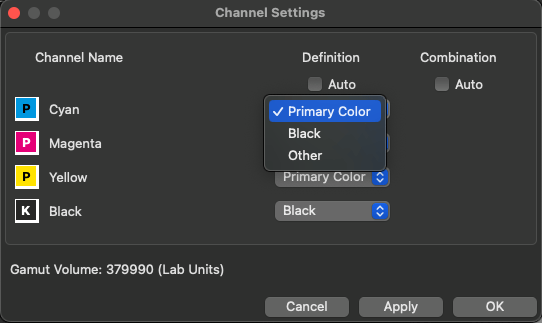
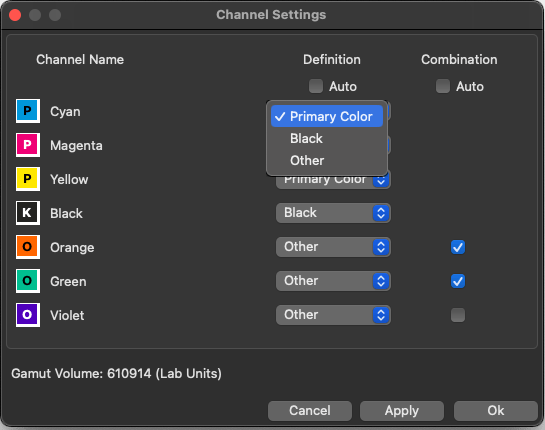
Definition: The channel Definition determines the assignment of the channels, i.e., whether it is a primary color (e.g., CMY), black or another gamut-extending (spot) color. This assignment can be done automatically or manually. By default, the order is set automatically (Auto).

An important element of the channel Definition is the inherent flexibility to achieve the maximum gamut volume from the measurement data used.
Note: There are several reasons why the channel sequence of a file does not match the required print sequence (i.e., the sequence of the inks as they are printed on the press).
Using the Channel Settings, it is possible to temporarily change the channel sequence for internal calculations in order to set the optimum channel sequence to achieve a good profile, but without changing the measurement data itself. Afterwards, the channel sequence in the profile is reverted to the original (required) sequence.
A typical example is the KCMY print sequence in offset printing. Here, black is printed first, then cyan etc., but the CMYK channel sequence is always used in the measurement data and ICC profiles (with K at the end). This is done because CMYK is a defined color space that is correctly interpreted and used in all common prepress workflows, whereas a different channel sequence (such as KCMY), although necessary for printing, would lead to interpretation problems in the prepress workflows.
Furthermore, in some applications, a specific color sequence must be adhered to on printing presses, and the RIP assigns a linearization to this sequence. The profiling chart is then defined and printed based on this sequence.
In other applications, such as ceramic printing, standardized CMYK colors are not used, and a specific sequence is not provided.
In addition, different densities of the colors used can result in colors being swapped to obtain a larger color space (e.g., Magenta and Red).

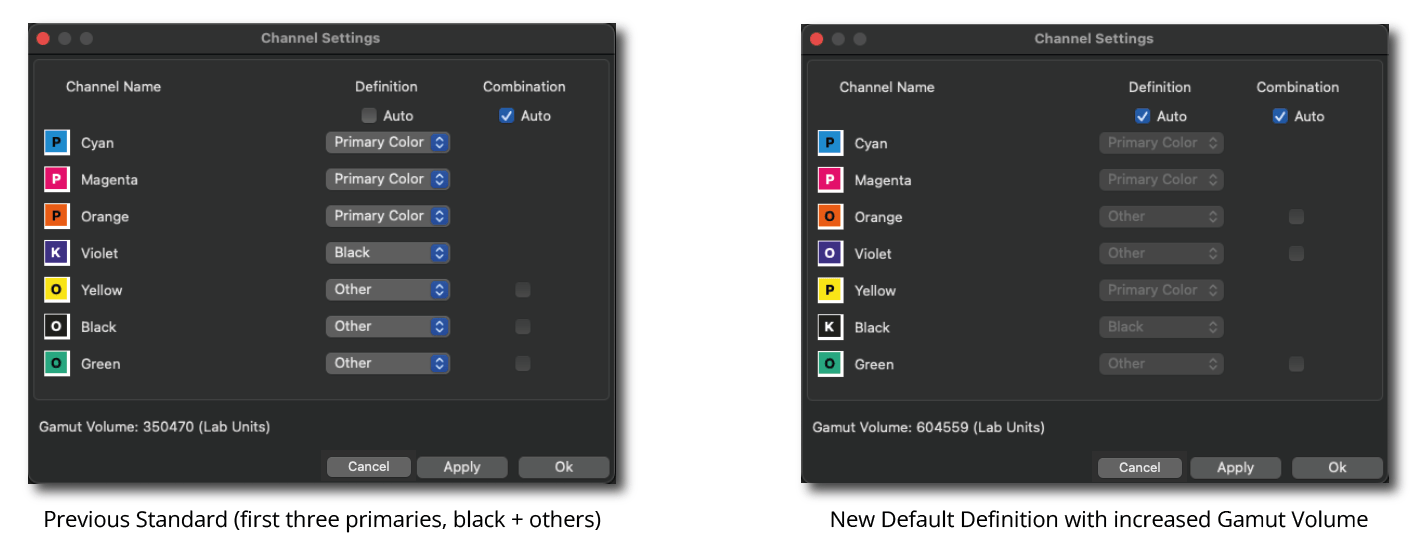
If Auto is enabled, CoPrA automatically calculates and selects the ink definitions and the combinations with the largest gamut. The size of the Gamut Volume and the combined channels are displayed.
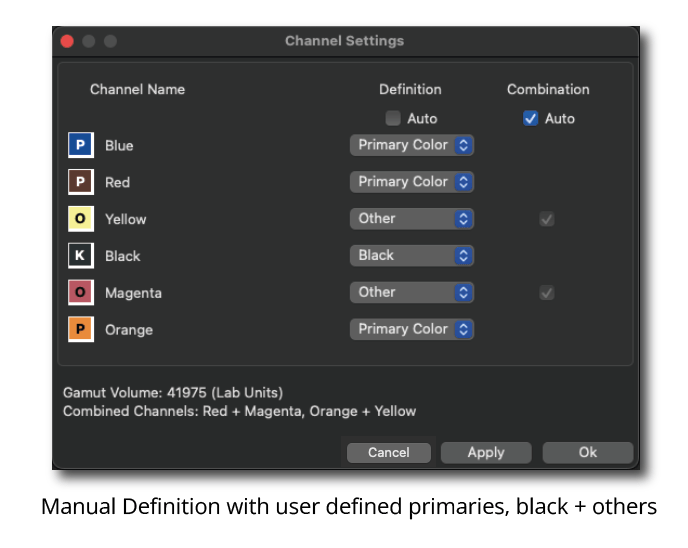
Manual Definition: If required, the channels can be manually assigned a custom definition. There are three options per channel available.

Primary: The data must contain three primary colors.
Black: One channel can be defined as black.
Other: Additional colors get the status Other.
After defining the channels and confirming the settings with Apply the Gamut Volume is calculated and displayed. By clicking OK the changes are applied and the window is closed.
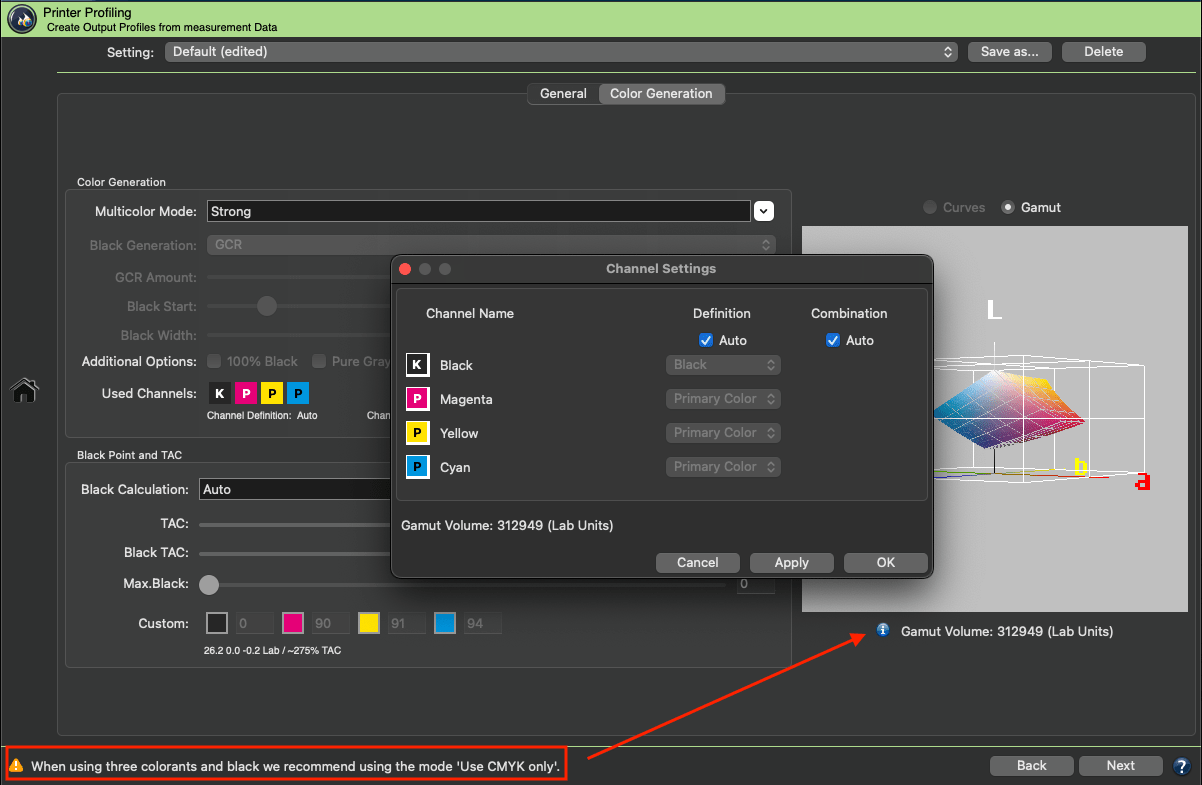
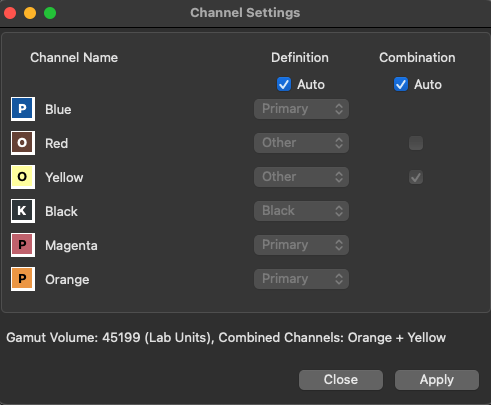
Combination: The channel Combination specifies the Multicolor channels which are to be combined to expand the color gamut. This can be assigned automatically (which is the default for measurement data ≥4CLR) or manually.
Auto: This checkbox is enabled by default for all Multicolor presets. When enabled, CoPrA automatically calculates and selects the ink combinations with the largest gamut and indicates the combined channels. The combined channels are displayed in the Channel Settings window and also below the Curves and Gamut previews. In both previews CoPrA shows the impact of the combined colors by the Gamut Volume number.
If the Auto checkbox is disabled, the channels can be defined manually by clicking the checkboxes of the desired combinable channels. If the additional inks are not to be combined with the four standard inks, the channels of the additional inks can be disabled.
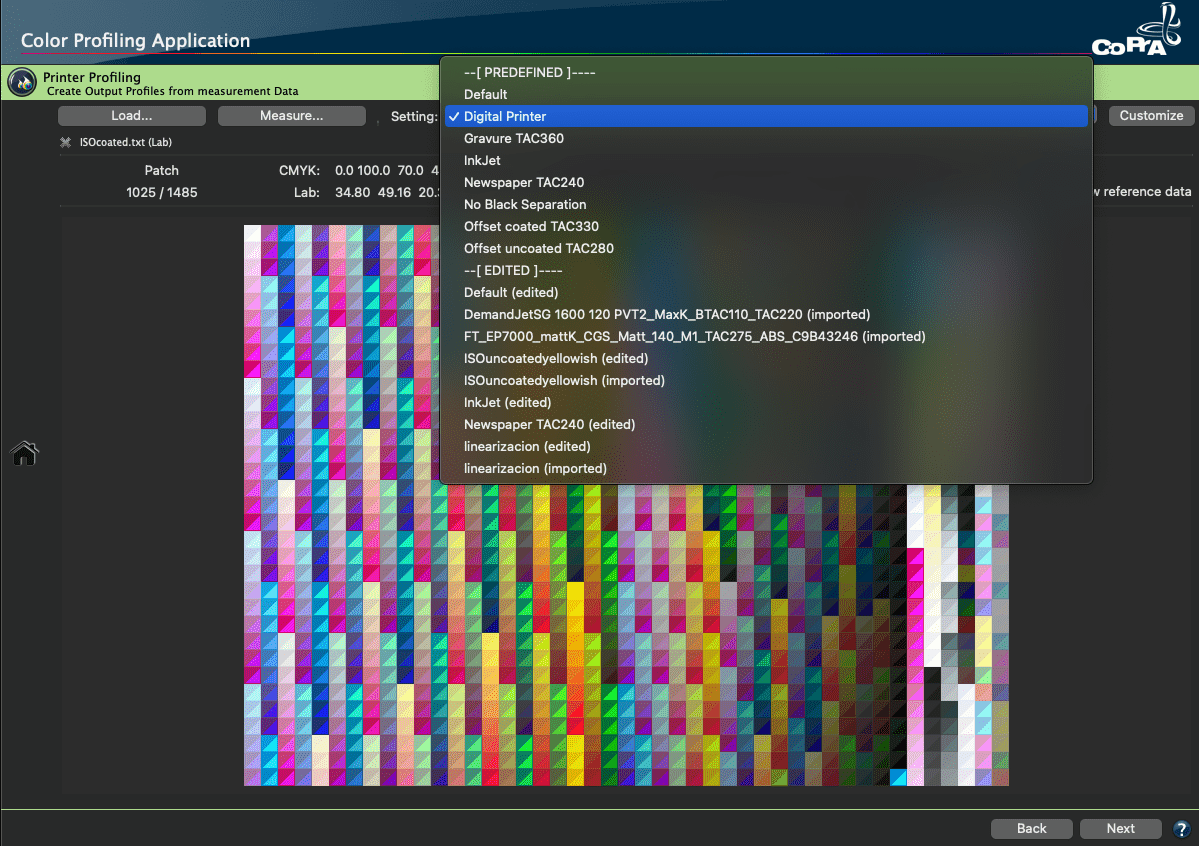
Note: All profile settings, including those from the Channel Settings window, are embedded in the profile, and can be imported and used to reproduce settings by dragging an ICC profile onto the Setting drop-down menu. The name of imported profiles is given the suffix (imported).
Background: The channel Combination option is intended for creating Multicolor printer and DeviceLink profiles used in industrial applications such as ceramic printing, glass or metal decoration or textile printing, with Multicolor inks.
In these industries, special inks different from CMYK are often used in order to increase the color gamut in the shadows and some colorful areas, or to reduce costs.
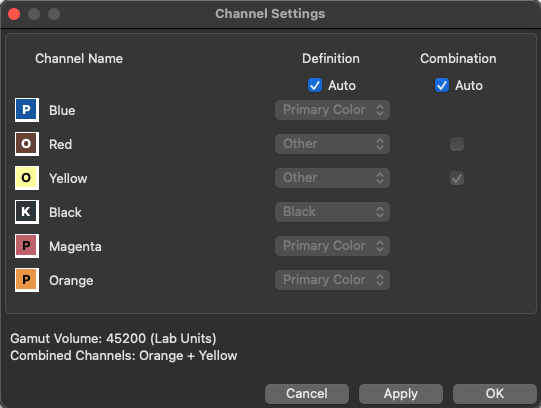
For example, a dark Red ink can be combined with a Magenta ink of similar hue to extend the color gamut in the dark areas of the ceramic print. Similarly, a light Gray can be used in combination with the Black channel in Flexo printing to create a smoother gradient from light to dark grays.
CoPrA 8 and higher automatically detects if additional inks are either typical gamut-extending colors or special inks and will use them accordingly. For example, two inks with a similar hue but different chroma or lightness can be combined in a single channel.
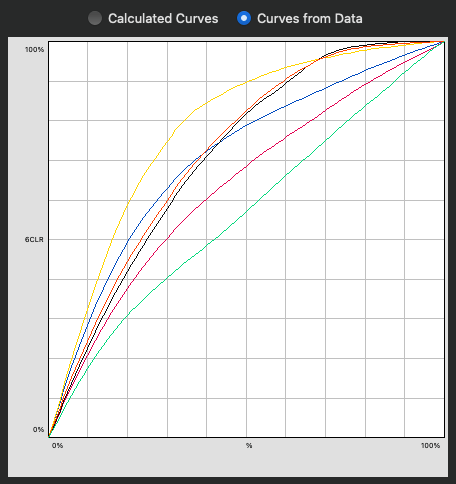
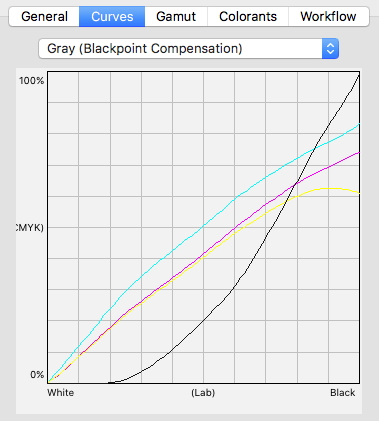
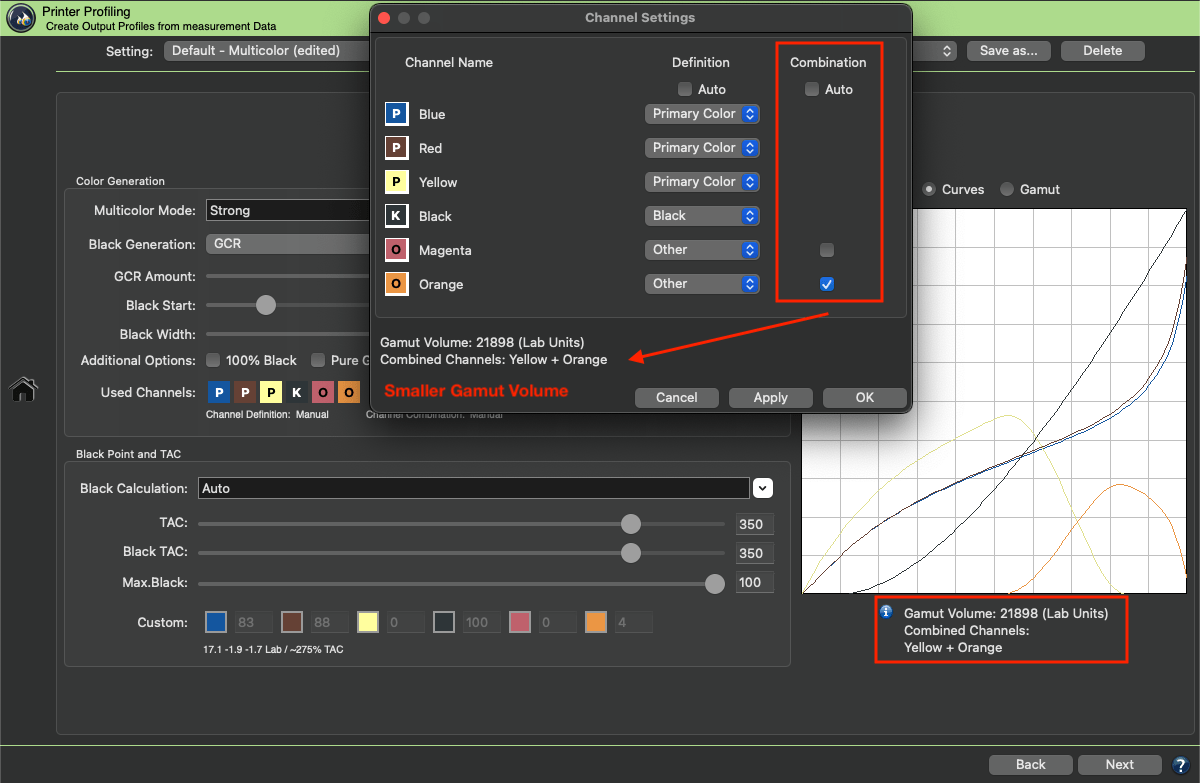
Example: If the Auto checkbox is activated, CoPrA calculates for the 6 color inks of the example data set (see screenshot) that the second channel (Magenta) can be combined with the 5th channel (a dark Red ink) to increase the gamut in the dark areas.

The Curves show that Magenta is used for lighter colors, while more of the dark Red channel is used for darker colors with the Magenta channel being reduced to a minimum.
On the other hand, the 6th channel (Orange) is a typical gamut-extending color and as such is automatically used by the selected Multicolor Mode in the Magenta-Yellow range of the color space.
The Auto function determines the best combination of additional inks and their combination with the 4 standard inks to achieve the largest color Gamut Volume.
Note: Typical gamut-extending colors used in ECG printing such as Orange, Green or Violet can not be combined with the 4 standard inks (CMYK).
In industrial printing, it may be necessary to use combinations other than those recommended by the Auto function. By deactivating the Auto checkbox you can select custom channel combinations, provided that a combination of inks is applicable.
Regarding the example in the screenshot, when the Auto checkbox is deactivated and channels can be combined, Magenta and dark Red are combined, and Yellow and Orange are combined, resulting in two channels under Combination.
If the dark Red channel is disabled under Combination, only the Yellow and Orange inks are combined. Switching to the Gamut view allows comparing the impact of the combinable channels on the Gamut Volume number.

Note: The channel Combination differs from the Used Channels! Channels that are disabled under Used Channels are not used in the separation. Usually, it is recommended to use all channels and not to disable any channel if you want to combine channels.
It is recommended to use the default Auto setting for the channel Definition and Combination, as it automatically calculates and selects the ink definition and combinations with the largest gamut and indicates the combined channels.

In our example the Magenta and Orange channel will be used as a Primary Color and Yellow is now combined with Orange.