ZePrA | Interface

User Interface

Operation and Special Features

Sidebar

ZePrA’s sidebar allows quick access to all main workflow functions. Simply klick the Home button on the left and select the required module.

The colored bar below the title bar shows the tool you are currently using.

Start

Auto Setup

Create workflows with ZePrA’s Auto Setup Wizard

Main Setup and Overview

Overview 

View queues, pending jobs and processed jobs

Configurations 

View and customize processing settings

Queues 

Manage print jobs

Tools

Spot Color Report 

Check the accuracy of spot color conversions prior to printing

SaveInk Report 

Generate an overall ink saving report

Extract ICC Profile 

Extract ICC profiles from images and PDF files

Global Settings

Spot Color Libraries 

Manage libraries and edit spot colors

Gradations

Manage and create tone value correction curves

Profile Assignments 

Use existing or dynamically created DeviceLinks for file conversions

Menu Bar

Navigation

Use the shortcuts in the menu to navigate easily and conveniently through all ZePrA modules.

Access the most important modules via shortcuts

Tools

ZePrA’s Tools menu

Auto Setup
Calls the Auto Setup Wizard.

Importing and Exporting Configurations

The import/export function can be used either to transfer a ZePrA installation with all settings from one computer to another or to exchange single or multiple configurations between different ZePrA sites.

When exporting and importing configurations, the association of the configuration with a queue is also considered. If a configuration is imported that is assigned to an existing queue, the new configuration is linked to the existing queue.

Export Configurations: Opens the Export Environment window. The configuration sort order can be changed using the icon to the right of the list of configurations:

  • Sort Order: Default – sorts the list of configurations by its IDs from lowest to highest number in the same order as in the Queues section of the Overview A manually changed order of Queues in the Overview is reflected in the configurations sort order. Therefore, the Default sorting is not necessarily only sorting by creation date.
  • Sort Order: Name (A-Z) – sorts the list of configurations alphanumerically with numbers on top followed by the alphabets.
  • Sort Order: Modification Date –the last modified or created configurations are on top of the list.

Select the configuration(s) you want to export by activating the corresponding checkbox(es).

Exporting selected Configurations

Export All Configurations: Exports all configurations including the ICC devices and DeviceLink profiles used. Activate the respective checkboxes to Export Profile Assignments and to Export Spot Color Libraries.

File type: Configurations can be exported as Configuration Files or Job Control Files.

Configuration Files(*.ccf): Typically, when exporting configurations, the exported settings are shared with other ZePrA installations or act as a backup. The preferred and correct file format for such cases is the ZePrA *.ccf file format which is selected by default.

JSON Job Control File(*.json) and XML Job Control File(*.xml): These file types are used in relation to the Job Control File functionality. They are intended for developers and script writers who want to understand the syntax of the Job Control File and use it for their purposes.

The exported settings basically include all the pure options of the exported configuration.

Note: Exporting configurations as *.json or *.xml files is only available for individual configurations and only if all checkboxes for profiles, spot colors, etc. are disabled in the Export Environment dialog.

Export all configurations. Profile assignments and spot color libraries can be exported along with the configuration.

Export ICC Profiles: Exports all ICC device profiles and DeviceLink profiles used in the selected configuration(s).

Export Profile Assignments: Exports all settings including the profile table created under Profile Assignments, however this does not export the DeviceLink profiles created in SmartLink.

Export Spot Color Libraries: If individual configurations are selected, only those libraries which are used in the selected configurations will be exported, if Export all Configurations is selected, all libraries will be exported.

Export Media Wedges: Exports the media wedges of the selected configuration(s).

Click OK, enter a filename and Save the *.CCF file including the configurations and ICC profiles. Subsequently, the window Information provides information about license terms regarding the import and export of ICC and DeviceLink profiles.

License agreement notes

Importing Configurations

    1. There are two ways to import configurations: By dragging and dropping the configuration (*.CCF file) into the Queues section of the ZePrA Overview dialog (fast way), or by selecting Import Configurations from the Tools menu (slower way). In this case, the Import Configurations dialog opens.
    2. Choose the desired configuration file under Import File with the Select button.
      Note: With the drag-and-drop method, the imported configuration is immediately displayed in the upper display section.
    3. Select the Desired Base Folder. The hot folders of imported queues will be created inside this folder when importing the configuration.
    4. By clicking the Preview button, the files and settings of the CCF file(s) are examined and listed in detail before they are actually imported. This allows for inspection of the profiles that will be imported, spot color libraries, media wedges, configuration and folder names, and the locations of those folders.
    5. Configurations that already exist in the import system are marked with an asterisk (*). Disable the checkbox to prevent these configurations from being imported and overwriting existing configurations.
    6. Click Start to begin importing the configuration. Once the import is started, the progress is displayed in the preview area. All executed and failed operations are listed.

    Note: Imported configurations are inactive until activated in the Overview window.

    Use Paths from imported File: Activating this checkbox preserves the original hot folder paths of each configuration.
    Note: Sometimes folders cannot be created exactly the same as the original exported configuration – for example, if the configuration was exported from a Windows system and is imported to a Mac system, or vice versa. In such cases, an orange warning icon will be displayed in front of the folders, and it is shown where the folders will be located after importing. Usually, the default folders (Input, Done, Output, Error) are then created in the ZePrA Base folder.
    There may also be warnings for profiles if a profile already exists and will be overwritten. In addition, a red warning may appear if an operation cannot be performed at all, for example, if a CCF file is corrupted.

    Profile assignments: Activate the checkbox to import profile assignments. If the CCF file to be imported does not contain any profile assignments, the checkbox is grayed out.
    Note: Profile assignments are a special general option in ZePrA to use bespoke DeviceLinks for specific color conversions instead of using SmartLink or other color management settings.
    Importing profile assignments can result in many additional profiles being installed, which may not be wanted. The profiles that will be installed are displayed after activating the checkbox Profile assignments and clicking the Preview button. It can then be decided whether the profile assignments and all associated profiles are to be installed or not. However, profiles included in the configurations selected for import are not affected by this option and cannot be deselected.

      Extract ICC Profile
      Extracts the embedded profile from images and the output intent from PDF/X files. The extracted profile can then be saved to any location.

      Install DeviceLink Profiles
      Opens the DLS Manager. The DLS Manager is used to install and update DeviceLink sets (DLS). License keys for the required sets can be purchased from your ColorLogic dealer. With a demo installation, all or individual sets can be installed and tested. Please note, however, that demo profiles installed during a demo can no longer be used on a permanent license for ZePrA. The DeviceLink sets will be available for further use after they are purchased.

      SaveInk Report
      The SaveInk report provides a detailed overview of the color savings of all SaveInk queues and processed jobs.

      Spot Color Report
      The Spot Color Report shows which results are achieved with a spot color conversion in respect to deltaE00, deltaE76 and separation into the process colors. This allows to verify the accuracy of the spot color conversion before printing and to determine in advance how spot colors (e.g. Pantone® colors) of specific PDF and image files will be converted by ZePrA.

      Spot Color Iteration
      Deviations from the theoretically achievable minimal color differences are caused by printing, material and color variations during production.
      Deviations can be minimized in ZePrA using Spot Color Iteration. This feature is primarily for particularly high demands of accuracy and reproduction of spot colors, for example for digital printing or proofing, which require the conversion of spot colors to process colors.
      The Spot Color Iteration tool provides a step-by-step guide starting from the selection of the spot colors being iterated, preparation and printing of measurement of test charts and finally, optimization of  the conversion, including the creation of reports.

      DeviceLink Iteration
      An iteration can be necessary to achieve the best possible color match, especially when proofing. To apply an iteration, a special test chart must be converted with the desired color management settings of a given configuration, printed and measured. Based on the measurements the DeviceLink profile can then be optimized. After one to three iteration cycles, a closer match in terms of DeltaE values is achieved. This process is error-prone if done manually, however, it is easy to accomplish with the help of the DeviceLink Iteration Wizard, which guides you through each step.

      Tag Management
      All existing tags are listed in a table under Tag Management. It can be opened via the Tools menu and is especially useful if tags are to be edited or removed from several configurations. The Used in column indicates how many configurations use a tag. With the buttons on the right New tags can be entered and existing tags can be removed (affects all configurations) or renamed (also affects all configurations).

      Server Settings
      ZePrA 9 and higher has an integrated Push-2-ZePrA remote server, while the Push-2-ZePrA Photoshop extension acts as a client application that can access ZePrA from a remote Photoshop installation over the network.

      Therefore, several users, who have the Push-2-ZePrA extension installed in their Photoshop application, can remotely access the same ZePrA server. The Photoshop clients can thus be used on different computers, but also under different operating systems than the ZePrA server.

      The detailed server setup procedure is described under Push-2-ZePrA > Connecting Push-2-ZePrA with ZePrA over the network.

      DeviceLink Iteration

      Overview

      Iteration can be necessary to achieve the best possible color match, especially when proofing. To apply an iteration, a special test chart must be converted with the desired color management settings of a given configuration, printed and measured. Based on the measurements the DeviceLink profile can then be optimized. After one to three iteration cycles, a closer match in terms of DeltaE values is achieved. This process is error-prone if done manually, however, it is easy to accomplish with the help of the DeviceLink Iteration Wizard, which guides you through each step.

      Video Tutorial

      Overview of the DeviceLink Iteration Wizard in ZePrA.

      Procedure

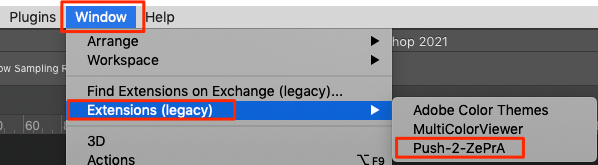
      The iteration starts by selecting the configuration containing the DeviceLink to be iterated. This can be done in three different ways:

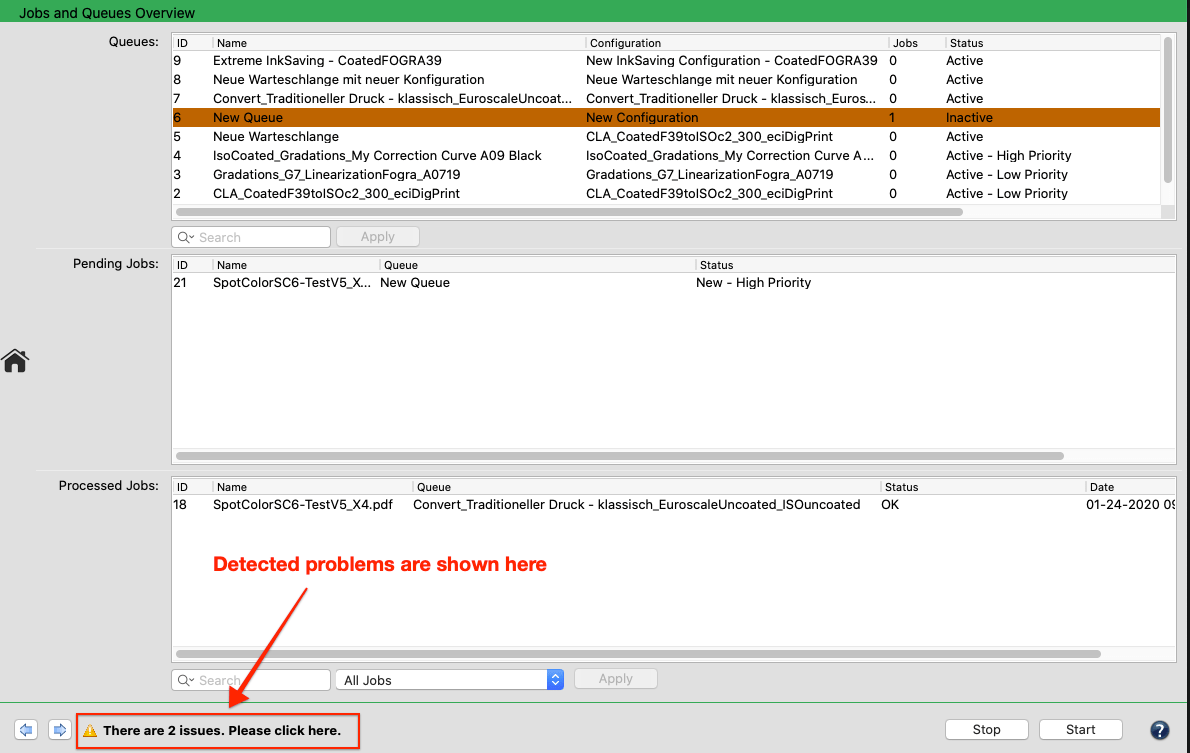
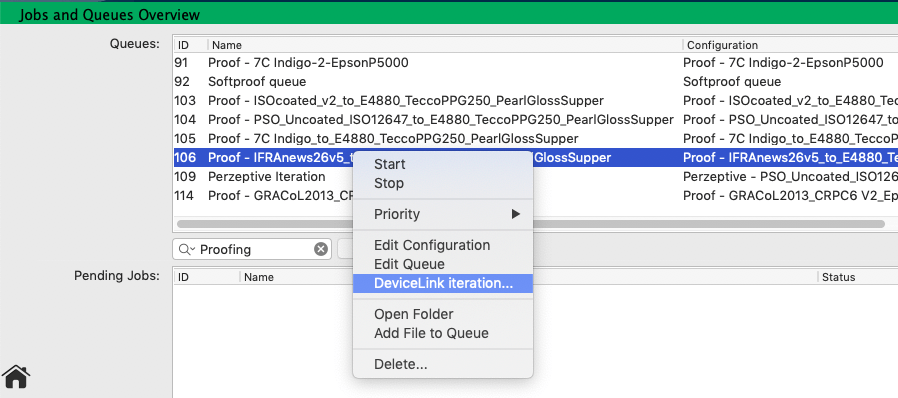
      1. In the Queues section of the Overview, select the queue and configuration you want to iterate. Open the context menu with a right click and select DeviceLink Iteration.

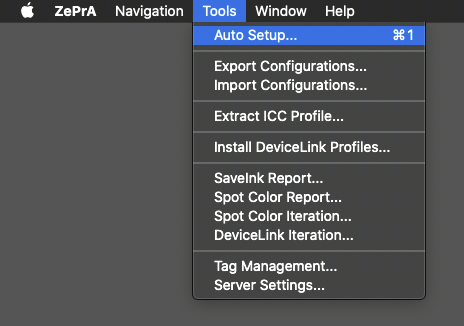
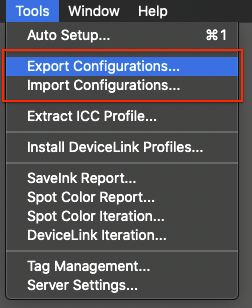
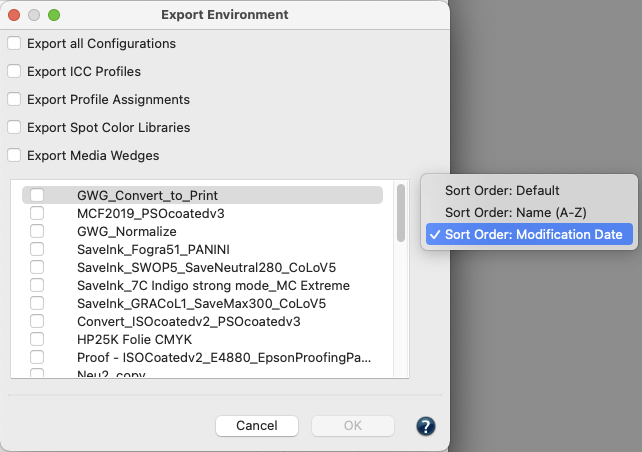
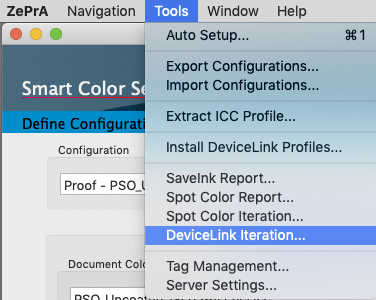
      2. Select DeviceLink Iteration from the Tools menu and search for the desired configuration in the Configuration drop-down menu of the appearing DeviceLink Iteration Wizard. You can use the same search and sort functions that you are familiar with from the Configuration drop-down menus elsewhere in ZePrA to find the configuration you are looking for.

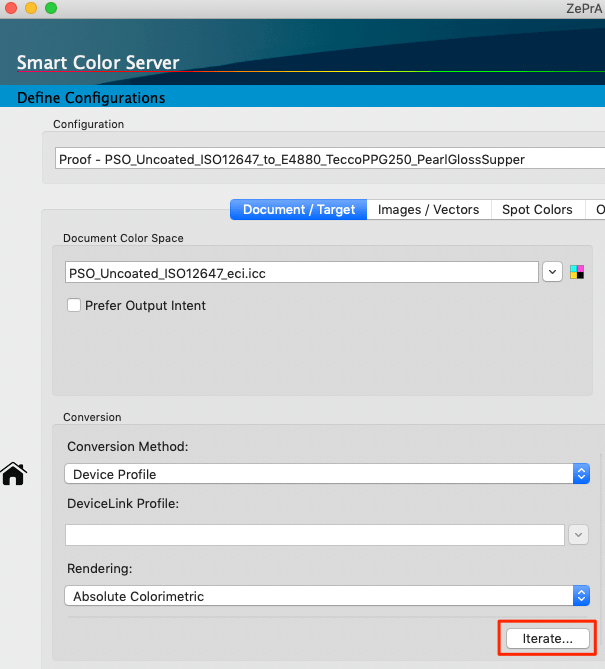
      3. Open the desired Configuration in the Document/Target tab and click on the Iterate button at the bottom of the Conversion section.

      The DeviceLink Iteration Wizard dialog consists of two tabs, the Current Iteration and the Archive tabs. The Current Iteration tab contains the actual iteration wizard and typically, if a configuration is selected that has not yet been iterated, the wizard is started directly there. The Archive tab contains all the iteration steps that have been carried out, including all the evaluation details.

      Current Iteration

      The wizard guides the user through the iteration process in these four steps:

      1. Create test chart to be printed
      2. Print and measure test chart
      3. View Evaluation Results
      4. Continue or end the iteration

      Step One: Create the test chart to be printed

      There are two possibilities to create the test chart. Either you use the included Default Iteration Chart, which of course is always optimized for the color space of the given configuration. Or, select your own reference file (TXT, CXF3, XML) of a custom chart under Custom Iteration Chart.

      After that, define your measurement Instrument Settings. Various settings for the supported measurement equipment can be selected from the drop-down menu in the Measure Tool (the Measure Tool is included in ZePrA).

      Note: ColorLogic ColorAnt users can create their own instrument settings optimized for their specific requirements in the Export Chart tool.

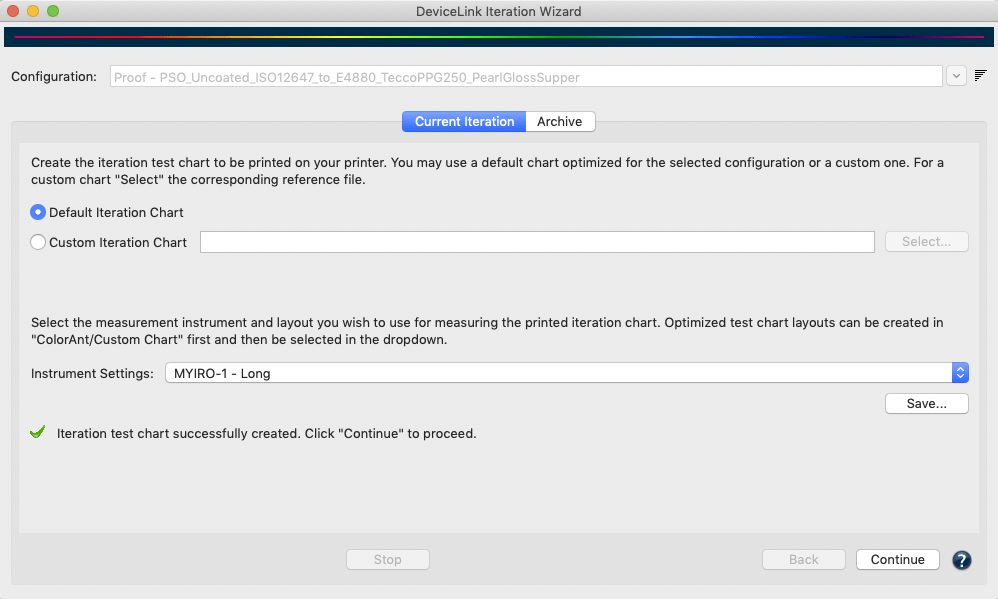
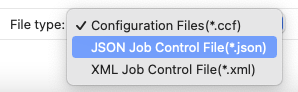
      Click Save and choose a file format (PDF, TIFF or PSD) to create the test chart in the selected location. All color management settings of the configuration will be applied automatically.

      Note: In some cases the creation of the chart may take some time, for example if the Conversion settings SmartLink or Device Profile are used in the configuration, as the wizard will then need to create a DeviceLink profile first.

      After you successfully created the chart and the associated reference file, a message and a green check mark indicate that you can now proceed to the next step by clicking the Continue button.

      Step Two: Print and measure test chart

      The second step consists of two operations. First, the chart created in step 1 must be printed on the printer without color management settings. Then, after drying, the print must be measured. If the Measure Tool is to be used, simply click on the Measure button. You do not need to worry about the reference file and layout, as this is already preselected within the Measure Tool. Instructions on how to select your device and make measurements using the Measure Tool can be found here.

      Note: Alternatively, you can use the previously exported reference file and measure your printed chart with a different measurement tool. Make sure that the measurements are saved in standard file formats that can be read by ZePrA, such as CGATS TXT, XML or CXF3. The external measurement files can be loaded using the Load button.

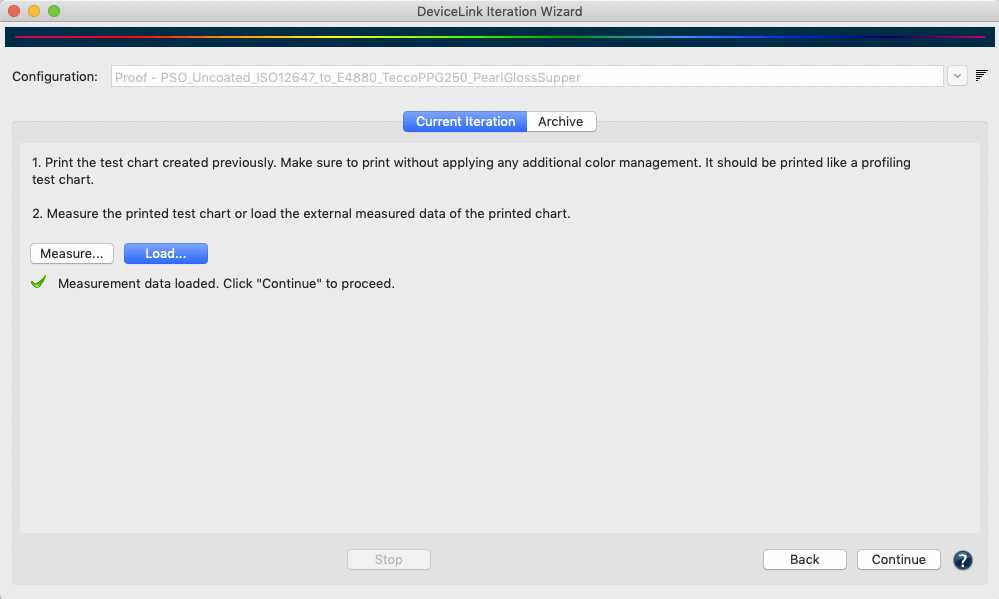
      Once the measurement data has been transmitted from Measure Tool or loaded from external sources and it conforms to the printed chart a green check mark indicates a match and you can proceed by clicking Continue.

      Note: When loading measurement data that does not match the chart layout or the corresponding patches in the reference file, you are alerted by a warning message and proceeding to the next step is not possible.

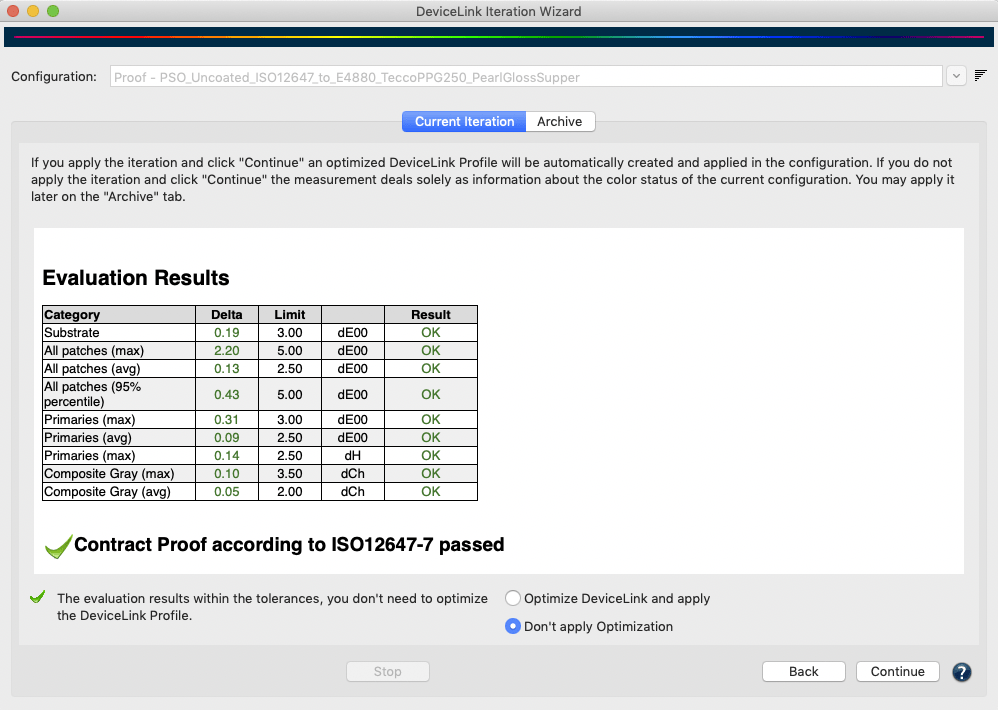
      Step Three: View Evaluation Results

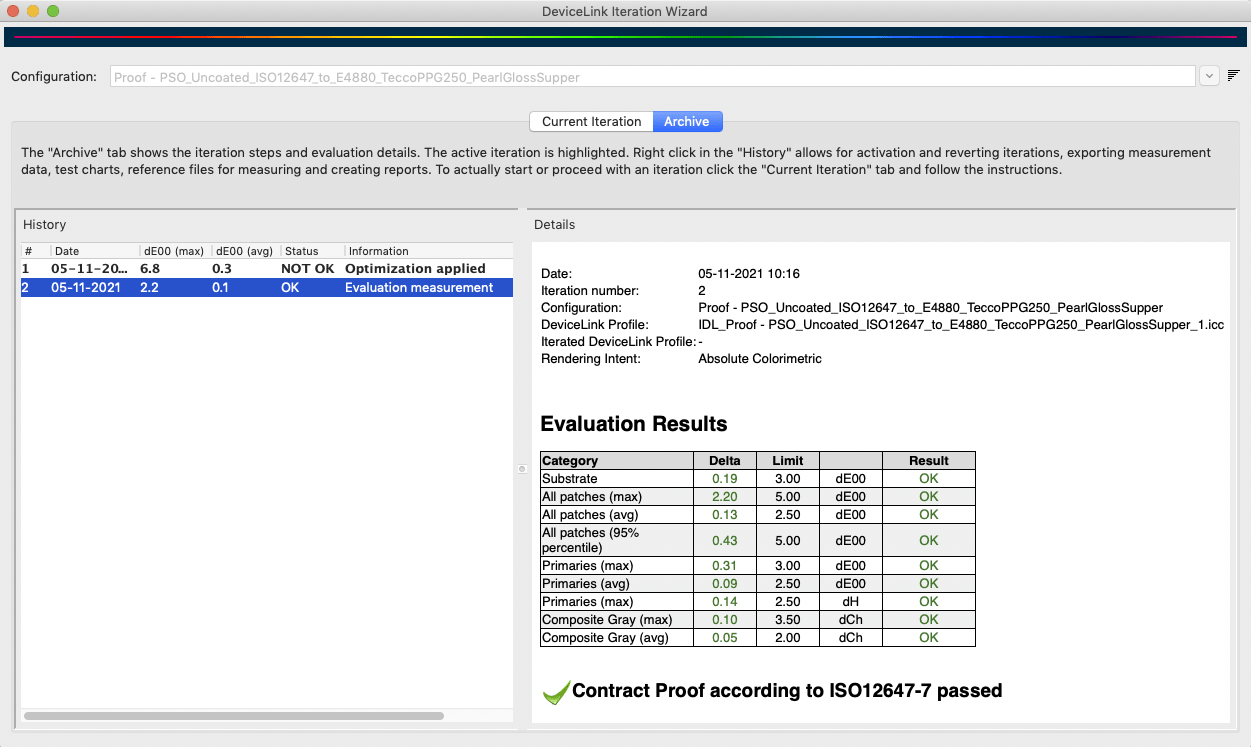
      The third step shows the Evaluation Results of the measurements compared to the desired color conversion.

      If all categories such as substrate, the maximum and average deltaE for all patches, etc. are within their limits they are marked green and the overall result is marked all right.

      In a proofing case, e.g if an absolute colorimetric rendering intent was used in the configuration, the proof print is compatible with a Contract Proof according to ISO12647-7 and the wizard indicates this by a green check mark and a corresponding note text. A further iteration is then not required, hence the Don’t apply Optimization radio button is preselected.

      However, the preselection can be overridden and another iteration cycle applied if the results are to be improved even further. To do this, select the Optimize DeviceLink and apply radio button and click Continue. Alternatively, apply the iteration later via the Archive tab.

      If only a single category is displayed in orange or red in the table of Evaluation Results, the proof print is considered to be not okay and the validation has failed. In this case, a warning is displayed and it is suggested to apply an iteration to improve the result. The corresponding radio button Optimize DeviceLink and apply is then preselected.

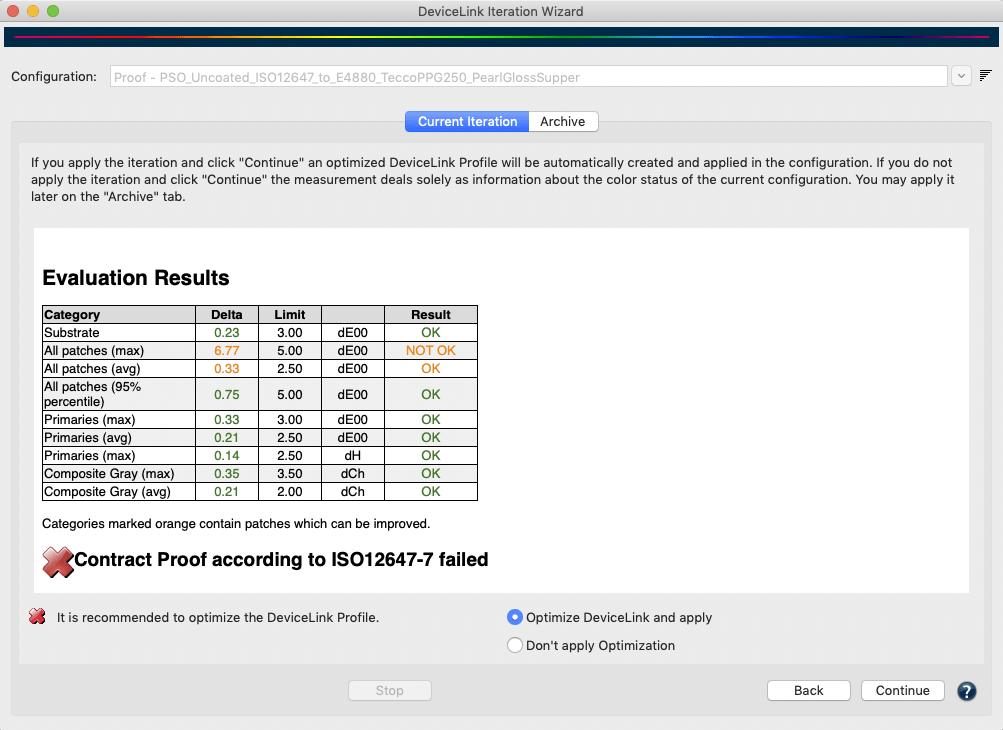
      By selecting Optimize DeviceLink and apply and clicking on Continue, an iterated DeviceLink is created on-the-fly and automatically entered in the configuration.

      ZePrA checks for out-of-gamut colors and evaluates whether those colors can be improved. Color values that are displayed in red in the Evaluation Results and Report are considered to be out-of-gamut and their deltaE00 values can most likely not be improved. Nevertheless, an iteration can slightly change the rendering of out-of-gamut colors, for example, to correct hue errors when colors are far from the desired hue. Color values that are displayed in orange, however, can be improved with further iteration. If there are only red values left, ZePrA informs, that further iterations are of no use and preselects the Don’t apply Optimization radio button. If, however, there are orange values left, these can be further optimized and ZePrA suggests Optimize DeviceLink and apply.

      Step Four: Continue or end the iteration

      The fourth step concludes the iteration cycle. Here, there are three options to choose from. Based on the previous results, the wizard already preselects a logical option for you to follow:

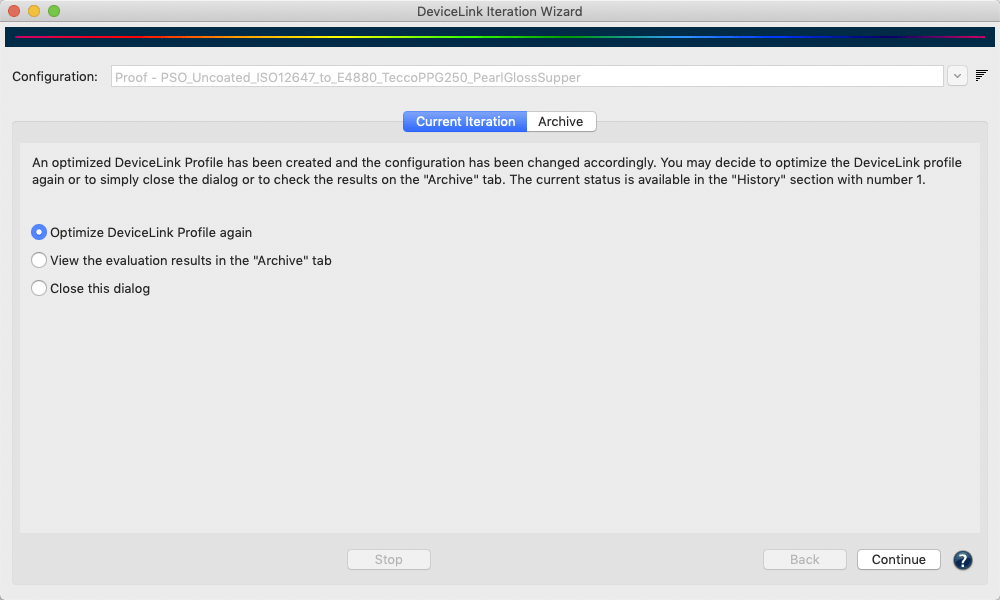
      1. Optimize DeviceLink Profile again: Runs another iteration cycle, for example to check whether a previously iterated DeviceLink successfully passes the evaluation. If you select this radio button and click Continue, a new iteration cycle starts with step 1 and the creation of a new test chart to be printed.
      2. View the evaluation results in the Archive tab: If you have already completed several iterations or would like to see the evaluation results once more, select this option. When you click Continue, the Archive tab opens with the last iteration step highlighted.
      3. Close this dialog: If the evaluation results are all right or if you want to end the iteration process you can simply select Close this dialog and by clicking Continue the iteration is ended.

      Archive

      All data created during the iteration - such as test charts, reference data and measurement data, as well as the report - are stored in an internal database in addition to the save location defined by the user.

      Therefore, if data is deleted from the save location it can still be restored from the internal database any time via the Archive tab. Users can stop an iteration process and even close the DeviceLink Iteration Wizard dialog at any time and can revert back to the last completed step with the help of the Information stored in the Archive.

      The Archive tab shows all iteration steps and evaluation details. The History table contains a list of all iterations, with the active iteration highlighted. More information for the selected iteration step is displayed under Details.

      The columns of the History table show the iteration step number #, the maximum DeltaE00 value dE00 (max), the average DeltaE00 value dE00 (avg), the Status of the selected iteration step and some Information about the iteration process itself, such as Optimization applied, when the measurements done from the printed test chart have actually been used to create an iterated DeviceLink, or Evaluation measurement, when the measurements have been used for evaluation only and have not been used to create an iterated DeviceLink.

      In addition, the iteration process (being performed in the Current Iteration tab) can be discontinued, which is indicated with various messages such as Next step: save chart, Next step: measure or load data, Next step: Evaluate.

      Right clicking on an iteration step in the History displays a context menu with the following options:

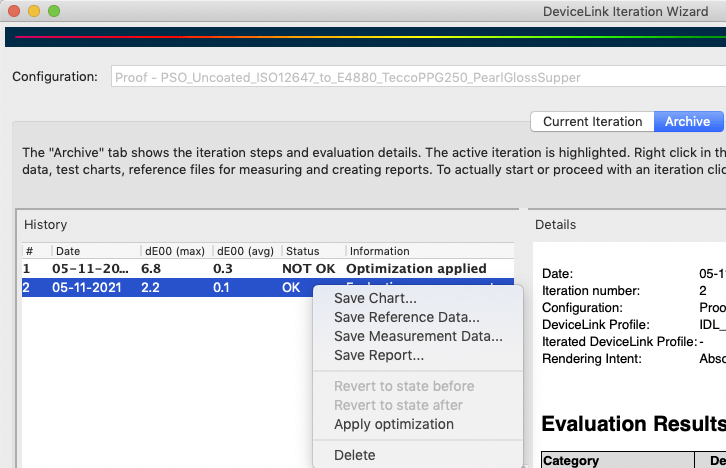
      Save Chart: Exports the test chart into a file selected by the user. The test chart is not newly created but only copied from the internal database. This implies that the file selection only supports the file type initially chosen by the user.

      Save Reference Data: Exports the reference data that belongs to the test chart into a file selected by the user.

      Save Measurement Data: Exports the measurement data into a file selected by the user.

      Save Report: Saves a report containing all Details displayed on the right and the full information about each measurement patch. This is useful to identify colors with the highest or lowest deltaE values, or colors which are out of gamut. The report is explained in more detail below.

      Revert to state before: This is only available for iterations with the status applied. Reverts back to the state before this iteration, giving the previous iteration, if any, the applied state. The status changes to evaluation measurement. All subsequent items are deleted.

      Revert to state after: This is only available for iterations with the status applied. Proceeds to the state after this iteration step, making it the active iteration. The status of a next iteration, if available, would be evaluation measurement. All subsequent items after the next iteration are deleted.

      Apply Optimization: This is only available for iterations with the status evaluation measurement. It can be used for evaluation measurements that have not been applied in the iteration process itself. Use this option if you want to apply an iteration later on.

      Evaluation Results

      The Evaluation Results shown under Details are always the evaluations of the previous step. This means, if an iteration has been applied in step 1, the evaluation results shown under Details for the selected step 1 are the values before the iteration has actually been applied. Therefore, in order to see the results of the first iteration a second step is necessary. The evaluation results shown for that second step are actually the iteration results of the first iteration step, and so on. This offers the possibility to use the results of an iteration itself for a second iteration. But again, another measurement step is needed to find out if this iteration actually improved the result.

      Evaluation measurements for the different Categories are shown according to the proof evaluation tolerances defined in ISO 12647-7. They can even be regarded as proof evaluation when an absolute colorimetric rendering intent has been used in the configuration. The values shown in the table can assume three different colored states that are green, orange or red. Values shown in green are within the Limit and therefore all right. Orange values are outside the Limit but can be improved by iteration. Red values are outside the Limit and cannot be improved. This is mostly the case if a source color can’t be reproduced in the target color space because it is out-of-gamut. An overall statement of the accuracy of the rendering is given below the table. A green check mark indicates that the color conversion is within the limits, whereas a red cross indicates that it is not.

      Special cases arise if the rendering intent used in the configuration is not absolute colorimetric. In case of relative colorimetric or perceptual rendering intents the reference Lab values used to iterate the conversion need to be calculated from the initial DeviceLink profile. The measurements are then compared to those rendering intent specific reference Lab values. The iteration is still using the tolerances from ISO 12647-7 for the analysis of the iteration accuracy. However, since this conversion is not a proof print, a different statement results for the overall iteration accuracy compared to the iteration result with an absolute colorimetric rendering intent.  

      The Report

      By right-clicking on an iteration step in the left table, a report can be created for this step. The report can be saved in various formats such as PDF, HTML, XML and TXT. The PDF and HTML formats are the most common versions for end users, while the other formats are more intended for automation and usage in other systems such as a MIS (Management Information System). 

      The report contains all displayed Details and the complete information for each measuring patch. This is handy for identifying colors with the highest or lowest DeltaE values or colors that are out-of-gamut. A Legend explaining the color highlighting in the DeltaE column is shown at the bottom of the last page of the report.

      Help

      ZePrA’s Help menu

      What’s New
      Opens the website that shows new features and bug fixes in ZePrA (requires an Internet connection).

      Online Help
      Goes directly to the online help (requires an Internet connection).

      Quick Start Guide
      Opens the download page of the Quick Start Guide (requires an internet connection).

      readme.txt
      Contains the Release Notes with brief information about the latest changes.

      CLI Manual
      ZePrA provides a command line interface for integration into other workflows. CLI Manual opens the Command Line Interface documentation in PDF format. It is intended for developers, scripters and experts and describes the usage of the command line interface of ZePrA.

      Save Support Data
      Creates a compressed text file that contains important support information. Send this support data to your ColorLogic reseller for expert assistance. The data required includes information about the used operating system, the ZePrA log file, general preferences, and settings at the time of the problem.

      Event Log
      Shows the events that occurred when using ZePrA. Some of the events take place in the background (for performance reasons and to improve the user experience) and are invisible to the user. The event log contains such and other information with the exact time of occurrence.

      Examples:

      • Configurations or spot color libraries exchanged with the Automatic Import feature are automatically updated or added without notice
      • Added or updated SmartLink presets are loaded in the background
      • Automatic stopping or starting of queues, in case hotfolders are temporarily not available due to network problems or other issues
      • Messages and information regarding PantoneLIVE, e.g., login errors and updates
      • The starting and stopping of the program itself

      Automatic Update Check
      Checks whether a new program version is available (requires an Internet connection).

      Enable automatic update check: If activated, ZePrA checks whether a new version is available for download at program startup or once a day.
      If a new version is found, it can be downloaded via the download links given in the window (for macOS or MS Windows).
      The most important new features are briefly described in the window, a detailed description of the new features can be found in the linked “What’s new in ZePrA?

      Register
      Here you can load and activate your licenses, request a demo license, or view further information about your licenses.

      Special Features

      Profile search in drop-down menus
      All profile drop-down menus function like search fields. Simply type in some letters of the desired profile and only those profiles containing these letters will be shown in the list. To select a profile simply click on it. Alternatively you may open the drop-down menu with the arrow on the right and select a profile from the full list as usual.

      Context menus
      A right click on an entry in a table opens a context menu with useful tools specific to the respective table.

      Forward and backward icons
      The two buttons with forward and backward icons at the bottom left allow switching between all opened dialogs similar to the forward and backward buttons of a browser.

      Troubleshooting
      ZePrA automatically checks all settings for errors and inconsistencies, such as missing profiles or incorrectly set rendering intents. In the lower part of the window, a warning message appears that briefly describes the problem and offers a solution. You can then decide whether to ignore the error or have ZePrA fix it automatically.

      For detailed information visit Troubleshooting.

      Screen Preview
      Shows a real color display of your files on the monitor. Also overprinting elements and transparency effects are taken into account. More information about the integrated softproofing can be found in the tutorial Softproofing PDF image files.

      ZePrA | Job Warnings

      Job Warnings

      Customize job warnings for configurations

      Customize Job Warnings for Configurations

      In general, job warnings and error messages will be issued when problems or errors occur while processing a file. Files with a yellow warning in the Overview window have been processed but may have issues. They are placed in the Output Folder. Alternatively, when configuring the Queue, define an Output Folder with Warnings, where such files will be moved after processing. Incorrectly processed files, fatal errors or unsupported file types are highlighted in red and are moved to the Error Folder.

      The list contains all existing warning messages. Their behavior can be customized independently for any configuration, for example if you don’t want a warning message for a certain problem or if you feel that a problem is so serious that it should better be treated like an error.

      Note: The behavior of error messages can’t be changed.

      Job Warnings can be adjusted individually: Right click on the desired job warning to open the context menu. Select Inactive, Active or Active (Treat as Error).

      Inactive: Deactivates the job warning in the selected configuration. The Overview window no longer displays a yellow warning.

      Active: Activates the job warning in the selected configuration.

      Active (Treat as Error): Treats the associated problem like an error. The file will be highlighted in red and moved to the Error Folder.

      Reset: Resets the changed warnings to the default settings.

      ZePrA | PantoneLive EN

      PantoneLIVE

      Access PantoneLIVE libraries in ZePrA

      Access PantoneLIVE libraries in ZePrA

      PantoneLIVE® by X-Rite is a cloud-based solution for the digital storage of spectral spot colors. This applies both for Pantone Guides, paper-dependent, so-called ‘Dependent Standards’, as well as specific color libraries of brand owners.

      Note: The use of PantoneLIVE requires a license for both the spot color module of ZePrA as well as a PantoneLIVE Production license from X-Rite. Activate your licenses in your My X-Rite account for use in ZePrA. See below for more details on the activation process.

      PantoneLive and Apple M1 chip support on macOS

      PantoneLive does not run natively on Apple M1chips. If PantoneLive is required, ZePrA must be started in Rosetta mode (see screenshot), which is the emulation mode to make sure that legacy software runs on M1 chips. To do so, simply select the ZePrA.app and right click Information. In the information dialog select the checkbox Open using Rosetta and restart ZePrA.

      Note: ZePrA can be used in Rosetta mode to download PantoneLive libraries. ZePrA can then be restarted without the Rosetta emulation. This gives you access to previously downloaded PantoneLive libraries for up to 30 days with ZePrA running natively on the M1 chip.

      Importing PantoneLIVE libraries

      To import PantoneLIVE spot colors from the cloud into ZePrA, proceed as follows:

      1. Select Spot Color Libraries from the sidebar and click on PantoneLIVE.

      2. In the Login section you can either login using the User Name registered with Pantone or your e-mail address and your Password.

        Note: The login requires an active Internet connection and an activated PantoneLIVE license for ZePrA.
      3. If your company uses a proxy server you can enter the required proxy settings under Proxy before logging in.

        Setting proxy server for PantoneLIVE

      4. Your libraries will be displayed after successfully logging in.
      5. Select the libraries to import and use in ZePrA by enabling the corresponding check boxes. Then click Update. The spot colors will be downloaded from the cloud while the progress is shown in the lower part of the window under Status. Imported libraries are marked as up to date while libraries which have not been imported are marked as not used.
        Note: Depending on the number of selected spot colors and the speed of your internet connection this may take some time. The dialog cannot be closed during download.
      6. Once the selected libraries have been downloaded, you can close the dialog. Your PantoneLIVE libraries are now displayed under Libraries in the Manage Spot Color Libraries dialog and can easily be distinguished from other libraries by the Pantone icon.
      Characteristics and use of PantoneLIVE libraries
      • PantoneLIVE libraries can only be used in ZePrA while you are logged into PantoneLIVE. Once logged out, the libraries can no longer be used.
      • As long as ZePrA is connected to the internet and you are logged into PantoneLIVE, imported PantoneLIVE libraries can be used without limitation.
      • If you have not logged off from PantoneLIVE but the internet connection is interrupted, already imported PantoneLIVE libraries can be used until the expiration date. Typically, this is for one month. The remaining days are shown in the Information column. However, it is recommended to log in again as soon as possible to be informed about potential color updates or to prevent error messages because the libraries are not available.
      • The revision number of PantoneLIVE libraries is displayed in the column Revision of the PantoneLIVE dialog and for already imported libraries in the column Information of the Manage Spot Color Libraries dialog. Additionally, the PantoneLIVE dialog indicates the Brand Owner and the column Dependent Standard Code shows a letter combination. This Code provides further information, among others the printing process and the paper of the selected library.
      • When the revision number changes, or when spot colors have been updated in the cloud, the Status of the affected libraries will change in the PantoneLIVE dialog from up to date to needs update. In this case, click on Update and the libraries will be updated in ZePrA.
      • Standard libraries can be edited in ZePrA, which means that spot colors can be copied, modified, deleted, or exported from one library to another, and Lab values can be edited. This is not the intention of PantoneLIVE libraries and are prevented by ZePrA.
      • The Lab values of PantoneLIVE spot colors are displayed as rounded numbers in ZePrA; however, internally ZePrA calculates the spectral measurement values with full accuracy.
      • To aid recognition of PantoneLIVE libraries, these libraries are marked with a PL: in the drop-down menus of the sub-dialogs under Configuration and in the Spot Color Report.
      PantoneLIVE licenses in ZePrA

      ZePrA allows direct access to PantoneLIVE®. A ZePrA spot color module license and an active PantoneLIVE® Production license from X-Rite are required. PantoneLIVE® libraries will then be available for use in ZePrA.

      PantoneLIVE licenses are computer-bound and may even be application bound. If the computer (and ZePrA) is not enabled, you will receive the following error message in ZePrA (see screenshot):

      To activate a PantoneLIVE license, open the page My PantoneLIVE of your My X-Rite account. The list with available licenses is found at the bottom of the page. If an Unused license is present, click Edit. This opens the dialog for this license, and you have two options to activate it:

      1. Activate the license by selecting Use this activation yourself and click on Done. In ZePrA, you can close the error message with Cancel and login again. Since the activation has already been done on the My X-Rite website, entering the activation code is not required.
      2. Do not change anything on the My PantoneLIVE website, simply copy the Activation Code and paste it into the error message in ZePrA. Then close the dialog box with OK. In this case, ZePrA completes the activation. The activation may be visible only after re-logining in on the My PantoneLIVE page.

      Please check this YouTube video for the licensing procedure.

      In case of problems with licensing please contact the X-Rite support.

      ZePrA | Spot Color Iteration

      Spot Color Iteration

      Iterate spot colors to improve or maintain quality

      Iterate Spot Colors

      Spot Color Iteration is a process that involves printing of the spot colors converted by ZePrA on the printer to be used for the print job, followed by measuring test charts and optimizing the color differences (expressed in deltaE2000) until the measured deltaE values are within the desired tolerances. Printing the test chart and applying the Iterate Spot Colors feature once only already results in an improved spot color rendering which is usually close to the optimum of this printer.

      Why can spot color iteration be required?

      First of all, be assured that ZePrA already calculates the best possible spot color conversion based on the target profile set under Configuration/Target Color Space. However, printers, inks and papers drift over time so that there are always some deviations from the state the printer was profiled. During spot color iteration we measure how converted spot colors are actually printed in the current state, and subsequently optimize the deltaE2000 values. The iteration report shows which colors are improved and where restrictions based on the color gamut or the spot color Calculation Method occur so they can’t be optimized further or if additional iteration steps are recommendable.

      Procedure

      Open the Iterate Spot Colors dialog right from the Spot Colors tab of the Configuration you would like to optimize or the Tools menu and follow the steps from top to bottom. A Spot Color module license is required to use the tool.

      Step 1: First, select the Configuration you would like to use for printing. The option Convert Spot Colors must be enabled in this configuration.

      Notes: The best approach for the iteration of spot colors is to set the Calculation Method to Precise Match or Visual Match in the appropriate Configuration.

      The setting Use the least Amount of Channels may be insufficient for iterating spot colors. Importantly, spot color iteration will not work when the spot color conversion is set to Convert using Alternate Color Space from PDF.

      Step 2: Select the source of the spot colors you would like to optimize. You can either choose a PDF or an image file with spot colors or a complete spot color library. In the following example we will use a PDF file with spot colors as source file.

      Step 3: A test chart file will be created from either a PDF or Image File or a spot color Library. If you select a PDF file and click on the Save button, ZePrA will extract all spot colors (full tones) used in the file and convert them using the selected configuration. In this step select an Instrument Setting for your measuring instrument. In the Save dialog, choose either a PDF or TIFF file type to create a test chart which contains the spot colors as a strip optimized for your measuring instrument. In addition, the  associated reference file for measuring will be created. The newly created test chart needs to be printed on the printer to be used for the print job.

      Note: The test chart contains the converted spot colors as given in the Configuration using the conversion settings and Calculation Method defined in the tab Spot Colors.

      Step 4: Print the test chart on your printer. Do not apply any color management when printing the test chart.

      Step 5: Subsequently, measure the printed test chart using ColorAnt/Measure Tool or an appropriate software. The required reference file which is needed for measuring the spot colors will be shown in step 3. Click on Measure to open the Measure Tool in ColorAnt. The reference file will be selected automatically so that you can use the tool right away for measurements with your instrument. For information on how to use the Measure Tool in combination with your instrument follow the instruction given in the online help. Alternatively you may use the provided reference file for measurements with other tools.

      Step 6: This step is optional but highly recommended. If you click on Save Report a Spot Color Iteration Report will be generated. The report provides you with information about the achieved and measured deltaE values.

      The last column of the report – Status – provides status information such as improvements, recommendations about further processing or warnings. If the deltaE00 value is already very low (lower than 1) further optimization is not needed and the color is marked green. Colors that are marked yellow are higher than 1 but below 2 dE00 and colors marked orange are higher than 2 dE00. For colors that have been improved by an iteration the improved value is shown in brackets expressed as deltaE behind the status. If a spot color is out of gamut or optimization is not possible due to restraints from the selected configuration those colors are marked accordingly. A Legend below the table of the report explains the different statuses.  If a color is marked as Optimizable, the value in brackets behind the status indicates the maximum improvement to be expected.

      Step 7: When clicking the Apply button the optimized spot colors (based on the measurement data) will be calculated and applied in the Configuration. Only tick the checkbox Iterate all Spot Colors if you would like to iterate all spot colors. We recommend to deactivate the checkbox in order to include only those spot colors in the iteration which can actually be improved. Consequently, if the checkbox is disabled, spot colors which are already marked as Good in the report will not be optimized further.

      A feedback message informs the user when a spot color iteration has been applied successfully.

      You will find the optimized device values (Output values) in the table of the tab Spot Colors under Configuration. They will be marked as Iterated in the column Information of the table. 

      Expert tips: It is a good idea to Export the optimized spot color table of the tab Spot Colors. This will give you the chance to revert to these values in case you do some further iterations or change some values manually. Another tip in case you would like to revert to the original values without iteration is to use the Reset button in the Spot Color Iteration dialog. This deletes the iterated colors from the table.

      Additional information

      If you would like to evaluate the improvements in terms of deltaE2000 after Step 7 you need to print the optimized spot colors once more. To do so click on the Save button  in Step 3 of the Iterate Spot Colors dialog to create a new test chart file with the optimized device values and a new reference file. Make sure to use the second  testchart file when printing and measuring rather than the first one! After measuring and saving a new Report you can assess the improved deltaE00 values. You can continue to iterate by simply clicking the Apply button in Step 7. Or, in case the deltaEs are fine and further iteration is not recommended, simply close the dialog without applying the new measurements.

      If the selected source file does contain spot colors which have not been considered in the selected configuration, an error message will appear as the test chart cannot be created. For that reason we recommend to convert the source file containing the spot colors integrating the wanted configuration prior to the iteration, or to verify them using the Spot Color Report in order to ensure correct settings in the configuration.

      If you would like to optimize the creation of the test chart for you measuring device (for Step 3 of the iteration) you can create your own settings using the tool Export Chart in ColorAnt. The newly created settings are available in the drop-down menu Instrument Setting after the dialog Spot Color Iteration has been closed and reopened.

      The measurement data that has been transmitted from Measure Tool to ZePrA in Step 5 is saved for later use in the shared folder for all users under ColorLogic/SpotColorMeasurements (Windows: C:\Users\Public\Documents\ColorLogic\SpotColorMeasurements. Mac: \Users\Shared\ColorLogic\SpotColorMeasurements).

      ZePrA | Applying Correction DeviceLinks

      Correction DeviceLinks

      Modify target profiles with updated profiles or correction DeviceLinks

      Apply Correction DeviceLink Profile

      The more reliable the color behavior of your press and the more accurate the associated ICC profile for the printing process, the better the color conversion with ZePrA. In practice, however, things often look different. Fluctuations between paper batches, varying tonal value increases or fresh printing inks deviate from the ink series last used, which leads to color deviations and differences in the tonal value distribution.

      To compensate for these fluctuations and deviations, CoPrA SP* with its Update Profile module is part of ZePrA’s SmartLink module. Instead of generating a completely new press profile and DeviceLink profile in case of deviations, a correction DeviceLink profile can be used to adapt to the changed conditions.
      Very little information, such as the spectral measurement values of dot gain strips or, even better, of the Reprofiler measuring strip provided by CoPrA SP*, will ensure that your press produces the same color impression as before the deviation.

      The Correction DeviceLink profile will be applied after the color conversion defined in your configuration. So you can continue to use your tested and proven DeviceLink profiles and do not have to replace them due to a change in the target color space of your press.

      Note: *SP = Serialized Profiles. The profiles created with CoPrA SP are encoded with the serial no. of the ZePrA color server and can only be used there.

      Update/correct the target profile in CoPrA

      CoPrA’s Update Profile module allows existing ICC profiles to be updated with a few measurements. Correction DeviceLink profiles based on updated profiles can optionally be created for application on print data. These profiles can be selected in ZePrA under Configurations in the Document/Target tab by activating the Apply Correction DeviceLink Profile checkbox in the Target Color Space control panel. ZePrA versions prior to 4.6.2 do not support this profile type.

      Procedure

      1. Select a measuring strip. CoPrA contains two Reprofiler measuring strips for different measuring devices for CMYK and RGB-based printing systems. For other color spaces, ColorAnt can be used to create suitable measuring strips.
        (1) The Reprofiler measuring strip small is available in a one-row and a two-row version. The one-row version can be placed more easily in the trim area of a printing press. The two-row strip is more suitable for digital printing or inkjet systems.
        (2) The Reprofiler measuring strip large contains considerably more color patches and is therefore better suited for optimizing larger color variations, as well as in digital and inkjet printing.
        Note:Besides the included ColorLogic measuring strips, other measuring strips can also be used, for example Ugra/Fogra Media Wedge, IDEAlliance Media Wedge, ECI GrayControl Strip, ECI bvdm TVI or UGRA UDKS Wedge. Alternatively, you can use an existing measurement file that reflects your current printing conditions.
      2. Print the measuring strip. To do this, deactivate the color management settings, i.e. no simulation of a printing condition will take place. This is especially true for digital printing systems.
      3. Measure the measuring strip with a spectrophotometer.
      4. The Update Profile tool in CoPrA optimizes the ICC profile of your target profile (= printer profile selected as Target Color Space in ZePrA).
        Note: If you use the Apply Correction DeviceLink Profile function, you do not need to replace the profile set as the target color space because this is done elsewhere – see below. 

      Applying the correction DeviceLink profile in ZePrA

      1. In Configuration, Document/Target click the checkbox Apply Correction DeviceLink Profile. If there are no correction DeviceLink profiles, the option is grayed out.
      2. Click Settings to open the Correction DeviceLink Profile dialog and select a correction DeviceLink that has previously been created by CoPrA.
      3. The corresponding optimized target profile should also be embedded in the converted file (Embed updated Target Profile instead of the Target Profile). This will make this profile the new Output Intent of the converted PDF file. The updated target profile is shown below.
        Note: ZePrA checks whether suitable Correction DeviceLink profiles and optimized printer profiles exist for the selected Target Color Space. Only corrected or optimized profiles are shown and can be selected after activating the Apply Correction DeviceLink Profile checkbox. If there are no Correction DeviceLink profiles, the checkbox is grayed out.

      ZePrA | Spot color processing

      Spot Color Processing

      The spot color module of ZePrA allows spot colors of PDF files to be converted accurately into CMYK, RGB or Multicolor color spaces. It requires a spot color license, which is included in ZePrA XXL, but can also be purchased as an Add-on module.

      The spot color module

      • is part of ZePrA XXL, including a Multicolor license.
      • is available as an Add-on for ZePrA (requires a spot color license).
      • is part of the Multicolor Add-on (requires a Multicolor license).

      Spot Color Libraries

      Spot Color Libraries and spot colors can be clearly managed in ZePrA’s spot color module. It can be opened with a click on Spot Color Libraries in the sidebar.

      Here libraries can be created, added, viewed and customized. Individual spot colors can be edited, imported or measured. For example, spot colors from color fans can be measured with a spectrophotometer or Lab values can be entered manually. Color tables with spot colors can also be imported. Supported formats are Named Color ICC profiles, Photoshop ACO color tables, Adobe ASE color tables (from InDesign or Illustrator), text files in CGATS format or CxF files, such as CxF/X-4. You can import your PantoneLIVE color fans stored in the cloud using the PantoneLIVE button.

      Note: PantoneLIVE® from X-Rite is a cloud solution for digital storage of spectral spot colors. For using PantoneLIVE, licenses for the spot color module of ZePrA and for PantoneLIVE from X-Rite are required. Under My X-Rite you must unlock your licenses for use in ZePrA. For information on how to do this, see PantoneLIVE.

      Both Lab and spectral color values are supported. Spectral measurement data are to be preferred, as they give the best results internally.

      For more information about spot colors and spot color libraries, see:

      Spot Colors

      Edit Spot Color

      PantoneLIVE

      Converting spot colors to pixel-based formats: Spot colors from image files (ZePrA supports the pixel formats TIFF, PSD and PSB) can be converted by generating the spot colors as alpha channels with spot color attribute.

      Without spot color module: The alternative replacement colors specified in the PDF file are used to convert spot colors to the target color space, resulting in reduced quality. For more information, see Working without the Spot Color Module.
      Note: In many cases, standard conversion without the use of a custom spot color library will not result in a sufficiently good spot color reproduction or a good printing replacement process color.

      Retain user-defined spot colors: Maintaining custom spot colors is critical to print production. For example, in packaging printing, this is necessary to preserve areas for die cut, braille, varnish, fold and crop marks.

      Spot Color Processing – The Classic Method

      Normally, spot colors (DeviceN colors without CMYK components) are resolved and converted into the target profile. The replacement color (Alternate Color Space or replacement color in the PDF) that is assigned to each spot color in the PDF is used. The PDF alternate color space for a spot color is usually specified in CMYK or Lab and is specified in the PDF-creating graphics or layout application (for example Adobe Illustrator, InDesign or QuarkXPress).

      By using the appropriate settings, ZePrA performs a DeviceLink conversion from the replacement color to the target color space. Nevertheless, conversion with the replacement color value is a rather inaccurate solution, especially if the replacement color for the spot color is specified with device-dependent CMYK values. But even if the replacement color is defined by a measured Lab value, the ICC color conversion results in a color conversion that is mostly not sufficiently accurate and above all not well printable.

      Example: The spot color PANTONE 266 C of a PDF document has an alternate color value of CMYK = 70/81/0/0. Printed in high-quality offset printing on coated paper according to ISO Coated V2, these CMYK process color values would produce a dark violet color that is 32.7 DeltaE-76 or 9.8 DeltaE-2000 away from the actual spot color (see screenshot). The color lies outside the printable color gamut and is therefore not printable in four-color offset printing.

      The same spot color with the same PDF replacement color value would also only be reproduced with a large color error of approx. 9 DeltaE-2000 in a Multicolor printing system with 7 colors, which could simulate the spot color very well. In our example, a conversion via a stored CMYK replacement color value will therefore lead to an extremely unsatisfactory color reproduction in both printing processes.

      Working with spot colors

      An exact conversion of spot colors requires color libraries with correctly measured spectral color values on the one hand, and additional DeltaE minimization on the other. With a DeltaE minimization, our example colour PANTONE 266 C in the Multicolor 7C printing process could even be reproduced exactly without color errors (see screenshot).

      Often several Spot Color Libraries are created for identical spot colors because it is necessary to use separate and optimized color values for different substrates or printing processes.

      Spot Color Libraries can use measured gradations of spot colors, so that gradations of the spot color can be reproduced optimally (for example, the 50% value of a spot color).

      In order to better calculate overprint simulations, the measured values can be stored spectrally (also spectrally on black color). Then the calculation is done with an intelligent spectral color mixing model.

      ZePrA is able to maintain overprinting properties if this is possible.

      For elements consisting of a mixture of spot colors and other process colors, the color appearance is simulated in the best possible way after the spot color has been resolved.

      When converting to the target color space, as few process colors as possible can be used while still maintaining the smallest possible visual color difference. In our example, the optimal solution is to use only the violet process color (see screenshot) and still achieve a color error of only 1.0 DeltaE-2000.

      Spot colors can be converted to a desired target value (for example, a process color) regardless of the smallest possible DeltaE. This is necessary for texts or barcodes, among other things.

      Spot colors can be excluded from a conversion, for example when spot colors are used as crop marks, gloss varnishes or braille characters.