ColorAnt | Export Chart

Export Chart

Export custom charts for printing

Export Chart

Overview

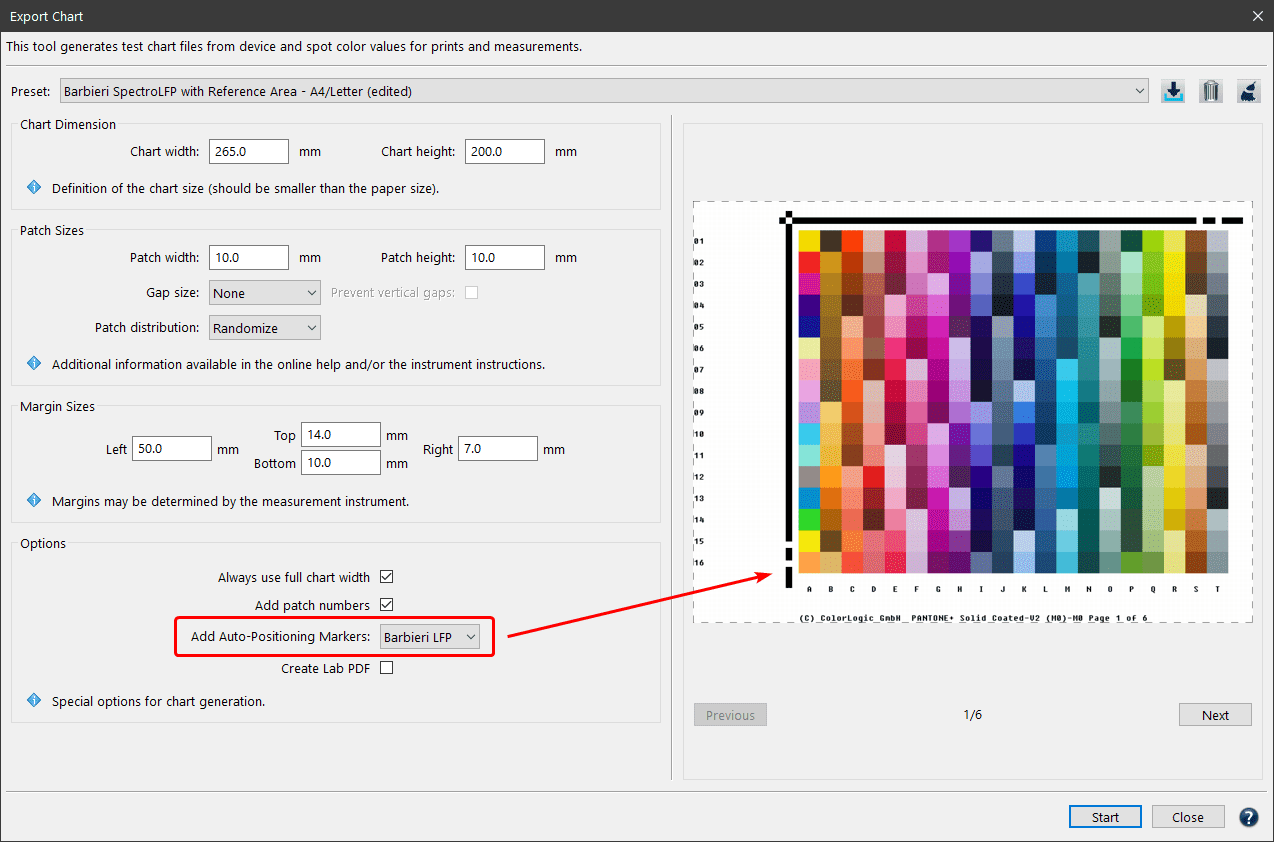
The preview area on the right side shows the Patch distribution on all generated pages. Changes of the Chart Dimension, Patch Sizes and Options can thus be evaluated directly.

On the bottom of the window are buttons to Cancel or create (Start) the test charts.

The Measure Tool is optimized to work with most instruments:

  • Barbieri Spectro LFP
  • Barbieri Spectro LFP qb
  • Barbieri Spectropad
  • Konica-Minolta FD-5
  • Konica-Minolta FD-7
  • Konica-Minolta FD-9
  • MYIRO-1
  • MYIRO-9
  • Techkon SpectroDens (Windows only)
  • Techkon SpectroJet (Windows only)
  • X-Rite eXact
  • X-Rite eXact2
  • X-Rite i1Pro 1
  • X-Rite i1Pro 2
  • X-Rite i1Pro 3
  • X-Rite i1iO
  • X-Rite iO3
  • X-Rite i1iSis 2/XL

Note: Non-supported instruments may require software from the specific vendor for generating a test chart from our reference data. Read this article about using ColorLogic reference data in other programs such as X-Rite i1Profiler to generate test charts for the X-Rite iSis.

 Procedure

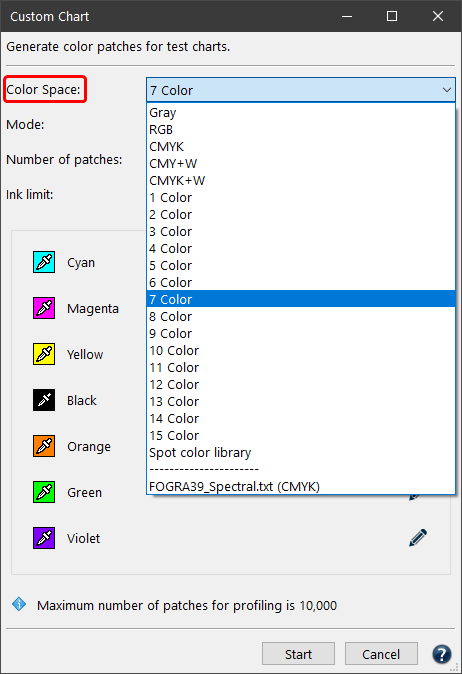
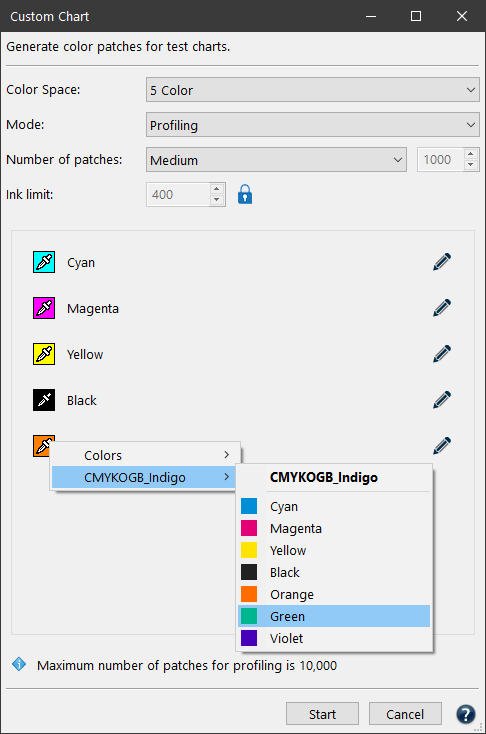
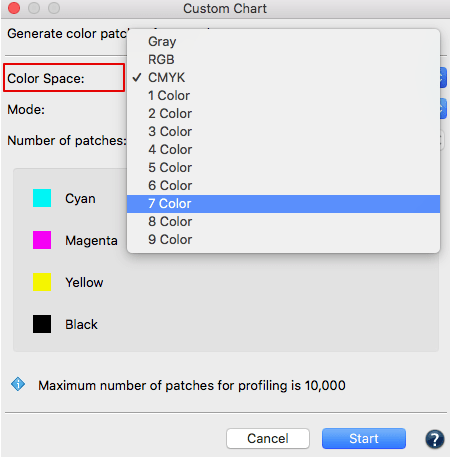
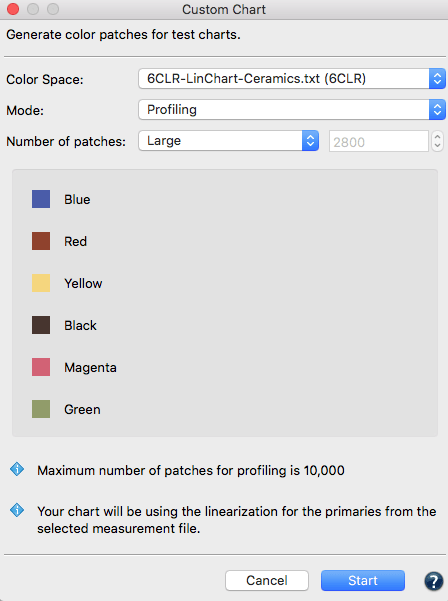
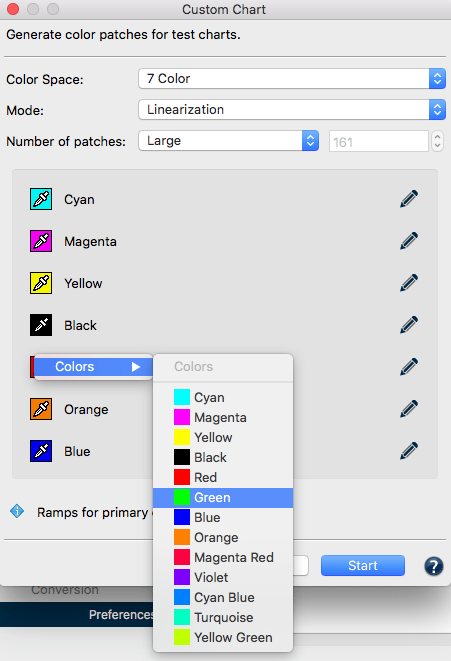
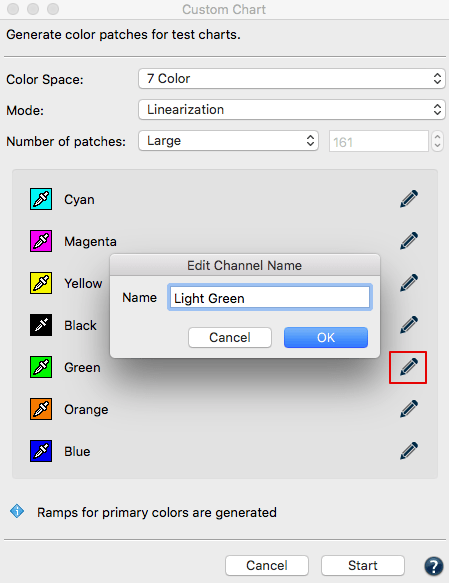
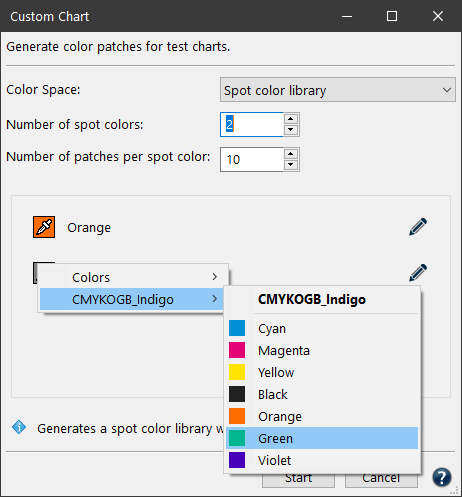
  1. Select the reference file with the required device color values and load this information into Measurement Data. Available reference data for different color spaces are stored under Data/ Predefined data or create your own reference data with the Custom Chart tool.
  2. Open the tool Export Chart to define the proper settings for creating a test chart for the applicable measurement device.
  3. It is recommended to select a Predefined Preset in the drop-down menu that fits your instrument type and size requirements.

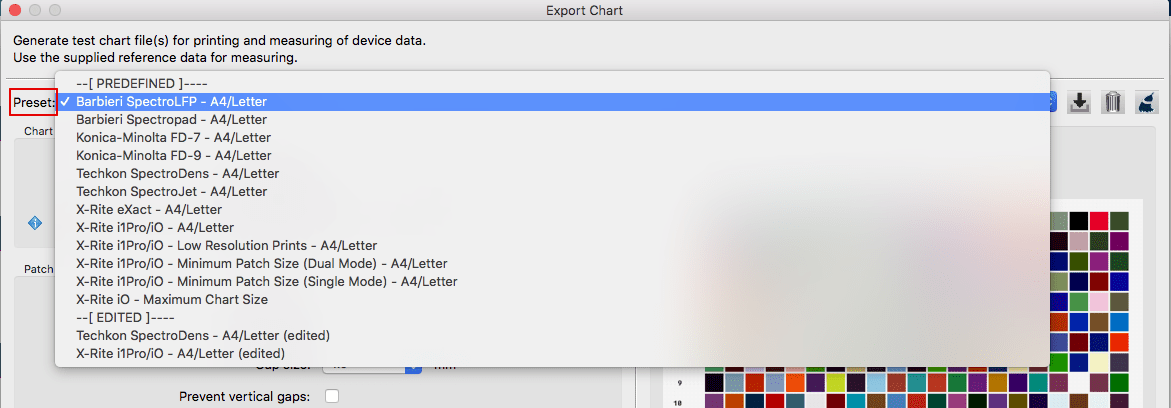
    The Broom icon can be used to delete edited presets if they haven’t been saved yet.

  4. For a custom chart or patch size edit one of the predefined presets. The edited version will be marked as (edited). For the custom settings to be saved click the save icon and give the preset a name. Saved presets will be listed under the SAVED divider line in the drop-down menu.
  5. After defining the settings (more details in the next chapter Settings and Options) ColorAnt will display how many pages the test chart will require. A larger Chart height allows more patches per page and reduces the number of pages required.
  6. Click on the Start button and the test chart will be exported. In the Save dialog define file name and Format (TIFF, PSD or PDF).
  7. ColorAnt generates the required test charts and the corresponding reference data that match the specified layout.  Please use this newly generated reference data and not the one loaded under point 1 for measuring the patches and profile creation.
    Note: ColorAnt can create reference files from PDFs that contain spot colors. This implies that files containing NoSpace/Lab information can also be exported (see below for more information).

Settings and Options

Measuring instruments may have specific needs regarding patch sizes, the gap between different patches and the size of the overall chart. In addition, you may respect the requirements of your print process and eventually reduce the Ink Limit (TAC).
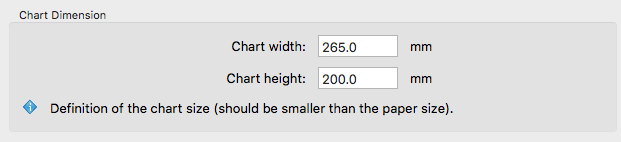
Chart Dimension

Define the image size of each individual test chart. Enter the desired Chart width and height to limit the space that might be used for the color patches (minus the space required for labeling the patches). This is the image size, not the paper size. The exported test charts can be positioned on the required paper size afterward and then be printed.

Patch Sizes

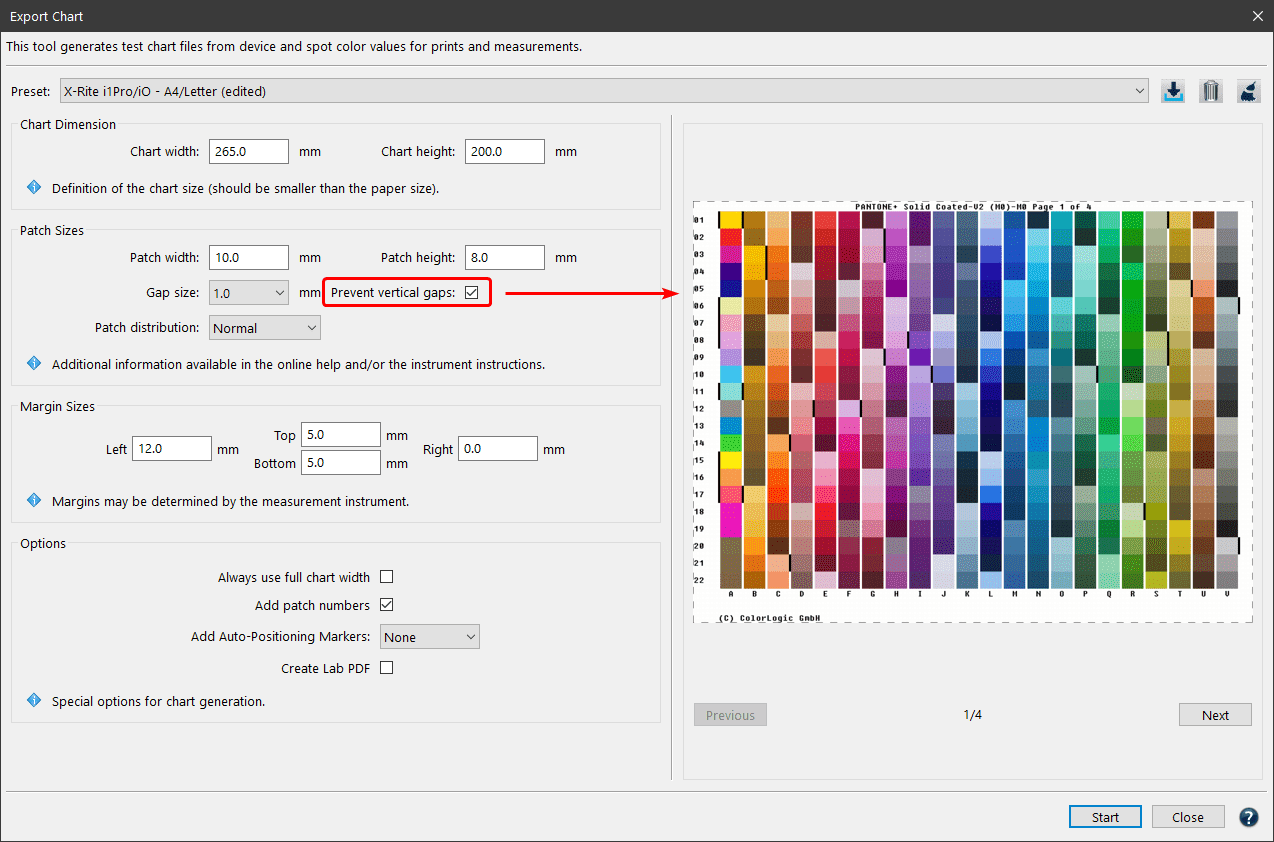
Allows you to define the Patch width and Patch height of each color patch. Select the Gap size from the drop-down menu. Use Auto as a default or None if no gaps between patches are needed. Some instruments can work with a very small gap of 0.5 mm some require 1 mm. For rough surface substrates and low resolution printers a 2 mm gap may be helpful. For further information consult the instrument documentation.

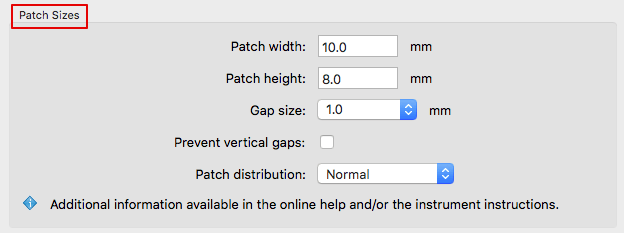
Prevent vertical gaps: Removes the gaps between rows (gaps between columns remain). Depending on the chart size, several additional rows may fit on one page.

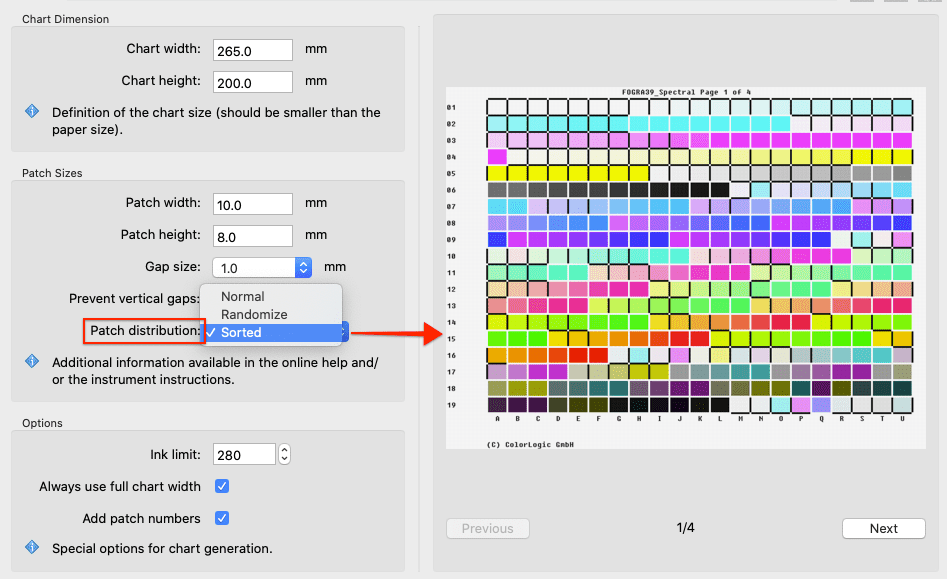
Patch distribution: Defines the distribution of patches on the test chart.
Randomize: Color patches are distributed randomly.
Normal: Color patches are distributed as specified in the reference file.
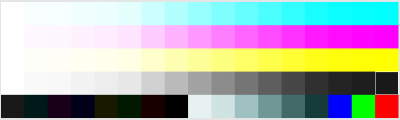
Sorted: Color patches are sorted from light to dark. This might be helpful to modify a random chart into a well sorted layout or if you export a color wedge of one single color.

Note: Randomize is applied every time you save the file. So it is not possible to save the same reference file with the same random patch order twice. If it is however wanted, we recommend the following workaround: Save your chart with Randomize and open the generated reference to save it again using a Normal patch distribution.

Chart defining data such as chart size, Rows per page and Gap Size are stored in the reference file. When measuring the test chart using the Measure Tool, all supported measuring devices that have Setup Wizards (for example the i1iO, Konica-Minolta FD-9 and the Barbieri devices) read out this data and automatically import it.
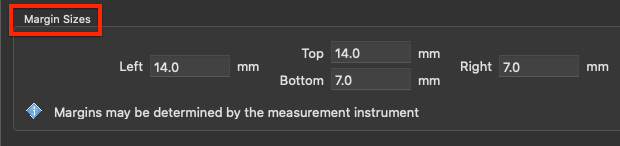
Margin Sizes

This section enables user-defined margins for test charts. This is important for measurement devices that require an additional “white-space” before and after lines to be measured.
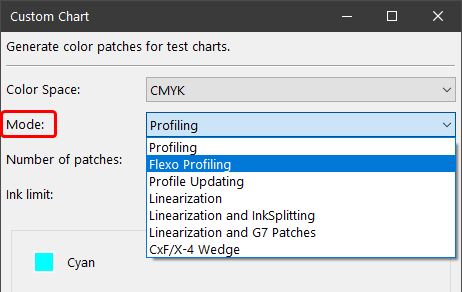
Options

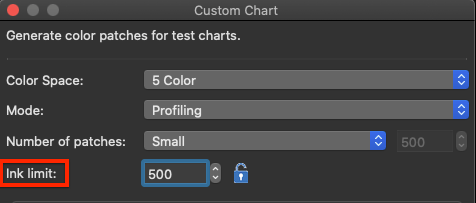
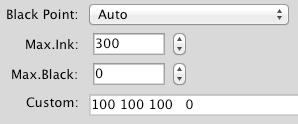
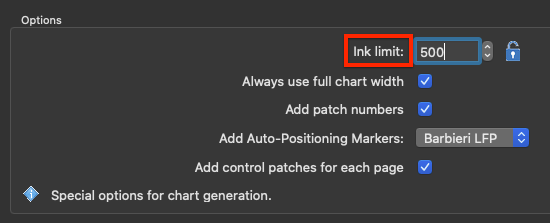
Ink limit: Allows limitation of the TAC for exported test charts. The upper ink limit is 100% per channel, so the TAC depends on the number of channels in the data, e.g. 7 channels result in a TAC limit of 700%. By default, the value is set to 400%, but higher values can be enabled after clicking the Lock icon. In general, the limit can be set as high as the channels allow or as low as 100%. ColorAnt uses a sophisticated ink limiting algorithm that does not just clip values.

Note: Use the exported reference file for measuring and profiling so that reference values and test charts fit each other. Please note that the reference file will be ink limited, otherwise profiling would be leading to incorrect ICC profiles. Note that other profiling solutions may not be able to cope with a reference file that is reduced in the TAC. In addition, when building the ICC profile either use the same or a lower ink limit (called Max.Ink in ColorLogic CoPrA) than defined in the test chart. In most cases a decrease in the ink limit is not necessary for test chart creation.

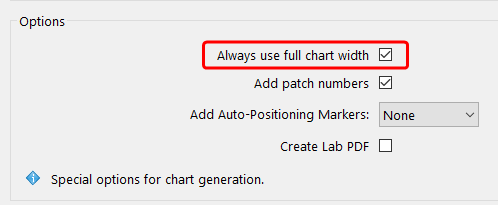
Always use full chart width: When creating one-page test charts, ColorAnt tries to preserve the layout of the rows and columns during export, which can lead to an under-utilization of the chart width. To prevent this, activate the checkbox Always use full chart width.

Note: Please consider the documentation of your measurement device. Some measurement devices allow measurement rows of patches by swiping over the rows. Those types of devices use rulers that can measure up to a certain width which needs to be taken into consideration when the Chart width is defined. The instrument documentation will tell you if a patch delimiter is required and will inform you about the minimum patch size.

Add patch numbers:  Enabled by default. Disabling the option removes the numbers from patches.

Add Auto-Positioning Markers: To use the Barbieri or X-Rite auto positioning feature (Barbieri Spectro LFP and Spectro LFP qb, or X-Rite iSis), the chart needs the corresponding margins and markings. Select your device from the drop-down menu to add the required black auto positioning lines to every page of the test chart.

Add control patches for each page: Adds control patches to check for stability if the test chart contains multiple pages. The patches are added to the top left on every page of the chart. Patches for 100%/70%/40% are added for each channel followed by a single white patch.  This allows you to check for redundancies and production consistencies over different pages.

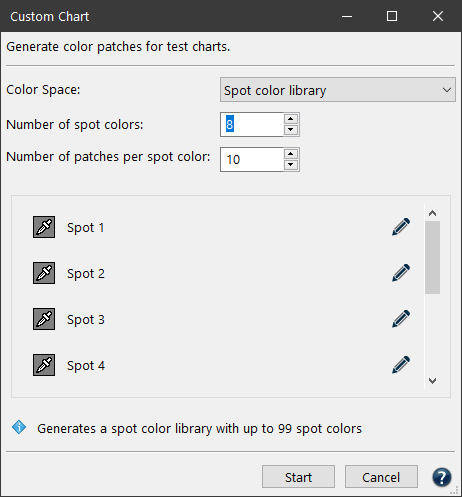
Create Lab PDF: If the checkbox is activated, the spot color library chart is exported as Lab PDF, whereby all spot colors are converted to Lab. In this case you can choose between PSD and PDF.

If the checkbox is not activated, the spot color library chart is exported as PDF, whereby all of the spot colors and their names are retained. In this case, a PDF file is created.

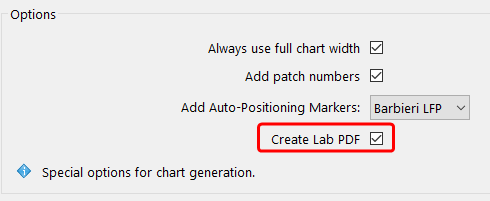
Important: By default, the checkbox is not enabled in order to retain the spot color names and channels.

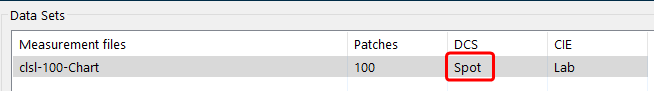
Note: The option is only available for spot color libraries that are defined as SPOT (DCS) or as NoSpace (DCS) in combination with Lab (CIE).

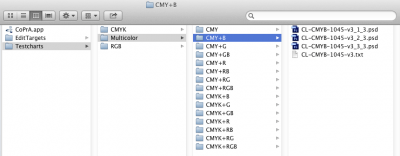
If a spot color library is not recognized as such, e.g., it is defined as CMYK, the datasets must first be unlinked using the Unlink DCS and PCS tool from the context menu (see screenshot).

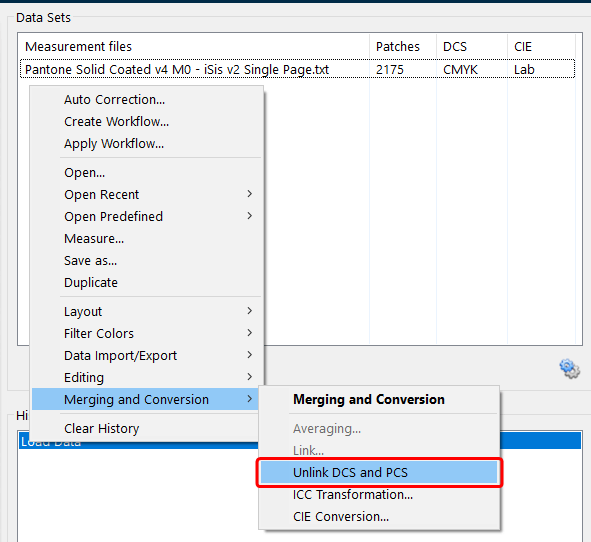
Unlink the data of the selected spot color library

This creates a file with NoSpace (DCS)/Lab (CIE). As a result, the Create Lab PDF checkbox becomes available in the Export Chart tool, and the spot color library chart can be exported as PDF or Lab PDF.

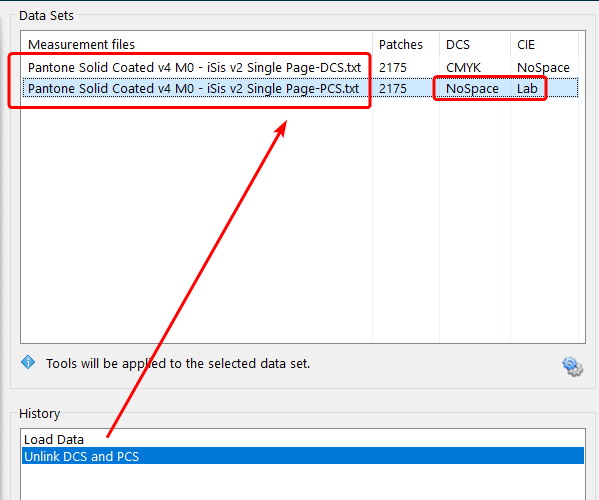
The resulting PCS.txt file is defined as NoSpace/Lab and can be exported as PDF

ColorAnt | Compare

Compare

Compare measurement data before and after correction

Compare

The Comparison window shows measurement data before and after optimization and allows the user to compare the steps that achieved the optimized data (for example Correction, Smoothing or Auto).

Colors

Compare Mode: Select a color distance formula. Available are Delta-Auto, Delta-DCS, DeltaE-76, DeltaE-2000, Delta-Ch, Delta-L, Delta-C and Delta-H, with the last three being particularly helpful when evaluating proofs.
Note: Delta-Auto is a special method that allows for a delta calculation of DCS data. If measurement values are existing in the files to be compared then Delta-Auto uses DeltaE-76.

Sort: Allows you to sort color patches by their delta values. Select the preferred Compare mode from the drop-down menu and activate the Sort checkbox to reorder the color patches from larger to smaller delta values. This makes it easy to find the patches with the highest and the lowest deltaEs or those patches with the highest chroma or lightness differences.

Zoom: The Zoom function allows a closer look at the color patches of the measurement file. Use the shortcuts CMD + and CMD – (macOS) or STRG + and STRG – (Windows) to zoom in and out.

Mark from: Displays the Delta values from the specified value.
Mark to: Displays the Delta values up to the specified value.
Note: The sliders can be used to limit the displayed number of color patches to the relevant delta ranges.

Filters allow a combination of individual channels which are to be compared. Combinations of 2, 3, 4, 5 or 6 channels, as well as one and two channels in combination with black, can be faded in and out.

Note: For each selected patch, the Lab value and the color space and reference values are shown. If no patch is selected, the Maximum and Average delta values are displayed for the entire file considering the set filters.

Display Differences shows color deviations from white (no deviation) to dark gray (high deviations).

Fit chart to width displays the color patches as large as possible to the size of the window. Display the entire chart by clicking the check box.

Graph

Shows a graphical representation of the error distribution as percentiles.

Statistics

Shows statistics like Average, Maximum, Sigma, Median, and Coefficient of Variation of the 10 worst patches and the error distribution in 10% percentiles.

Report

A Comparison Report can be created for two selected datasets.

The Comparison Report contains information about the Average and Maximum deviation, the Patch numbers and their corresponding Lab values, the CMYK values and the Delta deviation of each patch.

The Comparison Report can be saved as PDF or XML file.

Procedure

  1. Apply a correction to the measurement data.
  2. Select the data in the Data Set window.
  3. Click on the Compare button at the bottom of the window.
  4. Select the original measurement data from the drop-down menu in the upper left-hand window. Next, select the processed measurement data from the right-hand side of the window.

  5. Select the Compare mode from the drop-down menu (Delta-Auto, Delta-DCS, DeltaE-76, DeltaE-2000, Delta-Ch, Delta-L, Delta-C and Delta-H).

  6. Use Mark from and Mark to sliders to highlight patches within the DeltaE deviations selected. Highlighted patches are marked in red and the one patch with the maximum DeltaE is highlighted in cyan.
  7. Selecting a patch with the mouse – the before and after optimization will show in a split window with the Lab values and DeltaE information. If no patch has been selected, the Maximum and Average delta values are displayed.
  8. The Graph tab shows a graphical error distribution in percentiles.
  9. The Statistics tab lists statistical quantities such as maximum value, average, median, sigma, coefficient of variation as well as the ten worst measuring patches and the error distribution in 10% steps.

ColorAnt | Custom Chart

Custom Chart

Create custom test charts

Creating a Custom Chart

Overview

The Custom Chart tool is designed to create reference data for custom test charts for various use cases such as profile creation, profile updating, linearization or the creation of spot color libraries.

The following color spaces are supported:

  • Gray, RGB, CMYK
  • Charts with white ink: CMY+W, CMYK+W
  • 1 to 15 Color (a ColorAnt L license is required for 5 Color or more)
  • Spot color libraries with up to 99 colors (requires a ColorAnt L license)

After selecting the Color Space, use the Export Chart tool to create a TIFF, PDF or PSD file from this reference file, which can then be printed on your printing system and measured with a spectrophotometer using the Measure Tool.

Redundant color patches for paper white and primary colors are automatically added to medium and large test charts that contain two or more channels. This allows better verification of printer stability and results in better averaging and redundancy correction of profiling test charts.

Note: We recommend randomizing the patches over the entire layout of the test chart using the Export Chart tool with Patch distribution set to Randomize before printing.

The Custom Chart tool allows the creation of test charts with up to 15 channels or spot color libraries with up to 99 spot colors. If larger spot color libraries are required, several small libraries can be created and then combined using ColorAnt’s Link tool with the Merge by channel name checkbox enabled.
Note: With ColorLogic CoPrA it is possible to create profiles from charts with up to 15 channels. However, we do not recommend creating profiles with more than 9 channels, as this does not currently provide any significant benefit.

Creating Custom Charts

The Custom Chart tool is designed to create different types of test charts for a variety of requirements. Chart creation starts by selecting the Intended Use of the chart from the drop-down menu.

The following use cases are available:

Create Profile: This option creates typical test charts for printer profiling. If the chart is intended for Flexo profiling, activate the Flexo Profiling checkbox to add the additional Flexo-specific patches to the chart.

Flexo Profiling: Adds the additional Flexo-specific patches to test charts, e.g., more patches in the highlights to better capture the behavior of flexographic presses.

Update Profile: This mode generates test charts with a minimum number of patches that can be used in combination with the Update Profile or Iteration tools in CoPrA.

Linearization: The Linearization mode creates color ramps for each ink channel. Linearization charts only contain patches of the primaries.

InkSplitting: By splitting the logical channels (e.g., CMYK) into the real ink channels used by the printer (e.g., CcMmYK) lighter colors are used for lighter areas and darker colors are used for darker areas in images/graphics, e.g., when combining a light Cyan ink and a Cyan channel or Gray and Black inks in one channel.
The InkSplitting option creates ramps for each channel and two color overprints for all channel combinations. This adds more patches to linearization charts and is intended for creating ink splitting DeviceLink profiles.

Add G7 Patches: This option creates linearization charts with patches needed for the calibration of printing devices to comply with the G7® grayscale definition. For this purpose, the usual linearization ramps are created, and the patches specifically needed for the G7® method are added.

Spot Color Library: This option is intended to create custom spot color libraries as well as CxF/X-4 Wedges. A full CxF/X-4 chart contains the full tone and tints of one or multiple spot colors placed on white and black.

Add Overprints on Black: When activating this checkbox, the drop-down menu Number of Patches on Black becomes available, which allows the selection of the required number of overprint patches.
Note: The Spot format will be automatically exported as CxF/X-4 if spectral data is available and CXF is selected for saving.

Complementary Mini Chart: Mini Charts are intended to complement profiling with spot colors via Edit Primaries, as there are more secondaries included in the chart.

Complementary Mini Charts include gradients for the primaries and 2-color overprints for the 50% and 100% combinations:

Color Space: Defines the color space that is used as a reference for the custom test chart.

Reference Data: The drop-down menu lists all reference files loaded in the Data Sets section of the main window.

Number of Patches: Affects how precisely the device color space will be filled with color patches. Please consider the available space on your output, the required accuracy of the characterization data and the capabilities of your printer. Available choices are Large, Medium and Small test charts, and a Custom option that allows entering a specific number of patches.

Note: The Custom Chart tool works even with only a few patches. The color space is covered in the best possible way to allow proper profile creation.

TAC: The TAC of the custom chart can be set to more than 400% or as low as 100%. By default, the value is set to 400%, but higher values can be enabled after clicking the Lock icon. Since the upper limit is 100% per channel, the TAC depends on the number of channels in the data, e.g., 7 channels result in a TAC limit of 700%. In general, you can set the limit as high as the channels allow or as low as 100%.

Define the colors and their names

Eyedropper icon: For some color spaces, colors can be defined by clicking the pipette icon and selecting a color from the list. ColorAnt provides predefined colors, which can be modified as required. Colors can also be imported by opening a data file containing the desired color.

The Eyedropper tool can also be used to change the order of the colors. For example, if the color Red is to be swapped with Green, click on the Red pipette icon and select the color Green in the context menu under Colors.

Pencil icon: By clicking on the pencil icon, a color can be renamed.

Click the Start button to create the data for the custom test chart.

The data can be saved under File/Save as and used in other programs to create the test chart. The test chart can also be created in ColorAnt using the Export Chart tool.

Note: If the test chart has been created and you want to rename one or more colors later, this can be done in the Text tab of the View dialog.

Use Cases

The following descriptions demonstrate how to create reference files for different profiling requirements using the Custom Chart tool. Different options are available depending on the color space. A ColorAnt L license is required to create Multicolor reference files.

Generation of reference files for Gray, RGB and CMYK

First you have to decide whether you need a linearization of the primary colors.

A linearization is always helpful if the printing system tends to produce unexpected results, e.g., if the colors are much too dark due to a sharp tone value increase. A linearization helps to distribute color patches in the best possible way for this printing system. In addition, ColorAnt creates a very smooth and homogeneous linearization to avoid bumps in the distribution of color patches in a test chart.

However, a separate linearization step is not required if the printing system has been calibrated via the RIP, a dedicated CtP curve is used or if the printing system does not show any irregularities in the output.

Profiling without Linearization

Open the Custom Chart tool, select Create Profile from the Intended Use drop-down menu and then the Color Space.

Select the Number of Patches and continue as described above.

Profiling with Linearization

Linearization requires additional linearization measurement data from a linearization test chart. This linearization test chart must be printed on your printing system and measured with a spectrophotometer. Load the measurement data into ColorAnt before opening the Custom Chart tool.

Note: Linearization charts can be created with the Custom Chart tool by using the Linearization option from the first drop-down menu. However, a predefined chart can also be used. For example the file Linearization-CMYK-v1.txt for a CMYK system (see screenshot), which is provided by ColorAnt under File/Open Predefined, or the file Linearization-5CLR-v1.txt for a 5-color CMYK+X printing system.

Select the desired measurement file in the drop-down menu Reference file. ColorAnt automatically recognizes the color space and the channel names.

Select the Number of Patches and continue as described above.

Generation of reference files for Multicolor

Note: Requires a ColorAnt L license.

As for the standard color spaces Gray, RGB and CMYK, you first have to decide whether you need a linearization of the primary colors.

A linearization is always helpful if the printing system tends to produce unexpected results, e.g., if the colors are much too dark due to a sharp tone value increase. A linearization helps to distribute color patches in the best possible way for this printing system. In addition, ColorAnt creates a very smooth and homogeneous linearization to avoid bumps in the distribution of color patches in a test chart.

However, a separate linearization step is not required if the printing system has been calibrated via the RIP, a dedicated CtP curve is used or if the printing system does not show any irregularities in the output.

Profiling without Linearization

Open the Custom Chart tool, select Create Profile from the drop-down menu and then the Color Space.

Select the Number of patches and continue as described above.

Profiling with Linearization

Linearization requires additional linearization measurement data from a linearization test chart. This linearization test chart must be printed on your printing system and measured with a spectrophotometer. Load the measurement data into ColorAnt before opening the Custom Chart tool.

Note: Linearization charts can be created with the Custom Chart tool by using the Linearization option from the first drop-down menu. However, a predefined chart can also be used. For example the file Linearization-5CLR-v1.txt for a 5-color CMYK+X printing system, which is provided by ColorAnt under File/Open Predefined.

Select the desired measurement file in the drop-down menu Reference file. ColorAnt automatically recognizes the color space and the channel names.

Select the Number of patches and continue as described above.

Defining Multicolor channels

For generic Multicolor test charts, define the number of channels and their names (with or without CMYK) as close as possible to the colors used on your printer. It is not necessary to define the channel colors exactly in the reference data. Just make sure that you come close to the type of color so that the correct color combinations are generated. For example, if you want to print violet, you can select blue as the channel color, but not green, red or cyan.

Note: When creating Multicolor profiles with CoPrA, three chromatic colors + optional black + a maximum of three gamut expanding colors are supported. Some examples of possible combinations are: CMYK+Orange, CMY+Green+Blue, CM+Orange+K, CMYK+Red+Green+Violet, etc.
Other non gamut extending colors positioned within the CMYK color gamut may cause problems in profile creation. Use the Spider Web in the View dialog to check the measurement data for problematic color combinations.

Generation of reference files for color spaces with White

For prints on black substrates, such as textiles, white ink must be used first and colors must be applied on top of the white ink to obtain colorful graphics. Special test charts are required to create profiles containing White.

Color Space: CMY+W and CMYK+W: For color managed color prints on colored (mainly black) substrates,white ink must be used. If white inks are to be used for the separation, special test charts are required which can be created using the CMY+W and CMYK+W color space options.

Note: These charts are displayed with a black background in the Export Chart tool to simulate the black substrate. Keep in mind that the patch information and gaps between patches when exporting the chart will be printed with the white ink, hence even if they are existing they do not show up when opening such charts in image editing tools or PDF viewers.

Create custom spot color libraries

Creating charts for spot color libraries is straightforward:

  1. Open the Custom Chart tool and select the option Spot color library from the Intended Use drop-down menu.
  2. Specify the desired Number of spot colors for the library, and decide on the Number of patches per spot color.

  3. This creates a custom chart for spot colors under Data Sets with the color model Spot (indicated in the DCS column).

  4. Depending on the entered Number of patches per spot color, corresponding gradients are generated for each color.
  5. Define the spot colors and the spot color names. Spot colors can be defined by clicking the pipette icon and selecting a color from the list. They can also be imported by opening a data file containing the desired sport color.

    By clicking on the pencil icon, a spot color can be defined by entering its Name and Color value.

    The color can also be selected by clicking on the color field to open the color selector.
  6. The created chart can then be exported using the Export Chart tool (see below) and subsequently measured to generate the custom spot color library.
    Note: If the library has been created and you want to rename one or more spot colors later, this can be done in the Text tab of the View dialog.

Note: In this way, charts for custom spot color libraries of up to 99 spot colors can be created. If larger spot color libraries are required, several small libraries can be created and then combined using ColorAnt’s Link tool with the Merge by channel name checkbox enabled.

Multicolor Profiling and Chart Creation

Generating Multicolor Profiles in CoPrA

General Information

CoPrA supports three main chromatic primary colors which should span a suitably large gamut encompassing the gray balance. Typically, this is CMY but it can be any other appropriate chromatic color combination.

Black can be added optionally as a 4th channel. If black is used it must be the fourth channel.

Up to two gamut extending colors can be used in between each section of the main primary colors.

Note: Following this approach, printer profiles of up to 10 channels can theoretically be created by CoPrA 5 and higher. However, it is not recommendable to use printer profiles with more than 8 channels in production as every additional channel increases the profile size exponentially so that either a very low grid size or an exorbitantly large profile had to be used.

Examples

Typical Multicolor Application
When using a typical Multicolor color space with CMYK parts, the additional inks Green, Orange and Violet extend the gamut in each section of the three primary colors. In between each section, a single gamut extending color is used creating a color space with 7 colors.

Advanced Multicolor Application
Some inkjet printers use Red and Orange in addition to the standard CMYK inks. CoPrA is able to profile such a 6 color printer since Orange and Red are two gamut extending colors of the main primary color sections Yellow and Magenta.

Note: When working with two gamut extending colors, special test charts must be used. CoPrA provides appropriate Multicolor test charts which are available via Tools > Open Testcharts folder > Multicolor.

Special Inks
In industrial printing, such as ceramic printing, the main colors are often supplemented by additional light (e.g. Pink) or dark (e.g. Brown) inks. Another example is Flexo printing, where a Gray ink supplements the Black ink to better render lighter grays in the artwork. These colors are what we call special inks, and they can be used with the special Multicolor Modes in CoPrA.

Supported Color Systems

CoPrA allows to create printer and DeviceLink profiles for all types of color spaces Gray, RGB, CMYK and Multicolor. Cross color space profiles are also supported, such as RGB to CMYK, CMYK to Grayscale or RGB/CMYK to Multicolor.

The following color systems are supported:

  • 2- and 3-color systems
  • 4-color systems with CMYK
  • 4-color systems with CMY + either Red or Green or Blue, without Black
  • 5-color systems: CMYK + either Red or Green or Blue
  • 5-colour systems: CMY + either Red+Green, Red+Blue or Green+Blue, without black
  • 6-colour systems: CMYK + either Red+Green, Red+Blue or Green+Blue
  • 6-colour systems: CMY + Red+Green+Blue, without Black
  • 7-colour systems: CMYK + Red+Green+Blue
  • 8-color systems: CMYK + Red+Orange+Green+Blue
  • 9-color systems: CMYK + Red+Orange+Green+Blue+Violet
  • Special ink combinations such as CMYK+Gray, CMYK+Pink+Brown, etc.
  • The CMY channels can even be exchanged for other similar colors, e.g. Magenta for another reddish color or Yellow for Beige and so on.
  • Creation of DeviceLinks with up to 9 channels
Using Multicolor Test Charts

To create Multicolor profiles various test charts (multichannel Photoshop PSD files) with associated reference files are available for measuring with ColorAnt (or any suitable measuring software). These Multicolor test charts can be found in the folder Testcharts (in CoPrA's installation folder). The folder can be opened directly in CoPrA (menu Tools > Open test chart folder). The contained Multicolor test charts are specifically optimized for the algorithms used by CoPrA. Alternatively, you can create your own test charts for your multicolor process using ColorAnt/Custom Chart.

Selection of the correct test charts for your printing process is facilitated by the naming. Therefore, please note the following naming conventions:

  • The name of the test chart contains the number of channels, the color combination and the number of color patches.  The test chart name CL-CMYKB-2140 reflects that it is a 5-channel test chart with the color combination CMYK+Blue and 2140 color patches.
  • However, by 'Blue' we mean a fairly broad color range of reddish to greenish blue. For example, it contains violet as well.
  • The following color abbreviations are used in folder and file names: R = Red, G = Green, B= Blue, V= Violet, O = Orange, Yg= Yellow-Green.
  • For a Hexachrome printing process with CMYK+Orange+Green, use the corresponding test chart, CL-CMYKRG. Here, CMYKRG stands for CMYK+Red+Green, whereby red includes orange.
  • For 7-color printing use the test chart CL-CMYKRGB. In addition to the colors CMYK it also contains the additional colors Red+Green+Blue.
  • Nine special test charts for 6C and 7C color combinations have been available for two Gamut-extending colors (e.g. CMYK+Red+Orange). They can be found in the folder Special.
  • The layout of the supplied test charts is designed to fit on A4 or US letter size and is optimized for the hand-held measuring devices supported by the Measure Tool. As all patches cannot go on one page the Multicolor charts are split in multiple pages which need to be measured in corresponding sequence (1_6 means it is the first of six pages).

Important Notes

  • The total area coverage (TAC) of 400% is not exceeded in any of the test charts, not even in Multicolor test charts.
  • Please make sure that the RIP or the output system of the printer supports Photoshop multichannel PSD files. If this is not the case please open the test charts in Photoshop (or another suitable image editing program) and save them as DCS2 files.
  • The test charts are optimized for the X-Rite i1Pro measuring device, but can also be measured with other any single color measuring devices.
  • For measurements with the X-Rite i1iO, Barbieri Spectro LFP and Konica-Minolta FD-9, we recommend creating a customized test chart file based on the corresponding reference file using ColorAnt’s Export Chart tool.
  • To use a measuring device that is not supported by ColorAnt MeasureTool, it is necessary to create a test chart which is suitable for that measuring device and the intended printing process. Make sure to select the reference file matching the color system. We recommend creating the corresponding reference files with ColorAnt/Custom Chart. Please note that our reference files use a maximum total area coverage of up to 400%, even for 7 channel color systems.
  • For Multicolor profiling - in contrast to CMYK Profiling - the test charts has to be adapted to the calculation algorithms in order to minimize color patches, otherwise, test charts would be exceptionally large.
    Note: Multicolor profiling differs from manufacturer to manufacturer. If you would like to use measured Multicolor test charts from other manufacturers in CoPrA, please note that these test charts may not achieve optimal results in CoPrA.
  • If it is not possible to reprint CoPrA's test charts and use existing measurement data from Multicolor test charts of other manufacturers, it is recommended to optimize these measurement data using ColorAnt before creating profiles in CoPrA. The Rescale tool allows adaption the measurement and reference values in ColorAnt according to suitable CoPrA test charts. Any missing measurement values will be interpolated which may result in inaccuracies if alternative test charts of other manufacturers reveal many gaps.
  • Special test charts, such as CMY test charts for printing systems that do not use black, are also available in the Testcharts/Multicolor folder.

For example, when working with CMY+Blue, use the appropriate test chart from the folder CMY+B.

Note: Previously, many users worked with standard CMYK test charts, such as ECI2002 or IT8/7-4, for color combinations without black, replacing the K channel with blue, e.g. CMY+Blue. Although this approach seems practicable at first glance, it is not recommended, because the process color black plays an entirely different role to a gamut extending color blue in CMYK test charts. Accordingly, many color combinations in the CMYK test charts are unnecessary, or even missing for a blue process color. It is preferable to use CoPrA in combination with CMY+X test charts in order to obtain the best possible profile quality.

ColorAnt | Redundancies

Redundancies

Correct Redundancies in measurement data

Redundancies

Redundant color patches can cause errors when creating profiles, especially if they have very different measurement values.
The Redundancies tool corrects the measured values of multiple color patches by averaging the redundant values. Corrected redundant color patches then have identical values.

The methods for correcting redundant color patches are the same as in the Averaging tool.

Auto: Different methods are used depending on the number of color patches. It is therefore quite possible that some color patches are processed with a different method than others. If there are two identical color patches with differing measurement values and one of the measurement values is recognized as an outlier, this method automatically selects the plausible color value.
For more than three color patches, the Weighted or Median methods are used. If there are a large number of measured values, both the Median and the Weighted methods consider values that are far apart to a lesser extent for averaging.
Note: Color patches within a gradient are automatically sorted according to their measurement values. This correction of “wrong” primary gradients is intentional since wrong primaries can lead to various other problems.

As the most intelligent method, Auto is preferable to the other methods.

Arithmetic: For the arithmetic averaging of values of several color patches, i.e. the average of the measurements (if, for example, only two color patches are to be averaged).

Median: Is a statistical method and denotes a boundary between two halves. The median is the “middle value” of a sorted list of numbers. Half of the numbers in the list are smaller and the other half of the numbers are larger than the median.

Weighted: Calculates a weighted mean value, i.e. a mean value to which some values contribute more than others. Outliers can be considered to a lesser extent for averaging.

Remove duplicate patches: Removes multiple color patches. First the average color value is calculated, then all but one identical color values are removed.

Note: The Redundancies tool can be used to average emissive data, such as multiple spectral measurements of a light source stored in a measurement file without DCS data. If the measurements are spectral, the averaging is performed on the spectral data.