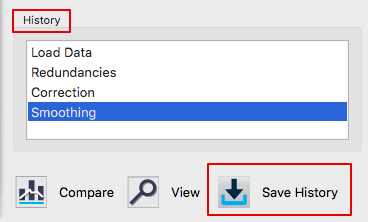
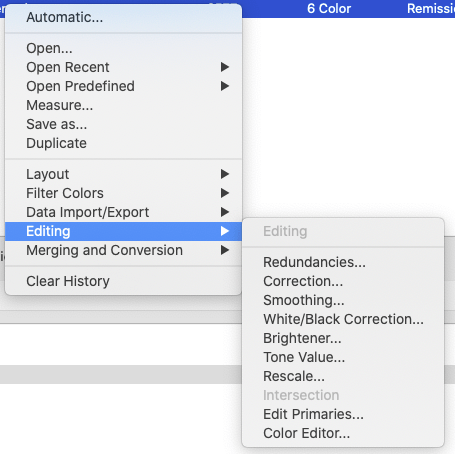
ColorAnt | Export CxF/X4

Export CxF/X-4

Creating CxF/X-4 files with custom options

Exporting a CxF/X-4 file from ColorAnt

The function Export CxF/X-4 exports spectral data as a Color exchange Format (CxF/X-4) compatible file. It can be found under File > Export CxF/X-4.

CxF files are used to communicate colors in a vendor-neutral way. CxF/X-4 has been an ISO standard since 2015 and is designed to define spot colors by measuring and storing spectral information of inks and colors on the substrate or process black. These spectral definitions allow for better proofing and reproduction of spot colors in color management systems. CxF/X-4 files can be loaded as a spot color library in ZePrA.

Procedure

    1. Open the spot color measurement file to be exported as a CxF/X-4 file (e.g., spectral measurement data of a test chart or any other measurement data with spot colors).
      Note: The file must contain device data (DCS data) and CIE spectral data. Neither Lab data nor pure spot color measurements without any percentage values are sufficient.
    2. Select File > Export CxF/X-4 to open the CxF/X-4 export dialog.
    3. Specify all relevant data such as Substrate Name, Substrate Type, Print Process and Surface Finishing.
      Note: These metadata are optional, but can be advantageous when using the CxF/X-4 file in other programs.
    4. Click on Start to export the file in CxF/X-4 format.

    Notes:

    • CxF/X-4 only refers to the characterization of spot colors. Therefore, only the full tones of each primary color (except black), overprint information of the corresponding color on black and hues are considered. So, when exporting a complete IT8-4 CMYK test chart, it will result in 102 color patches for CMY.
    • Redundancies are automatically removed when the data is exported.

    Include black gradient in export: By activating the checkbox, the black gradient is also exported.
    Typically, when exporting CxF/X-4 data from a complete test chart, only 100% black and overprinting spot colors with 100% black are included, but not the black gradient. However, adding the black gradient can be convenient if the black information from the CxF/X-4 data is to be used in other tools (e.g., in Edit Primaries).

    Note: Although the CxF/X-4 specification does not explicitly prohibit including the black gradient, the original idea is to specify spot colors, not black. Therefore, activating the checkbox can lead to incompatibilities with programs from other manufacturers.

    CxF/X-4 relates to spot color characterisation only, the full tone of each primary color except black, tints and overprints of the respective color with black are saved.

    As a result, if you export a complete iT8-4 CMYK test chart it ends up with 102 patches for CMY.

    Remove redundant patches: A feature to automatically optimize and remove redundant color patches is available with the Export CxF/X-4 (to save CxF/X-4 compatible measurement values). If the checkbox Remove redundant patches is activated all required color patches will be saved only once in the exported CxF/X-4 file, avoiding duplicates.
    Note: Color patches within a gradient are automatically sorted according to their measurement values. This correction of “wrong” primary gradients is intentional since wrong primaries can lead to various other problems.

    Include black gradient in export: Also exports the black gradient. Typically, when exporting CxF/X-4 data from a complete test chart, only 100 % black and overprinting spot colors with 100 % black are included, but not the black gradient. However, including the black gradient can be convenient if you want to use the black information from the CxF/X-4 data in other tools (for example, under Edit Primaries).

    Note: The CxF/X-4 specification does not explicitly prohibit saving the black gradient, but the original idea is to specify spot colors, not black. Therefore, activating the checkbox can lead to incompatibilities with programs from other manufacturers.

    ColorAnt | Measure

    Measure

    Measure test charts

    Measure Tool

    The Measure Tool is ColorLogic’s own tool for measuring test charts and spot colors. It can be opened in ColorAnt by selecting Measure in the Sidebar.


    Measuring with the Measure Tool

    Selection

    Select your device and connect it to the Measure Tool by clicking Connect.

    Note: If a measuring device is not recognized or does not work properly, make sure that no other software or service is accessing the device in the background.

    Other applications that support measurement devices may be connected to them by default. This is because the connection application (e.g., X-Rites i1Profiler Tray) is started by default at system startup and runs continuously in the background. So, when these applications are running, the Measure Tool may not be able to detect and connect to the measurement device. The solution is to launch the Activity Monitor (on macOS) or Task Manager (on Windows) and close the connection application (see screenshot).
    In addition, devices must not have an existing Bluetooth connection, otherwise they will not be recognized and cannot be connected to the Measure Tool.

    Light bulb icon: The Light bulb icon is shown when an instrument (such as the X-Rite i1Pro or the Konica Minolta FD-7) supports the Ambient Light Measurement mode. Clicking on this icon will switch between Ambient Light Measurement and the standard Reflectance Measurement. The mode can also be switched in the file menu Measure Mode. More information can be found in the chapter Ambient Light Measuring in Measure Tool below.

    Info

    Shows the current device information (if the selected device was found, version number and if the built-in filter is active).

    Options

    Direction: Specifies how the chart is measured. Depending on the selected device, single field measurements or strip measurements in horizontal or vertical direction are available.

    Evaluation: Allows you to compare the measured data with a profile of your choice. Click on the Gear icon and select the comparison profile from the list of profiles available on the system. All patches with a DeltaE deviation higher than 20 are highlighted in red on the chart. By default, evaluation is disabled.

    Note: The Evaluation can be deactivated by selecting the first entry Deactivated in the profile selection.

    Opening charts

    Charts can be opened via the File menu via the Recently used files and Predefined Charts entries. You can add your own charts to the list by placing them in the ColorAnt Wedges folder (User\Documents\ColorAnt\Wedges).  The menu entry Open chart directory takes you directly to the Wedges folder.
    Alternatively, simply load a reference file or drag it onto the window.

    Note: The Measure Tool and ColorAnt can be used in parallel. Additional files can be sent from ColorAnt to the Measure Tool while it is running. These files are added to the Reference list.

    When measurement data is found in the loaded data, the user has the option to either use this data for remeasurement or to delete the measurement data and use the reference data for a new measurement.

    Chart display area

    The chart display area shows the selected chart with row and column numbers.

    The next patch or row to be measured is highlighted by a yellow frame. If Evaluation is turned on, measured patches with a high DeltaE variance are marked in red.

    Show reference data (accessible under View in menu bar): Allows a split view of the patches. One half shows the reference color value, the other the measured color value.

    Fit to width (accessible under View in menu bar): The chart expands to the width of the window. For larger charts, a scroll bar appears on the right.

    Add measurement: Manually adds completed measurements to the Measurements list. Usually, completed measurements are automatically added to the list. However, for re-measurements the data must be added manually to the Measurements list using the Add measurement button.

    Measurements: Opens a list with all measurements of the current measuring session. The chart selected in the list is shown in the Measure Tool main window. More details about the Measurements window are available below.

    Transfer and exit: Transfers all data to the Data Sets section in ColorAnt’s Main Window and closes the Measure Tool.

    Reference: Lists all reference files added to the Measure Tool in the current session.

    Info icon: Hover the mouse pointer over the icon to display information about the chart, such as the name of the reference, the number of patches, rows and columns of the chart. This information is useful for some devices, for example, to set them up quickly and easily.

    Patch information: When hovering the mouse over a color patch, information about the respective patch is displayed, such as the patch number, the color space including reference values and measured values. When comparing with a profile, information about the DeltaE deviation is also displayed.

    Show: Select the measurement condition to be displayed. Only available for datasets containing multiple measurement conditions.

    Delete icon: Deletes all data measured so far and displays the chart with the reference values.

    Notification messages: On the left below the display area you will see various notes and messages about the current measurement. For example, when measuring charts, there may be instructions about changing charts, or a message indicating a questionable measurement in a row (e.g., when the wrong row has been measured).

    Help icon: The help icon on the bottom right takes you to ColorAnts Online Help with a single click.

    Measurements window:

    Date: Shows the date and time of the chart measurement.

    Content: The name of the measured chart.

    All: Selects all entries.

    None: De-selects all entries.

    Invert: Inverts the selection.

    Back: Returns to the Measure Tool.

    Trash can icon: Deletes selected measurements.

    Transfer: Transfers the selected data to ColorAnt’s Data Sets section and returns to the Measure Tool.

    Transfer and Quit: Transfers the selected data to ColorAnt’s Data Sets section and closes the Measure Tool.

    General Information on measurement conditions

    The ISO-Norm 13655:2009 defines the various measuring conditions M0, M1, M2 and M3.

    M0: Does not define a specific light source but recommends illuminant A. This illuminant represents domestic lighting with tungsten filament at a colour temperature of approximately 2856 Kelvin. The UV content of the light is not precisely defined. Consequently, according to ISO 13655, M0 is unsuitable if the paper fluoresces or if measurement data must be exchanged between locations.

    M1: If the substrate contains optical brighteners, this measuring condition minimizes the fluctuations of the measuring results between different devices. D50 must be used as illuminant, i.e. a daylight simulation with a colour temperature of 5003 Kelvin. The radiation intensities of the wavelengths are precisely defined, even those below 400 nm, since these wavelengths excite fluorescence.

    M2, also known as “UV-cut”: Applies only radiation energy above 400 nm wavelength to the sample, either through a filter advanced to the optics of the measuring instrument, or computationally. This ensures that fluorescence has no influence on the measurement results.

    M3: A polarizing filter is placed in front of the lens of the measuring instrument to suppress the effects of gloss effects on measurement data. Otherwise, the same requirements apply as for measurement condition M2.

    Ambient Light Measuring in Measure Tool

    The Measure Mode (in the menu bar) allows selecting either the Ambient Light Measurement mode (only for supported devices) or the standard Reflectance Measurement mode.

    If an instrument such as X-Rite i1Pro and Konica Minolta FD-7 supports both modes a light bulb button is shown in the user interface next to the instrument chooser. Clicking on this bulb button will switch between the modes. Alternatively users can switch the mode in the file menu Measure Mode.

    The Ambient Light Measurement mode allows measuring the spectral radiation of a light source as a single color patch.

    To measure, follow the instructions for the instrument calibration and preparation. An ambient light head must be placed on the instrument to measure the light source accordingly (see instruments manual). Depending on the instrument you may use the button on the instrument to measure or click the Measure button in Measure Tool.

    Once the measuring is finished the Luminance, Temperature (in Kelvin), Spectral and XYZ values are shown. If you wish to transmit the current measurement to ColorAnt click the Transmit button.

    Ambient light measurements are called Emission in the CIE Data Sets column in ColorAnt. They can be used in the CIE Conversion tool in ColorAnt or in the Viewing Condition section in CoPrAs printer profiling module.

    Instruments with Setup Wizards

    All supported instruments with Setup Wizards (e.g. the i1iO, Konica Minolta FD-9 and the Barbieri devices) can automatically import the Scan Options (chart size, Rows per page, Gap Size) from the reference file if available. Since these values no longer have to be entered manually, a major source of error during setup and subsequent measurement is eliminated. However, the Scan Options are ONLY stored in the reference file if it was created with the Export Chart tool of ColorAnt 5 (and higher). If this information is not contained in the reference file, it must – as before – be entered manually.

    Measuring multiple charts

    Multiple charts can be measured in a single session (without closing/opening the Measure Tool after each measurement). Measured charts are automatically added to the Measurements list. The number in brackets indicates the number of measurements. A previously measured chart can be added to this list by using Add measurement which is only enabled when a complete measurement data set is available. Clicking on Measurements opens the list containing all measurements.

    If a device with a wizard (positioning) is used (e.g., the X-Rite i1iO) the next measurement can be started by clicking on the Gears icon to enter the wizard/device settings. By clicking the Transfer and Quit button the data is directly sent to ColorAnt’s Data Sets section and the Measure Tool is closed.

    Remeasure faulty patches/rows

    Existing measurement data with erroneous measurement data can easily be corrected by simply remeasuring only the faulty parts (rows or patches) of the chart.

    If you find that some patches or rows have not been measured correctly in a measurement, you do not need to remeasure the entire chart. It is sufficient to remeasure only the erroneous patches or rows.

    To do this, simply load the file with the faulty measurement data and it will automatically be added to the Reference list. Basically, the existing measurement data can be retained in order to remeasure only the parts to be corrected, or the existing measurement data can be deleted in order to use only the reference data of the file for a new measurement.

    To remeasure individual patches or rows of the chart, answer the QuestionRetain existing measurement data for re-measurement?” with Yes.

    Note: If a file with multiple measurement conditions is loaded, select the appropriate Measurement Condition in the import dialog.

    Connect the measurement device and measure only the part to be corrected – a row, a patch, or an entire page. This remeasured part will then replace the faulty part of the measurement data.

    Note: By default, the first row/patch is selected, but any row or patch can be selected for reassessment. If a device supports the chosen measurement condition only in a combined multi measurement mode, the data of the selected condition will be copied into all condition slots.

    Once the remeasurements are completed, the measurement data has to be added to the Measurements list using Add measurement. Select either Transfer to transmit the data to the Data Sets section and return to the Measure Tool, or select Transfer and Quit to send the data to the Data Sets section and close the Measure Tool.

    Note: If the Measure Tool is opened by an application that only requests one data set/measurement (such as CoPrA or ZePrA), it will start in Single mode. In this mode it is only possible to measure a single file. Once the measurement is complete, transmit the data and quit or return to the Measure Tool:

    Click Back to choose another file or remeasure and correct the data. However, in Single mode only one measured data set is shown in the Measurements window. Measuring multiple charts will always overwrite the last measurement (because only one file can be transferred).

    If the data is measured with a device that supports multiple measurement conditions, the calling application will display the Import dialog, so that only one of the data sets can be selected for transfer.

    Supported Devices

    Barbieri


    Barbieri Spectro LFP
    Barbieri Spectro LFP qb
    Barbieri Spectropad

    Konica Minolta


    Konica Minolta FD-5
    Konica Minolta FD-7
    Konica Minolta FD-9

    MYIRO


    MYIRO-1
    MYIRO-9

    Techkon


    SpectroDens (Windows only)
    SpectroJet (Windows only)

    X-Rite


    X-Rite eXact
    X-Rite eXact2
    X-Rite i1Pro 1
    X-Rite i1Pro 2
    X-Rite i1Pro 3
    X-Rite i1iO
    X-Rite iO3
    X-Rite i1iSis 2/XL

    Important: Please make sure to install the latest device driver from the manufacturer, as missing or faulty drivers may cause problems. Some devices require Visual C++ Redistributable. Verify that the version required for your device is installed.

    Virtual Devices

    ColorAnt’s Measure Tool includes three Virtual Devices, the Virtual Device (manual), Virtual Device (spectral) and the Virtual Device (printer). The Virtual Device (spectral) is used for demonstration purposes. The Virtual Device (manual) allows you to manually enter Lab values for selected patches. For example, this is helpful if the device that measured the values is not connected to the Measure Tool or if an older device is used that only displays the measured values on the device itself.
    With the Virtual Device (printer) a typical offset printing behaviour can be simulated for test purposes.

    Virtual Device (spectral)

    Measurements using the Virtual Device (spectral)

    Step 1: Select the device from the drop-down list Selection.

    Step 2: Click on Connect.

    Options: Are available once the Virtual Device is connected. Select the Direction of the scan.

    Condition: M0, M1, M2, M3.

    Step 3: Start a measurement by double-clicking on the first patch of the first row.

    Step 4: When the measurement is complete, click on the Transfer icon to transfer all measurement data and return to the calling application (ColorAnt, CoPrA or ZePrA).

    If several measurement conditions have been used, the results/measured values of the individual conditions can be selected and viewed in the drop-down menu next to the Transfer icon.

    Note: The Virtual Device is for test purposes only and will simulate the same stored spectral data each time.

    Virtual Device (manual)

    Measurements using the Virtual Device (manual)

    Step 1: Select the device from the drop-down list Selection.

    Step 2: Click on Connect, a dialog with an input field for the Lab values appears.

    Condition: M0, M1, M2

    Step 3: Enter the appropriate Lab values and either press the enter key on your keyboard or click the Next button to select the next patch automatically. All required lab values can be entered in a single session.

    Step 4: Once editing is complete, click the Close button to finalize the manual measurement process.

    Step 5: When the measurement is complete, click on the Transfer icon to transfer all measurement data and return to the calling application (ColorAnt, CoPrA or ZePrA).

    Virtual Device (printer)

    Measurements using the Virtual Device (printer)

    Step 1: Select the device from the drop-down list Selection.

    Step 2: Click on Connect.

    Condition: M0, M1, M2, M0/M1/M2.

    Options: Are available once the Virtual Device is connected. Select the Direction of the scan.

    Step 3: Start a measurement by double-clicking on the first patch of the first row.

    Step 4: When the measurement is complete, click on the Transfer icon to transfer all measurement data and return to the calling application (ColorAnt, CoPrA or ZePrA).

    If several measurement conditions have been used, the results/measured values of the individual conditions can be selected and viewed in the drop-down menu next to the Transfer icon.

    Note: The virtual device is for test purposes only and simulates a typical offset printing behavior with always the same stored data.

    MYIRO

    MYIRO-1

    Measuring with the MYIRO-1

    Calibration

    Step 1: Select the device from the Selection drop-down.

    Step 2: Click Connect.

    Step 3: Make sure that the white reference head is mounted and click OK.

    Condition: Measurements are always carried out with the combined conditions M0/M1/M2. All available measuring conditions are always measured in a single step.

    Measure

    Step 1: Select the device from the Selection drop-down and perform the white calibration.

    Step 2: Under Options > Direction, select how you would like to measure the test chart. For measurements with the ruler we recommend the option Scan complete rows.

    Step 3: Place the instrument in front of the first patch of the row to be measured and press the measure button on the instrument. Keep the button pressed while moving the instrument across the strip and beyond the last patch. Release the button when done.

    Step 4: The data is transferred to the Measure Tool. Continue with the next row.

    Step 5: Once the measurement is complete, click on the Transfer icon to open the Transfer measurement dialog. Here the measurement data can be discarded or transferred to ColorAnt.

    ColorAnt allows the transmission of individual or all available measurement conditions. In the latter case, several data sets are transmitted. For easy differentiation, the measurement condition is appended to the file name of each data set.

    Ambient Light Measuring

    Ambient light measurements can be performed either using the Measure Tool 4.0 or from within the CIE Conversion tool.

    Note: Requires the separately available ambient light head for the MYIRO-1.

    Measure Tool: Select the Ambient Light Measurement mode from the menu Measure Mode or click on the light bulb icon next to the Selection drop-down menu.

    CIE Conversion: Select Emission (Measure) from the drop-down list Illumination. This will open the Measure Tool.

    Step 1: Select the device from the Selection drop-down list in the Device tab and perform the white calibration as described above. After calibration, confirm the message Please prepare the device for ambient light measuring.

    Step 2: Attach the ambient light head to the device.

    Step 3: Click on Measure.

    Step 4: Transfer the measured data to ColorAnt by clicking Transmit.

    The measured values will be displayed either in the panel Data Sets (when using the Measure Tool directly) or in the CIE conversion tool.

    Step 5 (CIE conversion only): Click on Start. The data of the ambient light measurement are used to convert the selected spectral data to the new viewing condition.

    MYIRO-9

    Measuring with the MYIRO-9

    Step 1: Select the MYIRO-9 from the Selection drop-down list in the Device tab.

    Step 2: Click on Connect.

    Using the MYIRO-9 over the network

    The MYIRO-9 can be connected to the local area network via Ethernet, which allows direct transfer of measurement data to computers on the same LAN/WLAN.

    Configure the network settings on the instrument according to the MYIRO-9 user manual.

    In the ColorAnt Measure Tool, select the MYIRO-9, click on the network icon and enter the IP address of the MYIRO-9 in the address field. Click OK to establish the connection.

    Note: A USB connection always has priority. If the device is to be used via LAN/WLAN, disconnect the USB cable.

    Device options

    Once the device is connected, the Setup Wizard opens:

    Settings

    Measurement condition: M0, M1, M2, M3.

    Rows per page: Define the number of rows on your chart. If the chart contains several pages, define the number of lines on the first page.

    Number of pages: Automatically calculates the number of pages.

    Freeform: Put the chart on the table of your MYIRO-9 and the device will recognize it automatically.

    Target: Requires the definition of the chart size, patches, etc., and the MYIRO-9 will search the page for a chart that fits the parameters.

    Measure

    Step 1: After connecting the device the Setup Wizard opens.

    Step 2: Define the settings and click Start.

    Step 3: The MYIRO-9 will display a message to insert the chart. Insert the chart and wait until the measurement process is completed.

    Step 4: Once the measuring is complete the data will be displayed in the Measure Tool. Save the data and continue.

    Barbieri Devices

    Barbieri SpectroPad

    Measuring with the Barbieri SpectroPad

    Step 1: Select the device from the Selection drop-down list in the Device tab.
    Step 2: Click Connect.

    Device Options

    Once the device is connected, the Barbieri Setup Wizard of the SpectroPad opens:

    Chart options

    Chart width: Specify the width of the chart in millimeters.
    Horizontal gap: Specify the width of a patch separator.
    Measurement condition: M0, M1, M2.
    Aperture: Choose between Default and 6.
    Once all settings have been made, you can specify in the main window under Direction how you want to measure the chart.

    Measure

    Step 1: After selecting and connecting the device, define the required settings and click Start.
    Step 2: Start the measurement with the row marked in the window.
    Note: With the SpectroPad, the charts are measured line by line from bottom to top so that the instrument does not run over the lines of the chart that are still to be measured.
    Step 3: When the measurement is complete, click on the Transfer icon to open the Transfer measurement dialog. Here the measurement data can be discarded or transferred to ColorAnt.

    Barbieri Spectro LFP

    Measuring with the Barbieri Spectro LFP

    Step 1: Select the device from the Selection drop-down list in the Device tab.

    Step 2: Click Connect.

    Device Options

    Once the device is connected, the Barbieri Setup Wizard of the LFP opens:

    Type of Measurement

    Choose between Remission or Transmission measurements. Be sure to use the appropriate sample holder (reflection or transmission sample holder) for the selected Type of Measurement!

    Chart options

    Start with page: Select the first page to be measured, e.g., when re-measuring pages.

    Rows on (first) page: Enter the number of rows on the test chart page. If the test chart consists of multiple pages, enter the number of rows on the first page.
    Horizontal patch gap: Specify the height of the horizontal patch separator in mm.
    Vertical patch gap: Specify the height of the vertical patch separator in mm.

    Measure options

    Measurement condition: M0, M1, M2, M3.
    Aperture: Choose between Default, 2, 6, 8 or manual.
    Calibration Mode:

    1. Fast: Calibrated at the beginning of each test chart page.
    2. Accurate: Calibrates every second line.

    Measure Mode:

    1. Fast (default)
      Fast measuring mode is the default mode of the Spectro LFP. In this mode the measuring head lies on the target and the
      surface is scanned.
    2. Up-Down
      In up-down mode the measuring head of the instrument moves up
      and down between each measurement. Use this mode for sensitive
      materials to avoid any scratches on the surface of the target.
    3. Contactless
      The contactless mode is similar to the above fast mode with a
      difference that the measuring head does not touch the surface
      of the target. This measuring mode is suitable for sticky and
      sensitive materials.

    Note: The fast measure mode Fast (default) always uses the same amount of
    light and can therefore measure dark and bright samples equally fast. However, the disadvantage is that dark samples in particular are not recorded with sufficient accuracy. The single contact measure mode Up-Down is advantageous here, because
    the required amount of light can be individually adjusted for each color patch. This leads to a better differentiation, especially with dark colors.

    Start: Starts the measurement of the chart.

    Positioning

    Use auto positioning: The Barbieri Spectro LFP has an automatic positioning feature. In this process, the camera searches for the auto-positioning lines on the test chart. Disable the checkbox to manually position the measuring head.

    Manual Positioning
    Use the controls for the manual positioning on the right side to position the measuring head exactly above the upper left corner using the arrow keys or by entering the x/y coordinates. The measuring head should then be positioned on the outermost corner of the marked patch.

    Use the four arrows to change the position of the measuring head (left, right, up, down). The head can be raised and lowered with the double arrow in the center.

    Tip: Change the position of the head with the corresponding arrow keys on your keyboard.
    Steps: Specifies the distance covered by the measuring head when an arrow is clicked.

    Position: Moves the measuring head to the entered x/y coordinates.

    Once you are finished, click Next to specify the upper right corner of the chart.

    Confirm with Next.

    On the last page, enter the position of the lower right corner and confirm with Next.

    Multipage test charts

    Manual positioning

    If the test chart has multiple pages, a message appears after measuring a page prompting to place the next page on the table:

    1. Place the next test chart page on the table.
    2. Recalibrate the table and use the manual controls as described above to indicate two corners of the chart. The third corner is calculated automatically.
    3. Click Start to measure the next page.

    Important: If the second page was placed EXACTLY where the first page was, you can continue without recalibrating. The previously set coordinates will then be used again.

    Automatic positioning
    When auto positioning is selected:

    The checkbox Use auto positioning is activated automatically.

    Click Start to autoposition and measure the next page.

    Important: In order to use auto positioning, the chart needs the appropriate margins and markings.

    Creating charts with Barbieri gateway and measuring using ColorAnt:

    To create ColorLogic charts within Barbieri Gateway’s chart generator, including the auto positioning feature, follow the procedure below:

    Copy the ColorLogic charts to the user directory: Myuser>Documents>Barbieri>Gateway
    Start the Barbieri Chart Generator and select the reference file from the CLReferencesBarbieri folder.

    Add the desired options to the chart, e.g. auto positioning markings, reference area, etc., and Save the target file.

    Load the reference file into ColorAnt by dragging and dropping the .ref file onto the Data Sets window. The target file can be found in the Gateway>Targets folder.

    If the patches do not match the printed chart, right-click on the reference in the Data Sets window and select Swap Rows with Columns. Check the patch arrangement again in the View tool.

    Select the reference file and  click Measure. Ensure that the correct chart has been selected. Select the Spectro LFP from the device list and click Connect.

    Once the device is connected, the Spectro LFP wizard will be displayed. Simply select auto positioning and click Start.

    Barbieri Spectro LFP qb

    Measuring with the Barbieri Spectro LFP qb

    Step 1: Select the device from the Selection drop-down list.

    Step 2: Click Connect.

    Once the device is connected, the Barbieri Setup Wizard of the LFP qb opens:

    Type of Measurement

    Choose between Remission or Transmission measurements. Be sure to use the appropriate sample holder (reflection or transmission sample holder) for the selected Type of Measurement !

    Chart options

    Start with page: Select the first page to be measured, e.g., when re-measuring pages.

    Rows on (first) page: Enter the number of rows on the test chart page. If the test chart consists of multiple pages, enter the number of rows on the first page.
    Horizontal patch gap: Specify the height of the horizontal patch separator in mm.
    Vertical patch gap: Specify the height of the vertical patch separator in mm.

    Measure options
    Measurement condition
    : M0, M1, M2, M3.
    Aperture: Choose between Automatic, 2, 6 or 8.

    Measure Mode:

    1. Fast (default)
      Fast measuring mode is the default mode of the Spectro LFP. In this mode the measuring head lies on the target and the
      surface is scanned.
    2. Patch by Patch (more accurate)
      In this mode the measuring head of the instrument moves up
      and down between each measurement. Use this mode for sensitive
      materials to avoid any scratches on the surface of the target.
    3. Contactless
      The contactless mode is similar to the above fast mode with a
      difference that the measuring head does not touch the surface
      of the target. This measuring mode is suitable for sticky and
      sensitive materials.

    Note: The fast measure mode Fast (default) always uses the same amount of
    light and can therefore measure dark and bright samples equally fast. However, the disadvantage is that dark samples in particular are not recorded with sufficient accuracy. The single contact measure mode Up-Down is advantageous here, because
    the required amount of light can be individually adjusted for each color patch. This leads to a better differentiation, especially with dark colors.

    Start: Starts the measurement of the chart.

    Positioning

    Use Auto Positioning: The Barbieri Spectro LFP qb provides three positioning options. Enable the checkbox to select one of the automatic positioning options or disable the checkbox to manually position the head.

    Auto Recognition: The camera automatically recognizes the chart without the auto-position lines (requires the camera).

    Auto Positioning: The camera automatically detects the chart using the auto-position lines (requires the camera).

    Manual Positioning: Enter the position of the test chart corners manually.

    Auto Recognition (Automatic positioning by using the camera)
    Autopositioning is done by capturing an image with the camera and calculating the corner points.
    Note: If the picture processing fails, the device switches to the automatic positioning where the camera is used to detect the auto-position lines and determine the corner points.

    Auto Positioning (Automatic positioning by using the camera)
    In automatic positioning, the camera searches for the auto-position lines. Therefore, this option requires the chart to have the necessary auto-position lines in place.

    Manual Positioning
    Use the controls for the manual positioning on the right side to position the measuring head exactly above the upper left corner using the arrow keys or by entering the x/y coordinates. The measuring head should then be positioned on the outermost corner of the marked patch.

    Use the four arrows to change the position of the measuring head (left, right, up, down). The head can be raised and lowered with the double arrow in the center.

    Tip: Change the position of the head with the corresponding arrow keys on your keyboard.
    Steps: Specifies the distance covered by the measuring head when an arrow is clicked.

    Position: Moves the measuring head to the entered x/y coordinates.

    Once you are finished, click Next to specify the upper right corner of the chart.

    Confirm with Next.

    On the last page, enter the position of the lower right corner and confirm with Next.

    Multipage test charts

    Manual positioning

    If the test chart has multiple pages, a message appears after measuring a page prompting to place the next page on the table:

    1. Place the next test chart page on the table.
    2. Recalibrate the table and use the manual controls as described above to indicate two corners of the chart. The third corner is calculated automatically.
    3. Click Start to measure the next page.

    Important: If the second page was placed EXACTLY where the first page was, you can continue without recalibrating. The previously set coordinates will then be used again.

    Creating charts with Barbieri gateway and measuring using ColorAnt

    To create ColorLogic charts within Barbieri Gateway’s chart generator, including the auto positioning feature, follow the procedure below:

    Copy the ColorLogic charts to the user directory: Myuser>Documents>Barbieri>Gateway
    Start the Barbieri Chart Generator and select the reference file from the CLReferencesBarbieri folder.

    Add the desired options to the chart, e.g., auto positioning markings, reference area, etc., and Save the target file.

    Load the reference file into ColorAnt by dragging and dropping the .ref file onto the Data Sets window. The target file can be found in the Gateway>Targets folder.

    If the patches do not match the printed chart, right-click on the reference in the Data Sets window and select Swap Rows with Columns. Check the patch arrangement again in the View tool.

    Select the reference file and click Measure. Ensure that the correct chart has been selected. Select the Spectro LFP qb from the device list and click Connect.

    Once the device is connected, the Spectro LFP qb wizard will be displayed. Simply select auto positioning and click Start.

    Konica Minolta Devices

    Konica Minolta FD-7

    Measuring with the Konica Minolta FD-7

    Calibration

    Step 1: Select the device from the Selection drop-down list in the Device tab.

    Step 2: Click Connect.

    Step 3: Set the device on the white reference with the Target Mask attached. Correctly place it on the calibration tile and press it down. Click OK and keep the device pressed down until the measuring mode can be selected in the upper left-hand corner of the measuring window.

    Device options

    Once the device is connected and calibrated, the measurement options become available.
    Condition: M0, M1, M2.
    Direction: Specify the mode of the measurement.

    Measure

    Step 1: Select the device from the Selection drop-down list in the Device tab and perform the white calibration as described above.

    Step 2: Place the instrument in front of the first patch of the line to be measured and press the measure button of the instrument. Hold down the button and move the device over the strip until after the last patch. Release the button.

    Step 3: The data is transferred to the Measure Tool and you can proceed to the next line.

    Step 4: Once the measurement is complete, click on the Transfer icon to open the Transfer measurement dialog. Here the measurement data can be discarded or transferred to ColorAnt.

    Ambient Light Measuring

    Ambient light measurements can be performed either using the Measure Tool 2.0 or from within the CIE Conversion tool.

    Measure Tool: Select the Ambient Light Measurement mode from the menu Measure Mode or click on the light bulb icon next to the Selection drop-down menu.
    CIE Conversion: Select Emission (Measure) from the drop-down list Illumination. This will start the Measure Tool.

    Step 1: Select the device from the Selection drop-down list in the Device tab and perform the white calibration as described above. After calibration, confirm the message Please prepare the device for ambient light measuring.

    Step 2: Attach the ambient light head to the device.

    Step 3: Click on Measure.

    Step 4: Transfer the measured data to ColorAnt by clicking Transmit.
    The measured values will be displayed either in the panel Data Sets (when using the Measure Tool directly) or in the CIE conversion tool.

    Step 5 (CIE conversion only): Click on Start. The data of the ambient light measurement are used to convert the selected spectral data to the new viewing condition.

    Konica Minolta FD-9

    Measuring with the Konica Minolta FD-9

    Step 1: Select the FD-9 from the Selection drop down list in the Device tab.

    Step 2: Click on Connect.

    Using the Konica Minolta FD-9 over the network

    The Konica Minolta FD-9 can be connected to the local area network via Ethernet, which allows direct transfer of measurement data to computers on the same LAN/WLAN.

    Configure the network settings on the instrument according to the Konica Minolta FD-9 user manual.

    In the ColorAnt Measure Tool, select the Konica Minolta FD-9, click on the network icon and enter the IP address of the FD-9 in the address field. Click OK to establish the connection.

    Note: A USB connection always has priority. If the device is to be used via LAN/WLAN, disconnect the USB cable.

    Device options

    Once the device is connected, the Setup Wizard opens:

    Settings

    Measurement condition: M0, M1, M2, M3.

    Lines per page: Define the number of lines on your chart. If the chart contains several pages, define the number of lines of the first page.

    Number of pages: Automatically calculates the number of pages.

    Freeform: Put the chart on the table of your FD-9 and the device will recognize it automatically.

    Target: Requires the definition of the chart size, patches etc., and the FD-9 will search the page for a chart that fits the parameters.

    Measure

    Step 1: After connecting the device the Setup Wizard opens.

    Step 2: Define the settings and click Start.

    Step 3: The FD-9 will display a message to insert the chart. Insert the chart and wait until the measurement process is completed.

    Step 4: Once the measuring is complete the data will be displayed in the Measure Tool. Save the data and continue.

    Techkon Devices

    Techkon SpectroDens

    Measuring with the Techkon SpectroDens

    Important: Techkon devices are only available under Windows.
    Techkon devices also require the TechkonDeviceServer service from Techkon GmbH for operation which is available for download here: http://www.colorlogic.de/Seiten/Download/TDService.2.0.0.8.exe

    Step 1: Choose the device from the Selection drop-down list in the Device tab.

    Step 2: Click Connect.

    Step 3: Place the device on the white reference patch. Confirm by clicking OK.

    White Reference Calibration

    Device options

    Once the device is connected the Setup Wizard of the SpectroDens opens:

    Settings

    Measurement condition: M0, M1, M2, M3.

    Polarization Filter: Depending on your instrument version, the polarization filter can be adjusted manually or automatically. If this is purely automatic, the selection is grayed out and dependent on the selection of the measurement condition.
    Illuminant: Choose between A, C, D50, D65, F2, F7 and F11. Illumination depends on the measure condition.
    Observer: Choose between O2 and O10.
    Select how to measure the chart in the main window under Direction.

    Measure

    Step 1: In the Device tab, select the device from the Selection drop-down list and start the white calibration.

    Step 2: Place the device on the first patch of the line. Press down the measure button of the device and move over the line of patches until crossing the last patch in line. Release the button.

    Step 3: Data will be transferred to the Measure Tool. Continue with the next line.

    Step 4: Once the measurement is complete, click on the Transfer icon to open the Transfer measurement dialog. Here the measurement data can be discarded or transferred to ColorAnt.

    Techkon SpectroJet

    Measuring with the Techkon SpectroJet

    Important: Techkon devices are only available under Windows.
    Techkon devices also require the TechkonDeviceServer service from Techkon GmbH for operation which is available for download here: http://www.colorlogic.de/Seiten/Download/TDService.2.0.0.8.exe

    Step 1: Choose the device from the Selection drop-down list in the Device tab.

    Step 2: Click Connect.

    Step 3: Place the device on the white reference patch. Confirm and click OK.

    White Reference Calibration

    Device options

    Once the device is connected, the Setup Wizard for the SpectroJet opens:

    Settings

    Patch Width: Specify the patch width in millimeters.
    Gap Width: Enter the width of the patch separator in millimeters.
    Measure Condition: M0, M1, M2, M3.
    Polarization Filter: Depending on your instrument version, the polarization filter can be adjusted manually or automatically. If this is purely automatic, the selection is grayed out and dependent on the selection of the measure condition.
    Illuminant: Choose between A, C, D50, D65, F2, F7 and F11. Illumination depends on the Measure condition.
    Observer: Choose between O2 and O10.
    Select how to measure the chart in the main window under Direction.

    Measure

    Step 1: In the Device tab, select the device from the Selection drop-down list and start the white calibration.

    Step 2: Place the device on the first patch of the row. Press the measure button on the device once. Move over the row of patches until the last patch of the row.

    M0 & M3: Measuring the row one time is sufficient for accurate measurement.

    M1 & M2: The device display prompts for a second measurement to complete the dual measurement.

    Tip: If a measurement fails, retry by adding more distance before the first patch and behind the last patch.

    Step 3: Data will be transferred to the Measure Tool and continue measuring the next line.

    Step 4: Save the data once all the rows have been measured.

    X-Rite Devices

    X-Rite eXact

    Measuring with the X-Rite eXact

    Step 1: Choose the device from the Selection drop-down list in the Device tab.

    Step 2: Click on Connect.

    Step 3: If asked to do a white calibration, confirm by clicking on OK. White calibration is done by the device internally.

    White Reference Calibration

    Device options

    When the device connects, the eXact Setup Wizard opens:

    eXact Setup Wizard

    Settings

    Patch Width (mm): Automatically calculates the width of a single patch.

    Gaps Width (mm): Specify the gaps width in millimeters.
    Chart Width (mm): Specify the chart width in millimeters.
    Measurement Condition: M1 and M0/M2/M3. Use the slide switch on the unit to switch between the two available conditions – M1 and M0/M2/M3. In M0/M2/M3 mode, all available measurement conditions are measured in one pass.

    Once all settings have been made, you can select how the chart is to be measured in the main window under Direction.

    Measure

    Step 1: In the Device tab, select the device from the Selection drop-down list and start the white calibration.

    Step 2: Place the device on the first patch of the row and press down the folding mechanism of the device. This will start the measurement. Wait for the beep and, with the instrument pressed down, move over the strip to the last patch in the row. The measurement will stop automatically. Release the device.

    Step 3: The data will be transferred to the Measure Tool. Continue with the next line.

    Step 4: When the measurement is complete, click on the Transfer icon to open the Transfer measurement dialog. Here the measurement data can be discarded or transferred to ColorAnt.

    If several measurement conditions have been used, the results/measured values of the individual conditions can be selected and viewed in the drop-down menu next to the Transfer icon.

    Measure (single patch mode)

    To measure in single patch mode without the scan attachment, proceed as follows:

    Step 1: Select the device from the Selection drop-down list in the Device tab and start the white calibration.

    Step 2: After closing the settings dialog with OK, select the direction Patches – Line by Line under Options in the upper right corner of the main window.

    Step 3: Place the device on the first patch of the row and press down the folding mechanism of the device. This will start the measurement. After you hear the beep, you can lift up the instrument.
    Step 4: The data is transferred to the Measure Tool and you can continue with the next patch.

    Step 5: When the measurement is complete, click on the Transfer icon to open the Transfer measurement dialog. Here the measurement data can be discarded or transferred to ColorAnt.

    If several measurement conditions have been used, the results/measured values of the individual conditions can be selected and viewed in the drop-down menu next to the Transfer icon.

    X-Rite eXact2

    Measuring with the X-Rite eXact2

    Step 1: Choose the device from the Selection drop-down list in the Device tab.

    Step 2: Click on Connect.

    Step 3: If asked to do a white calibration, confirm by clicking on OK. White calibration is done by the device internally.

    White Reference Calibration

    Using the X-Rite eXact2 over the network

    The X-Rite eXact2 can be connected to the local area network via Ethernet, which allows direct transfer of measurement data to computers on the same LAN/WLAN.

    Configure the network settings on the instrument according to the X-Rite eXact2 user manual.

    In the ColorAnt Measure Tool, select the X-Rite eXact2, click on the network icon and enter the IP address of the eXact2 in the address field. Click OK to establish the connection.

    Note: A USB connection always has priority. If the device is to be used via LAN/WLAN, disconnect the USB cable.

    Device options

    When the device connects, the eXact2 Setup Wizard opens:

    eXact2 Setup Wizard

    Settings

    Measurement Condition: In M0/M1/M2/M3 mode, all available measurement conditions are measured in one pass.

    Patch Width (mm): Automatically calculates the width of a single patch.
    Gaps Width (mm): Specify the gaps width in millimeters.
    Chart Width (mm): Specify the chart width in millimeters.

    Once all settings have been made, select how the chart is to be measured in the main window under Direction.

    Measure

    Step 1: In the Device tab, select the device from the Selection drop-down list and start the white calibration.

    Step 2: Place the device on the first patch of the row and press the measuring button at the side. Press once in patch mode for single field measurement or keep pressed for strip measurement. Move over the strip to the last patch in the row. The measurement will stop automatically. Release the measuring button.

    Step 3: The data will be transferred to the Measure Tool. Continue with the next line.

    Step 4: When the measurement is complete, click on the Transfer icon to open the Transfer measurement dialog. Here the measurement data can be discarded or transferred to ColorAnt.

    If several measurement conditions have been used, the results/measured values of the individual conditions can be selected and viewed in the drop-down menu next to the Transfer icon.

    Measure (single patch mode)

    To measure in single patch mode without the scan attachment, proceed as follows:

    Step 1: Select the device from the Selection drop-down list in the Device tab and start the white calibration.

    Step 2: After closing the settings dialog with OK, select the direction Patches – Line by Line under Options in the upper right corner of the main window.

    Step 3: Place the device on the first patch of the row and press the measuring button of the device. This will start the measurement.

    Step 4: The data is transferred to the Measure Tool and you can continue with the next patch.

    Step 5: When the measurement is complete, click on the Transfer icon to open the Transfer measurement dialog. Here the measurement data can be discarded or transferred to ColorAnt.

    If several measurement conditions have been used, the results/measured values of the individual conditions can be selected and viewed in the drop-down menu next to the Transfer icon.

    X-Rite i1Pro 1

    Measuring with the X-Rite i1Pro 1

    Step 1: Choose the device from the Selection drop-down list in the Device tab.

    Step 2: Click Connect.

    Step 3:  Place the device on the white reference and click OK.

    White Reference Calibration

    Device Options

    As soon as the device is connected define the Measurement Condition.

    Settings

    Measure Condition: M0 (Single), M0/M1/M2 (Dual).
    Note: The measure condition can only be selected with the i1 Pro-2.
    Once all settings have been made, you can select how the chart is to be measured in the main window under Direction.

    Measure

    Step 1: Choose the device from the Selection drop-down list in the Device tab and perform white calibration.

    Step 2: Place your device in front of the first patch of the first row and press the measure button of your device. Keep the button pressed and move over the entire row. Release the button.

    Step 3: The data will be transferred to the Measure. Continue with the next row.

    Step 4: After measuring all rows save the data in Measure Tool.

    Step 5: When the measurement is complete, click on the Transfer icon to open the Transfer measurement dialog. Here the measurement data can be discarded or transferred to ColorAnt.

    If several measurement conditions have been used, the results/measured values of the individual conditions can be selected and viewed in the drop-down menu next to the Transfer icon.

    Dual Mode: If dual mode was selected each row needs to be measured twice. After measuring in one direction, the LED on the device indicates the direction to be measured next.

    X-Rite i1Pro 2

    Measuring with the X-Rite i1Pro 2

    Calibration

    Step 1: Select the device from the Selection drop-down list in the Device tab.

    Step 2: Click Connect.

    Step 3: Set the device on the white reference. Correctly place it on the calibration tile and click OK. The instrument will be calibrated.

    Device Options

    When the instrument has been connected, the Setup Wizard opens, showing the Measurement Options for the instrument.

    Use Zebra Ruler: Using the ruler improves the M0 single scan measurement, but is not required and can be deactivated with the checkbox. The ruler allows a more precise control of the position/speed of the measuring device, which reduces the risk of measurement errors.

    Ambient Light Measuring

    Ambient light measurements can be performed either using the Measure Tool 2.0 or from within the CIE Conversion tool:

    Measure Tool: Select the Ambient Light Measurement mode from the menu Measure Mode or click on the light bulb icon next to the Selection drop-down menu.

    CIE Conversion: Select Emission (Measure) from the drop-down list Illumination. This will open the Measure Tool.

    Step 1: Select the device from the Selection drop-down list in the Device tab and perform the white calibration as described above. After calibration, confirm the message Please prepare the device for ambient light measuring.

    Step 2: Attach the ambient light head to the device.

    Step 3: Click on Measure.

    Step 4: Transfer the measured data to ColorAnt by clicking Transmit.

    The measured values will be displayed either in the panel Data Sets (when using the Measure Tool directly) or in the CIE conversion tool.

    Step 5 (CIE conversion only): Click on Start. The data of the ambient light measurement are used to convert the selected spectral data to the new viewing condition.

    X-Rite i1Pro 3

    Measuring with the X-Rite i1Pro 3

    Calibration

    Step 1: Select the device from the Selection drop-down list.

    Step 2: Click Connect.

    Step 3: Set the device on the white reference. Correctly place it on the calibration tile and click OK. The instrument will be calibrated.

    Measurement Options

    When the instrument has been connected, the Setup Wizard opens, showing the Measurement Options for the instrument.

    Use Zebra Ruler: Using the ruler improves the M0 single scan measurement, but is not required and can be deactivated with the checkbox. The ruler allows a more precise control of the position/speed of the measuring device, which reduces the risk of measurement errors.

    Measurement Condition: M0/M1/M2 or M3. With the combined conditions M0/M1/M2 all available measurement conditions are always measured in a single step. To be able to measure in M3 mode, the corresponding polarisation filter head must be mounted to the instrument before connecting the instrument. The Measure Tool automatically detects which head is currently in use and sets the Measurement Condition accordingly.

    When all settings have been made, define how the chart is to be measured under Direction in the main window.

    Measure

    Step 1: Select the device from the Selection drop-down and perform the white calibration.

    Step 2: Under Options > Direction, select how you would like to measure the test chart. For measurements with the ruler we recommend the option Scan complete rows.

    Step 3: Place the instrument in front of the first patch of the row to be measured and press the measure button on the instrument. Keep the button pressed while moving the instrument across the strip and beyond the last patch. Release the button.

    Step 4: The data is transferred to the Measure Tool. Continue with the next row.

    Step 5: Once the measurement is complete, click on the Transfer icon to open the Transfer measurement dialog. Here the measurement data can be discarded or transferred to ColorAnt.

    ColorAnt allows the transmission of individual or all available measurement conditions. In the latter case, several data sets are transmitted. For easy differentiation, the measurement condition is appended to the file name of each data set.

    Ambient Light Measuring

    Ambient light measurements can be performed either using the Measure Tool or from within the CIE Conversion tool:

    Measure Tool: Select the Ambient Light Measurement mode from the menu Measure Mode or click on the light bulb icon next to the Selection drop-down menu.

    CIE Conversion: Select Emission (Measure) from the drop-down list Illumination. This will open the Measure Tool.

    Step 1: Select the device from the Selection drop-down list in the Device tab and perform the white calibration as described above. After calibration, confirm the message Please prepare the device for ambient light measuring.

    Step 2: Attach the ambient light head to the device.

    Step 3: Click on Measure.

    Step 4: Transfer the measured data to ColorAnt by clicking Transmit.

    The measured values will be displayed either in the panel Data Sets (when using the Measure Tool directly) or in the CIE conversion tool.

    Step 5 (CIE conversion only): Click on Start. The data of the ambient light measurement are used to convert the selected spectral data to the new viewing condition.

    X-Rite i1iO

    Measuring with the X-Rite i1iO

    Step 1: Choose the device from the Selection drop-down list in the Device tab.

    Step 2: Click Connect.

    Device options

    Once the device is connected the Setup Wizard of the i1iO opens:

    Settings

    Rows per page: Specify the number of rows. If the chart contains several pages, specify the number of rows of the first page.

    Gap Size (horizontal/vertical): Specify the width of vertical and horizontal gaps as required.

    Number of pages: Automatically calculates the number of pages.

    Measurement condition: M0 (Single), M0,M1,M2 (Dual).

    Note: M0 (Single) measurements support a minimum patch size of 7 mm wide and 6 mm high. In this mode every row is measured once. The different Dual modes need patches that are at least 8 mm wide and 7.5 mm high. The rows will be measured twice.

    Note: If you are using an older i1Pro (up to RevD), only the M0 mode is available. The dual measurement is only supported by the newer i1Pro-2.

    Measure

    Step 1: After selecting and connecting your device the Setup Wizard starts.

    Step 2: Specify the rows and gaps, then click Next to proceed.

    Step 3: On the next page define the Chart Corners (1 top left, 2 bottom left, 3 bottom right).
    Note: To avoid small measurement errors, the fourth chart corner can also be defined.

    Step 4: To define a corner, place the crosshairs of the slide in the middle of the corresponding patch (in the respective corner) and press the i1 measuring button once.

    Step 5: The Setup Wizard now continues with the next corner. Repeat step 4 for the lower left corner and then for the lower right corner.

    Information: If you need to correct corners click on Delete Corner Points.

    Step 6: After defining the corners begin measuring with Start.

    Step 7: When the measurement is complete, click on the Transfer icon to open the Transfer measurement dialog. Here the measurement data can be discarded or transferred to ColorAnt.

    If several measurement conditions have been used, the results/measured values of the individual conditions can be selected and viewed in the drop-down menu next to the Transfer icon.

    Multipage Test Charts

    Step 1: When measuring multilateral test charts, the Setup Wizard reopens after measuring the first page.

    Step 2: Put the next page on the iO table and make sure that the right chart image is selected. Define the Chart Corners again and start the measuring process by clicking on Start.

    Step 3: Repeat these steps until all pages are measured.

    Step 4: After measuring all pages of the test chart save the data for further processing.

    X-Rite i1iO3

    Measuring with the X-Rite i1iO3

    Step 1: Choose the device from the Selection drop-down list.

    Step 2: Click Connect.

    Device options

    Once the device is connected the Setup Wizard of the i1iO3 opens:

    Settings

    Scan Options

    Rows per page: Specify the number of rows. If the chart contains several pages, specify the number of rows of the first page.

    Gap Size (horizontal/vertical): Specify the width of vertical and horizontal gaps as required.

    Number of pages: Automatically calculates the number of pages.

    Measure Options

    Measurement Condition: M0/M1/M2 or M3. With the combined conditions M0/M1/M2 all available measurement conditions are always measured in a single step. To be able to measure in M3 mode, the corresponding polarisation filter head must be mounted to the instrument before connecting the instrument. The Measure Tool automatically detects which head is currently in use and sets the Measurement Condition accordingly.

    When all settings have been made, define how the chart is to be measured under Direction in the main window.

    More accurate (Patch by Patch): By activating the checkbox, a step-by-step single patch measurement is performed instead of a strip measurement.

    Measure

    Step 1: After selecting and connecting your device the Setup Wizard starts.

    Step 2: Specify the rows and gaps, then click Next to proceed.

    Step 3: On the next page define the Chart Corners (1 top left, 2 bottom left, 3 bottom right).
    Note: To avoid small measurement errors, the fourth chart corner can also be defined. To do so, please tick the checkbox Enable fourth corner.

    Step 4: To define a corner, place the crosshairs of the slide in the middle of the corresponding patch (in the respective corner) and press the i1 measuring button once.

    Step 5: The Setup Wizard now continues with the next corner. Repeat step 4 for the lower left corner and then for the lower right corner.

    Information: If you need to correct corners click on Delete Corner Points.

    Step 6: After defining the corners begin measuring with Start.

    Step 7: When the measurement is complete, click on the Transfer icon to open the Transfer measurement dialog. Here the measurement data can be discarded or transferred to ColorAnt.

    If several measurement conditions have been used, the results/measured values of the individual conditions can be selected and viewed in the drop-down menu next to the Transfer icon.

    Multipage Test Charts

    Step 1: When measuring multilateral test charts, the Setup Wizard reopens after measuring the first page.

    Step 2: Put the next page on the iO table and make sure that the right chart image is selected. Define the Chart Corners again and start the measuring process by clicking on Start.

    Step 3: Repeat these steps until all pages are measured.

    Step 4: After measuring all pages of the test chart save the data for further processing.

    X-Rite i1iSis 2/XL

    Measuring with the X-Rite i1iSis 2/XL

    Step 1: Select the i1iSis measuring device from the Selection drop down list in the Device tab.

    Step 2: Click on Connect. Once the device is connected, the Setup Wizard opens:

    Measurement Options

    Measurement condition: M0, M1, M2.

    Scan Options

    Page: Automatically calculates the number of pages. Shows the current page.

    Rows per page: Define the number of lines on your chart. If the chart contains several pages, define the number of lines of the first page.

    Patch width / height: Define the size of a patch in mm.

    Status Info

    Indicates the current stage of the measurement process.

    Measure

    Step 1: After connecting the device the Setup Wizard opens.

    Step 2: Define the settings and click Start.

    Step 3: The i1iSis will move to it’s startposition. Insert the chart and wait until the measurement process is completed.

    Step 4: Once the measuring is complete the data will be displayed in the Measure Tool. Select either Transfer and Quit to send the data to the Data Sets section and close the Measure Tool or continue with further measurements.

    ColorAnt allows the transmission of individual measurement conditions or all available measurement conditions. In the latter case, several data sets are transmitted. For easy differentiation, the measurement condition is appended to the file name for each data set.

    ColorAnt | Quick Start Guide

    Quick Start Guide

    Get started with ColorAnt

    Quick Start Guide

    Introduction

    Thank you for choosing ColorLogic’s ColorAnt. Reaching higher quality in production environments has never been easier.

    ColorAnt, the ultimate color management solution
    ColorAnt is the ultimate color management tool to manipulate, analyze and optimize measurement data including RGB, CMYK and Multicolor.

    Use ColorAnt to create special measurement charts, measure color patches, and to check measurement data prior to profiling to avoid issues such as mis-measurements or inhomogeneous data. ColorAnt can be used to average several measurements together when required before creating a profile.

    The quality of ICC profiles depends strongly on the quality of the measurement data used to create them. By adding analysis and optimization of measurement data, profile quality will improve which also leads to higher production safety.

    ColorAnt’s Online Help
    The question mark ? (bottom right in all program windows) opens the Online Help. This is context-sensitive, so if you click ? in the Redundancies tool, the Redundancies online help page opens. The online help contains more detailed information about the various functions of this application.

    Automatic Updates
    ColorAnt can automatically search for new versions of the application at program start. Activate or deactivate the automatic update check under Help > Check for Update.

    Enjoy analyzing and optimizing your measurement data!

    Your ColorLogic Team

    Click here to download a PDF version of the Quick Start Guide.

    01 INSTALLATION

    System Requirements

    macOS®

    • macOS® 10.15 Catalina
    • macOS® or macOS® Server Version 10.9 and higher

    Windows®

    • Microsoft® Windows® 10
    • Microsoft® Windows® XP SP3 and higher

    Recommended Hardware

    • Minimum Dual Core Processor (Quad Core or more recommended)
    • Minimum 2 GB RAM (4 GB or more recommended)
    • Minimum 1024 × 768 resolution (1280 × 1024 or higher recommended)

    Specifics

    • macOSColorAnt, Measure Tool, CoPrA and ZePrA are running in 64 Bit mode
    • WindowsColorAnt, CoPrA and ZePrA are running in 64 Bit mode, the Measure Tool is running in 32 Bit mode
    Installation

    Installers for the respective platform install the application by default either in the folder Applications  (macOS) or Programs (Windows). Begin installation by double clicking on the installation package.

    After accepting the Software License Agreement, select the destination volume and choose between a Standard Installation or a Custom Installation. Standard Installation installs all components (e.g. the Measure Tool in CoPrA or the DLS-Manager as described below).

    ColorAnt: The integration of ColorAnt (or ColorAnt’s Measure Tool with CoPrA Basic) allows to measure test charts for profile creation from within CoPrA.

    DLS-Manager: Allows installation of DeviceLink Sets. DeviceLink sets are standard DeviceLinks that will perform a variety of standard color management tasks. A complete list of sets and profiles can be found in the online help.


    Product Package

    What’s included:

    • CoPrA software
    • Additional software: Profile Manager (integrated into CoPrA) and ColorAnt or ColorAnt’s Measure Tool
    • ColorAnt M is included in CoPrA M to XL.
    • CoPrA XXL includes ColorAnt L
    • CoPrA Basic includes ColorAnt’s Measure Tool.
    • USB stick (dongle) or computer based license
    • Editable test charts to use with the DeviceLink tool Editing (in the folder EditTargets after installation)
    • Test charts and reference files including Multicolor charts for creating printer profiles 
(in the folder Testcharts after installation)
    • Printed Quick Start Guide
    • Access to Online Help

    Note:

    The folder EditTargets can be found under:
    Windows: C:\Program Files (x86)\CoPrA5\EditTargets
    macOS: Applications\CoPrA5\EditTargets

    The folders Testcharts can be found under:
    Windows: C:\Program Files (x86)\CoPrA5\Testcharts
    macOS: Applications\CoPrA5\Testcharts

    These folders can also be accessed by using the entries Open EditTargets folder and Open Testchart folder in the menu Tools.

    The context sensitive Online Help opens up in a web browser after clicking the question mark icon of the respective program window, the F1 key or using the Help menu entry Online Help. An active internet connection is required.

    Activation

    Installing a Permanent License

    A permanent license will be provided by your dealer after purchasing the application. Permanent licenses are available as computer-based or dongle licenses.

    Computer-based licenses are always tied to the computer on which the software (CoPrA, ZePrA or ColorAnt) is installed. This is useful for temporary test purposes. Computer-based licenses are also required if the computer lacks an USB port or space for an USB dongle, i.e. a rack server.

    USB dongle licenses are serialized to the dongle. The USB dongle communicates with the appropriate software license and enables the software to be used on different computers. To assign the license to the USB dongle, it must be connected to the computer before starting the software.

    After purchasing the software, a permanent license file (*.lic) will be sent via email.


    Activating a License

    Load the license file in the tab License details under Registration to activate the application.

    After installing the permanent license file, the licensed modules are displayed under License details.


    Using One License File on Multi-User Systems

    macOS

    Copy the license files of ColorLogic applications into the following folder:

    /Users/Shared/ColorLogic/LicenseInstall.

    • Create the folder if it does not exist.
    • Check the folder permissions.
    • When the application is launched, it will check the specified folder by default.

    Windows

    Copy the license files of ColorLogic applications into the following folder: C:\Users\Public\Documents\ColorLogic\LicenseInstall.

    • Create the folder if it does not exist.
    • Check the folder permission.
    • When the application is launched, it will check the specified folder by default.

    License Details

    License status: The expiry date for time limited versions of the software (for example, NFR or demo licenses) is shown at the bottom right of the software window. No expiry date is displayed for full versions.

    Available Features: Shows the activated modules and add-ons.

    Complete instructions on how to download and install ColorLogic applications and how to request and activate a demo license can be found here.

    ColorAnt - Available Packages

    02 MAIN WINDOW

    Sidebar

    ColorAnt’s Sidebar allows quick access to all tools from a central, easy-to-use location.

    Automatic Correction

    Auto
    Correct measurement data automatically


    Data Import/Export

    Custom Chart
    Create custom test charts

    Export Chart
    Export custom charts for printing and measuring

    Measure
    Measure printed charts or ambient light

    Report
    Create detailed reports on measurement data

    Embed CxF/X-4
    Embed CxF/X-4 spectral data in PDF files


    Editing

    Redundancies
    Correct redundant patches in measurement data

    Correction
    Corrects and detects faulty measurements and inconsistent data

    Smoothing
    Smooth and correct uneven curves

    White/Black Correction
    Apply manual corrections to white and black areas

    Brightener
    Correct data for optical brighteners

    Tone Value
    Correct measurement data to a specific set of curves

    Rescale
    Recalculate data to a different color chart

    Edit Primaries
    Add, remove, or exchange primaries and recalculate measurement data

    Color Editor
    Edit colors to match a reference file

    Averaging
    Average several data sets into one data set

    Link
    Combine multiple charts into one measurement file

    ICC Transformation
    Use ICC device and DeviceLink profiles to test impact on data

    CIE Conversion
    Change the standard observer illumination of data sets


    Registration
    Activate ColorAnt and manage licences

    Preferences
    Preferences – Customize various ColorAnt settings

    Data Sets and History

    Data Sets
    Displays relevant information about the measurement data: Number of Patches, DCS (color model: Lab, CMYK, RGB, Multicolor) and measurement type CIE (colorimetric = Lab, spectral = Remission).

    History
    Shows the tools and corrections applied to the measurement data of each editing step and allows switching between different editing states of a file. By clicking on an entry in the History window (either above or below the current status) an individual processing step can be accessed and checked, for example, in the View window.

    Save History Log and Averaging Report
    Save History Log is available at the bottom right of the main dialog (Fig 2.3).  It saves all modifications applied to all files in a detailed PDF document. When double-clicking a single entry in the History section, a dialog pops up showing the settings applied to the data at a specific step. The single step can be saved with Save Log.

    Averaging Features
    The averaging log contains detailed reporting with sample colors (similar to the Report feature) comparing the averaged data and providing process control statistics. Standard deviations (sigma) for Density, dE and dH/dL. This allows users to easily recognize colors with large deviations which would not be obvious by visually confirming values.

    View and Compare Data
    Advanced viewing options for ColorAnt’s tools are located at the bottom of the main window enabling both the inspection of measurement data (View) and the pre- and post-comparison of measurement data (Compare).

    To view measurement data, select the data in the Data Sets area and open the View window. Five different options allow for a quick overview of all color patches in the measurement file: the 2D view shows the reference and the corresponding Lab values for each patch, 3D shows a rotating view of the color space, TVI displays the curves for each channel, Spider Web for a top down view, and Curves for various gradations and various curves of gradations.

    Color filters: Using the checkboxes, colors can be selectively displayed in 2D and 3D view. All other color patches are then hidden. This allows you to immediately find selected colors in the test chart layout of the 2D view.

    The 3D view displays the color body defined by the color filters. This way, the Full Primaries, Limits, Primaries, Secondaries, White or Black can be viewed separately. With Multicolor data, it is easy to recognize in which areas the additional colors extend the color body compared to CMY or CMYK.

    There are some dependencies between the color filters, so selecting a certain color filter may automatically activate another color filter (or even several others). For example, if the Secondaries checkbox is activated, the Primaries and White color filters are also automatically activated. They can be deactivated if only two color combinations (Secondaries) are to be highlighted.

    Color channels: By selecting color channels, either all color patches or only the color patches of the selected color channels can be displayed. Color channels can be combined with color filters so that, for example, only the Multicolor Primaries or Secondaries can be displayed. Duplex and triplex colors can be displayed by individual selection of suitable color channels (for example, Cyan + Black shows duplex colors and Cyan + Magenta + Black shows triplex colors).

    2D View
    Color filters highlight selected colors. View full primaries, limits, selected channels, primaries, secondaries, paper white or black. Individual color patches can be edited or deleted by selecting the patch and right-clicking to open a context menu.

    3D View
    Turn the color patches into the desired direction by clicking and dragging. By dragging the gamut, the color space is rotated in that direction. Increase or decrease the view by using the right side Zoom slider. Enlarge or minimize the color patches by using the Point Size slider.

    TVI
    Analyze Tone Value Increase curves (TVI). The tone value curve works in conjunction with the curve view or any other correction which will affect the TVI. Choose either Murray-Davies or ISO 20654 (SCTV) methods.

    Spider Web
    The Spider Web provides a top view of the color space in an a*-b* diagram. The measured or optimized color patches are arranged in a spider web configuration. Verify changes in the View dialog by moving forward or backward in the History list.

    Curves
    View the linearity curves from white to all 100% primary colors, (including multicolor data). Visualizes data and assists with analyzing non-smooth gradation curves. Choose from ColorLogic Default, ISO 20654 (SCTV) or Tone Value.

    03 USING COLORANT

    Automatic Correction

    The Auto feature optimizes measurement data by applying the following tools in the specified order:

    Redundancies: Clean up redundant color patches

    Correction: Correcting faulty measurement values

    Smoothing:  50% slider setting with no protection of highlights

    Each tool that is applied is displayed in the History section. ColorLogic recommends to create a Report for detailed results and further recommendations on your measurement data.

     Procedure

    1. Load measurement data by drag-and-drop onto the Data Sets area or via File > Open.
    2. Click Auto and then Start. The corrections applied to the data are displayed under History.
    3. Save the optimized measurement data as a new file via File > Save as. Use the optimized measurement data in profiling software such as ColorLogic’s CoPrA to create high quality ICC printer profiles.
    Measure

    Measurement data is acquired with the Measure Tool and transferred to ColorAnt. Measurement data files are stored in the folder Users/Documents/ColorAnt/MeasurementData. The Data Sets section of the main window displays pertinent information about the measurement data including: number of color patches, color model (Lab, CMYK, RGB, Multicolor), measurement value type (colorimetric = Lab – spectral = Remission).

    Sidebar tools will be highlighted when applicable to the measurement data, tools which are not applicable are grayed out. Use the tools by first highlighting the data (multiple files can be selected, e.g., by linking or merging several data sets together) and right click. When multiple data sets are present and no set is selected, corrections are applied to all measurement files.

    View and Compare Data

    View
    The View window provides plenty of features that facilitate the evaluation of measurement data. Filters allow the combining of individual channels. Combinations of 2, 3, 4, 5 or 6 channels, as well as one and two channels in combination with black, can be faded in and out. These filters are available in 2D and 3D view.

    The number of displayed color patches is shown on the left, i.e., if one or more filters are selected, the number of affected color patches as well as the total number of patches is shown on the left.

    Compare
    The Color Comparison window shows measurement data (Fig 3.2) before and after optimization. It can also be used to view the actions taken to optimize the data (e.g., File Name Correction, File Name Smoothing). Filters allow the combination of individual channels which are to be compared. 

    The Mark from and Mark to slider displays various levels of DeltaE deviations.

    Save or export measurement data
    The name of every tool applied to correct or optimize data is appended to the name of the data set (e.g., Data_smoothed_corrected). Save the optimized measurement data with File > Save As. Additional export options allow conversion of spectral data to Lab or Density only. Other Save As options include CGATS compatible TXT file, CGATS XML, Named Color ICC profile, CxF compatible CXF file format, Photoshop ACO, color table, Adobe ASE or as GMG CSC file.

    Generate Reports
    ColorLogic recommends using the Report tool both on the initial data import and after the measurement data has been optimized.

    04 DATA IMPORT & EXPORT

    Custom Chart

    The Custom Chart tool is designed to create reference files for test chart generation. A custom test chart for profiling requires a reference file containing the device data for the color space.

    Note: Creating multicolor charts requires a ColorAnt L license.

    Depending on the selection of color space, the Custom Chart dialog provides several options:

    Gray, RGB and CMYK: Define the Number of Patches and click OK. Select the desired Color Space from the drop-down menu.

    CMYK: Choose the linearization from another measurement data set or from another print run as a starting point. To use the linearization feature, load the appropriate measurement file in ColorAnt before opening the Custom Chart tool and select the file under Color Space.

    Multicolor Charts
    Modifying settings: Select the desired Color Space. For example, to create a 6 color profiling chart, ColorAnt will display a pre-defined color order, in this example: CMYK+Pantone Red and Green. The Eyedropper function allows reordering the channels. To exchange the 5th channel which is Red with Green (similar to fig 4.1) click on the Red Eyedropper Icon and from the Colors section select Green by clicking on it.

    Mode: Select one of the presets based on the purpose of the test chart: Profiling, Flexo Profiling, Profile Updating, Linearization or CxF/X-4 Wedge.

    Number of patches: Affects how precisely the device color space will be filled with color patches. Please consider the available space on your output, the required accuracy of the characterization data and the capabilities of your printer. Available choices are Large, Medium and Small test charts and a Custom option which allows entering a specific number of patches (the Custom option is not available for CxF/X-4).

    Note: The Custom Chart tool works even with only a few patches. The color space is covered in the best possible way to allow proper profile creation.

    Changing or defining the channel names
    To change channel names, click the Pencil icon, e.g., click the Green channel and type in the new name.

    Define the channel name of each channel, (including or excluding CMYK) enter the name in the text field or click on the Eyedropper icon and select a color from the pop up dialog that matches closest.

    Linearization
    ColorAnt provides intelligent settings that provide a starting point for typical use cases to create Linearization test charts, Profiling test charts, special profiling test charts for Flexo printing and Profile Updating. The Number of Patches feature chooses the optimal number of patches for specific profiling situations.

    Note: This option is useful for difficult print processes that are challenging to profile. ColorAnt uses a very smooth linearization to avoid inconsistencies in the curves.

    Once the color space, channel names and the Number of Patches are defined, click OK and calculate the reference file. The reference file will appear in the Data Sets section. Save the file if necessary for other chart generation tools. To create a test chart within ColorAnt, select the reference file and click Export Chart.

    Export Chart

    Export Chart creates test charts based on device color values (e.g., RGB, CMYK, 7 Color etc.), which can be stored as PDF, TIFF or PSD files.

    At the top a Preset covering all settings can be selected and manual presets can be created, saved or deleted. The largest section covers options for Chart Dimensions, Patch Sizes and additional Options. The section on the bottom provides information on the number of files to be created with the chosen Preset, settings and buttons to Cancel or create (Start) the test charts. The tool is optimized to work with most of the instruments supported in the Measure Tool. The Custom Chart tool fills the full chart width with patches minus margins for the numbering. Instruments that do not have width limitation (no ruler required) can benefit from this feature.

    Ink Limit takes into account printing processes that can’t handle 400% ink on paper/substrate. Typically each of ColorLogic’s CMYK and multicolor test charts have patches with a maximum of 400% ink. If a 400% ink limit is too high for the press, or the user would like to define another ink limit, the user can enter the desired Ink Limit. The resulting chart will have ink limit integrated. Use the exported reference file for measuring and profiling.

    Procedure

    Step one: Select the reference file with the required device color values.

    Step two: Use either one of the presets, or define a custom size and patch width.

    Step three: Define the number of patches to be produced.

    Measure

    ColorAnt’s Measure Tool is used to measure test charts for profile creation.

    Measuring test charts

    1. Select Measure from the sidebar.
    2. Select the measurement device under Selection and the measuring mode (M0, M1, M2 or M3).
    3. Connect your device and open the test chart. Charts can be opened via the File menu via the Recently used files and Predefined Charts entries. Your own charts can be added to the list by placing them in the ColorAnt Wedges folder (User\Documents\ColorAnt\Wedges). Alternatively, simply load a reference file or drag-and-drop it onto the window.
    4. Select the Direction of scanning: Patches – Line by line, Patches – Column by column, Scan Rows or Scan Columns.
    5. Begin measuring: Follow the instructions of your measurement device. For the virtual device, double click the first patch to start the measurement.
    6. Transmit Data: When measuring is completed, click the Transmit icon to transfer the data into ColorAnt’s Data Sets section.
    Report

    A Report offers detailed information for measurement data analysis and provides recommendations for measurement data corrections. It can be used to verify and graphically display the data, and is therefore a powerful feature to document which types of corrections are necessary for the measurement data.

    The various report pages provide an insight into the Tonal Value Increase Curves, the gamut representation (Spider Web) as well as the results of the test on the matching of redundant color patches (Quality Evaluation section), measurement or printing errors and the smoothness of the measurement file.

    Embed CxF/X-4

    Allows to embed spectral measurement data of spot colors (compliant with CxF/X-4) in a PDF file so that other CxF/X-4 compatible tools (e.g., ZePrA) are able to extract or use this data.

    Procedure

    Open the PDF/X file. The tool lists all spot colors of the PDF file, checks for spot color names that fit those of the CxF/X-4 measurement data and warns in case of conflicts. The data will only be embedded if the spot color names of the PDF file fit those of the CxF/X-4 file (Fig 4.5). When the spot colors match up, click on Start.

    05 EDITING

    Editing

    Redundancies
    Corrects color patches by averaging the redundant patches and replacing with the same value.

    Correction
    Detects faulty measurements or inconsistent measured values and replaces the data with expected measurement values. Use the Protect Lights feature to exempt Flexo data bumps. 
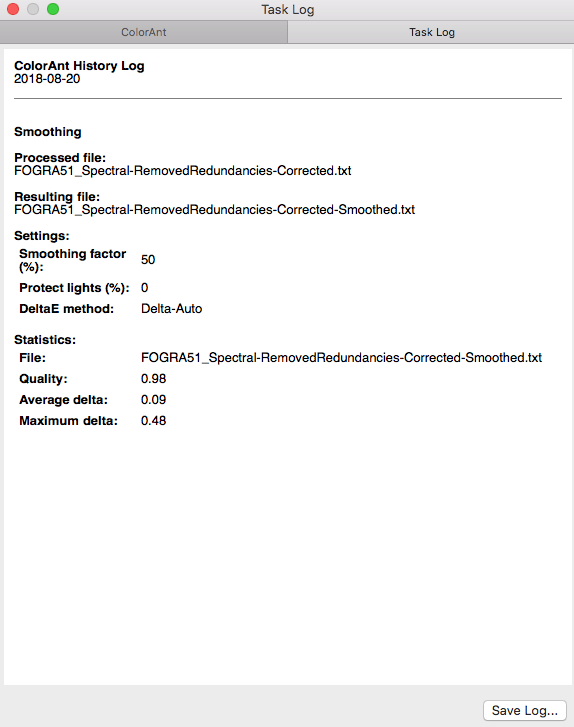
    Smoothing
    Corrects inhomogeneous measurement data and non-smooth curves by interpolating existing smoothed data. The Auto correction uses the maximum slider setting. Use the Protect Lights feature to exempt Flexo data bumps for being unintentionally smoothed.

    White/Black Correction
    Apply manual corrections to the most white and darkest color patches, typically the paper or other substrates. The White/Black Correction tool is designed to be used only on a single measurement file.

    Brightener
    Step one: Analysis
    Brightener corrects and analyzes the remission curve of the paper white to determine whether the paper contains optical brighteners or is merely a blue-colored paper.
    Step two: Correction
    Correction will be applied when optical brightener has been detected. The correction can be adjusted via a slider control and at 100% setting, a similar result will be achieved as if the paper were measured with a UV cut filter.

    Tone Value
    Corrects measurement data to a specific set of curves. Data is corrected according to specific conditions (e.g., G7, ISO 20654 SCTV). The Protect Lights slider can be adjusted to protect the highlights of flexo data. Correction curves can be exported as Photoshop gradation curves (ACV) and as XML according to ISO 18620 to be used in either Adobe Photoshop or any external RIP software that supports the ISO 18620 standard.

    Three options are available:

    Correction according to a given profile:
    Specify a profile and the measured values are adjusted to achieve the same tone value increase curves as those of the selected profile.

    Correction according to:
    Tone value curves are calculated to match the requirements of G7 Gray Balance, ISO 20654 (SCTV), G7 + ISO 20654 (SCTV) or ISO 20654 (MultiColor).

    Correction according to TVI targets:
    Manual editing of each channel (Fig 5.1) allows predefining the increases in tone value to be incorporated in the measurement data

    Rescale
    ColorAnt can calculate a large test chart based on several measurement files from small test charts. In some printing processes, (e.g., flexo printing on uneven materials) it can be challenging to achieve artifact-free printing of a large test chart. An effective approach to measuring large charts is to place several small test strips on a single page, measure, average and scale up the test strips to a large ECI2002 test chart using the Rescale tool.
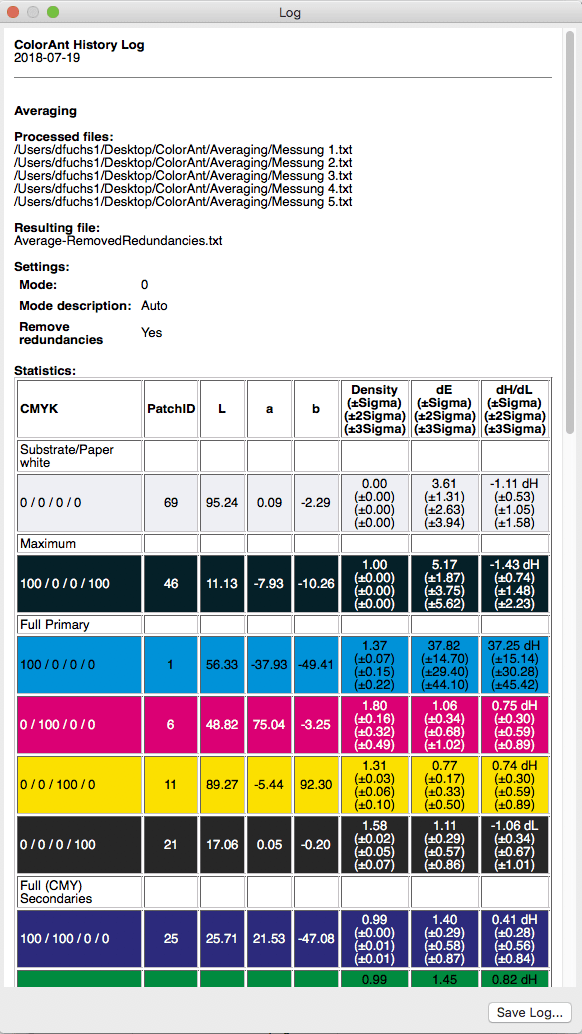
     Averaging
    Average several measurement files (e.g., press runs) of the same test chart and combine them to form a data set.

     Link
    Combine multiple data sets into a single large data set. We recommend to verify the obtained data using the View tool and to optimize the data with either the Auto function or the Redundancies tool.
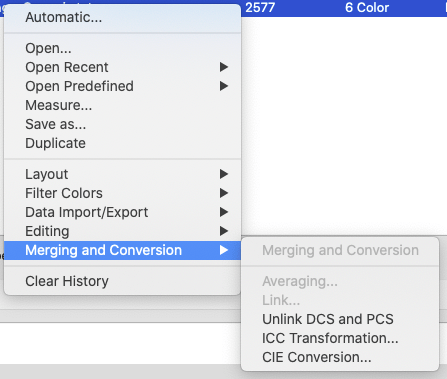
    ICC Transformation
    Use both ICC device and DeviceLink profiles on reference data (device data such as CMYK or RGB) to test the impact of an ICC color conversion with up to three profiles.

    CIE Conversion
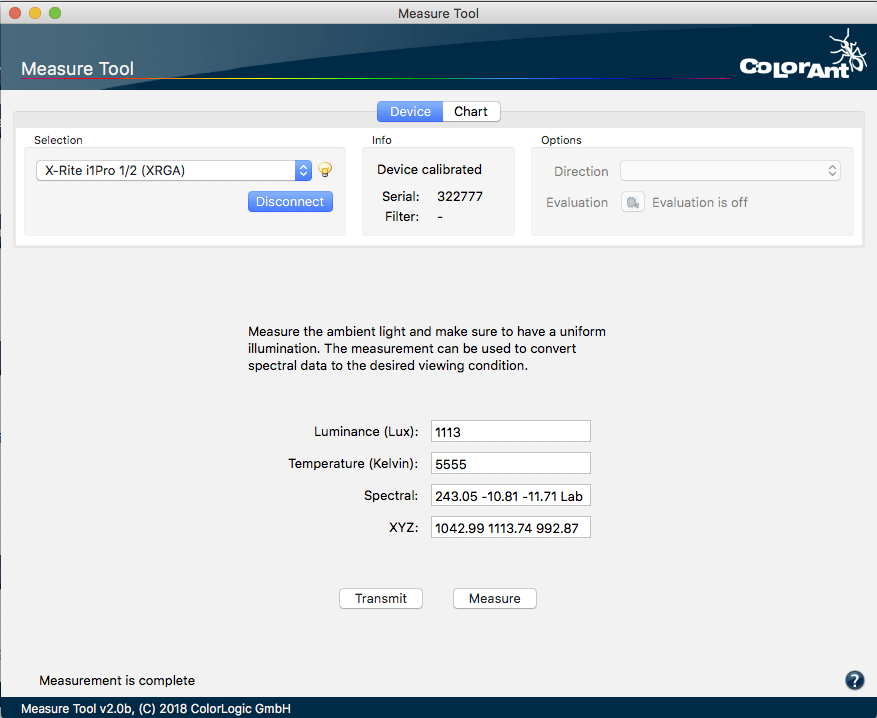
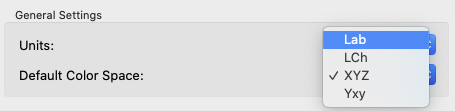
    Convert spectral measurement data into another viewing condition. The spectral data are converted to Lab during CIE conversion with the set illumination and the selected observer.

    Edit Primaries
    Add, remove, and exchange primaries or the paper/substrate in existing measurement data (Fig 5.2).

    In typical print production, adding or swapping ink(s) requires the expense of printing a complete, full size test chart. The Edit Primaries tool simply requires the spectral data of the new ink(s) to be added or exchanged. It also recalculates all overprints based on intelligent spectral color models. One of the major features is its ability to dynamically choose the best patches from the data provided. The more complete the provided data, the more accurate the results. This improves the exchange of gradations of the primary color and overprint information, e.g., the primary combined with black. If the selected data contains overprints, such as secondary colors, the Adapt Secondaries feature will take the additional data into account. 

    Scenarios for potential efficiency gain with the Edit Primaries tool in production:

    Modify channel names: Reorder channel names without modifying data

    Variance in press condition: The characterization press run is slightly deficient in solid ink density or hue on one or more colors.

    Exchange of paper/substrate: The inks are the same but a slightly different paper shall be used.

    Exchanging inks in a print packaging production environment: Create a new profile that swaps colors, e.g., Blue for Cyan or Rhodamine Red for Magenta.

    Adjusting the print sequence: Allows improved overprint calculations.

    Flexibility for the packaging manufacturer: Create different color variants from a full size 7 color press characterization data set by deleting channels to building new characterization data sets without printing a new test chart. For example, from an original 7C data set (e.g., CMYK+Orange+Green+Violet) build variants for CMYK only, CMY+Violet, CMYK+Orange+Green or other combinations. The production facility would need to ensure the press is stable, and depending on the color needs of the job(s), print select the profile with the least amount of channels.

    Increasing CMYK gamut: Adding a 5th, 6th or 7th color to the CMYK printing process.

    Using Edit Primaries
    We suggest loading another data set with the measured new primaries, gradations of the primaries and overprint information. Select the measurement data of a test chart measurement file for editing and click Edit Primary.

    Exchanging a primary: Click on the Eyedropper icon of the color to be exchanged. Select the new primary from another data set loaded in ColorAnt. Click on the channel to be imported to the primary. Fig 5.2 shows a new Cyan ink that is slightly different. Selecting ink from other channels is also possible. Click OK and the data set will be modified.

    Important: Using Lab values will not produce the highest quality results. ColorLogic recommends using spectral data. When a data set is present, enter a new Lab value for the selected color or select another channel from the same measurement data set to change the printing order.

    Verify the exchange of primaries with the Compare tool.

    Exchange paper/substrate
    Load the test chart measurement data and load the secondary file containing information of the measured paper white into ColorAnt.

    Select the measurement data of a test chart for editing and click Edit Primaries.

    Click on the Eyedropper icon of the Substrate/Paper white and select the new paper white from another data set loaded in ColorAnt (Fig 5.3). Click on the name of the data set to import the data. The second option is to manually enter the new Lab values in the text field.

    Click OK and the data set will be modified. For large differences in substrates, use the White/Black correction tool.

     Adding channels

    1. Load the test chart measurement data and load the secondary information with the measured primaries, gradation and overprint information into ColorAnt.
    2. Select the measurement data you would like to edit and click Edit Primaries.
    3. Click on Add Channel. A new channel with default gray Lab values and the channel name Auto is added.
    4. Click on the Eyedropper icon of the new channel and select the new primary from another data set loaded in ColorAnt. Click on the channel to import the data. Fig 5.4 shows an example where a 5th Orange color has been added to an original CMYK data set. To rename the channel click on the Pencil icon and enter the new channel name. The new channel can be linearized according to the ISO 20654 (SCTV) standard by selecting the checkbox.
    5. Click OK to generate the new data set. To view the new data set, use the View tool and select the tabs 2D, 3D, Spider Web and TVI to verify all colors including overprints have been added. Additional edits can be made to the curves using the Tone Value tool.

    Removing channels
    Load the measurement data of a test chart and click Edit Primary. Disable the check boxes in front of the channels that need to be deleted and click OK.The new data set will be reduced to the selected channels.

    Color Editor
    Edit color patches and process color conversions of spot colors. 

    Procedure
    The Color Editor allows the user to edit patch names (Fig 5.5), Lab values or device color values (DCS).

    Convert and optimize a complete spot color library to a target profile for RGB, CMYK or Multicolor.

    To convert spot colors to a desired target profile, first load the spot colors into the ColorAnt Data Sets section, e.g., a Pantone spot color library (or any supported file format such as CxF), then click on Color Editor.

    The window contains a table on the left showing all spot colors of the file and editing options on the right.

    Select an ICC Profile from the drop-down list and a calculation Mode.

    Six modes are available:

    1. Precise Match – Proofing
    2. Visual Match – Utilize More Channels
    3. Use the Least Amount of Channels
    4. Use one Output Channel only
    5. Use a Maximum of two Channels
    6. Use a Maximum of three Channels

    The preset dE Limit highlights colors that exceed the defined threshold.

    If a color is selected from the table, the device color values for each channel of the selected profile are shown under Optimize Destination Values.

    As a default, the device values calculated via the ICC profile are shown without any optimization. By clicking on dE76 or dE00 the deltaE can be minimized (Fig 5.6) for each color.

    Clicking on Automatic applies the selected calculation Mode which typically results in a reduced amount of channels for better printability.

    Users can optimize each individual color and can even enter device values manually. By clicking on Start, the entire list of colors is generated in the Data Sets section including the calculated and possibly optimized device color values.

    The values can be saved for further usage in other applications in any format supported by ColorAnt (CGATS TXT and XML, CXF3, Photoshop ASE and ACO, named color ICC profile or GMG CSC).

    ColorAnt | Registration

    Registration

    Activate your license or request a demo license

    Registration

    Activation


    Installing a Permanent License

    A permanent license will be provided by your dealer after purchasing the application. Permanent licenses are available as computer-based or dongle licenses.

    Computer-based licenses are always tied to the computer on which the software (CoPrA, ZePrA or ColorAnt) is installed. This is useful for temporary test purposes. Computer-based licenses are also required if the computer lacks an USB port or space for an USB dongle, i.e. a rack server.

    USB dongle licenses are serialized to the dongle. The USB dongle communicates with the appropriate software license and enables the software to be used on different computers. To assign the license to the USB dongle, it must be connected to the computer before starting the software.

    After purchasing the software, a permanent license file (*.lic) will be sent via email.


    Activating a License

    Load the license file in the tab License details under Registration to activate the application.

    After installing the permanent license file, the licensed modules are displayed under License details.


    Using One License File on Multi-User Systems

    macOS

    Copy the license files of ColorLogic applications into the following folder:

    /Users/Shared/ColorLogic/LicenseInstall.

    • Create the folder if it does not exist.
    • Check the folder permissions.
    • When the application is launched, it will check the specified folder by default.

    Windows

    Copy the license files of ColorLogic applications into the following folder: C:\Users\Public\Documents\ColorLogic\LicenseInstall.

    • Create the folder if it does not exist.
    • Check the folder permission.
    • When the application is launched, it will check the specified folder by default.

    License Details

    License status: The expiry date for time limited versions of the software (for example, NFR or demo licenses) is shown at the bottom right of the software window. No expiry date is displayed for full versions.

    Available Features: Shows the activated modules and add-ons.

    Complete instructions on how to download and install ColorLogic applications and how to request and activate a demo license can be found here.

    Demo Licenses


    ColorLogic offers 14-day trial licenses for the applications CoPrA, ZePrA and ColorAnt allowing the user to evaluate the software features and performance.


    Restrictions with Demo Licenses

    All profiles created with a demo license in CoPrA can only be used correctly in ColorLogic applications.

    A ZePrA demo license gives users a 14-day evaluation period to try all the functions of ZePrA within the application. All files converted with a demo license in ZePrA are watermark protected. If it becomes necessary to test ZePrA within a workflow without the watermark during the test period, contact your dealer for instructions.


    Requesting a Demo License

    1. Click on Registration in the lower left corner of the sidebar.
    2. Click on the tab Demo license request.
    3. Enter all required information.
    4. After selecting the country, the software shows a list of available dealers in that region. Select a dealer and click on Send direct request. The relevant demo license will be send to the specified email address within a few minutes.
    5. Save the license file (*.lic) contained in the email on the computer being used.
    6. Load the license file in the tab License details under Registration to activate the respective application.

    The expiration date of demo licenses is shown under License details right after activation.

    FAQ


    Does the license file have to be saved on the USB dongle for USB dongle-based licenses?
    No, the license file does not have to be saved on the USB dongle. However, it is recommended if the application is to be used on several computers, as the required license file is then always available.

    Why does my software not work anymore?
    Please make sure that the USB dongle is plugged in and that the serial number of the license file matches the serial number under Registration.

    What is the correct order to start the application with USB dongle based licenses?
    First plug the USB dongle into your computer, then start the software and load the license under Registration.

    What if the application with a computer-based license is to be used on another computer (e.g. if the old computer is broken)?
    In this case, please contact the dealer from whom you purchased the software. He will provide you with a document (License Transfer Agreement) for you to sign, in which you agree to delete the old license file and not to use the software on the old computer anymore. You will then receive a new license file for the new computer.

    Important: If a computer-based license is to be used, the application must be installed on exactly the computer on which you want to work permanently. You should also make sure that no USB sticks etc. are present before you start the software and open the Registration dialog.

    Tip: If you send the serial number to the dealer, it is best to copy and paste the serial number from the Registration dialog (this is easier than writing it down or sending a screenshot). The permanent license file runs only and exclusively on this computer. If you have a computer-based license, you cannot use the software on another computer.

    Registering and Downloading ColorLogic Software

    ColorAnt | Preferences

    Preferences

    Define basic settings

    Preferences

    Use the ColorAnt Preferences to define the general behavior of the application.

    Display Density

    Defines the method for calculating and displaying densities in View and Report.

    Select whether the Relative or the Absolute density is to be displayed and which of the four methods is to be used for the calculation:

    • Status-E: The default setting for CMYK data, mainly used in Europe.
    • Status-T: Mainly used in America for CMYK data, with slightly lower yellow density values.
    • Status-A: Used in the photographic industry. Use it with RGB printing systems.
    • Maximum: For Multicolor/spot color measurement data. Automatically uses the maximum absorption of the spectral values to calculate the density instead of the specified CMY filters.

    Tone Value Calculation

    Changes the calculation and display of the TVI curves in the View dialog.

    The default setting in ColorAnt will calculate the TVI curves based on XYZ values. This mode ensures consistent views of TVI curves between measurement data and the same curves derived from ICC profiles. ICC profiles use colorimetric data. When spectral measurement data is present and the checkbox is disabled in Preferences, the TVI curves are based on density and the selected density mode is used for the calculation of the curves. This method is more consistent with the one used in print process control. Keep in mind that both the XYZ and the density method are not good indications for how TVI curves of spot colors actually look as these methods do not work well for non CMYK colors. Refer to the Curves View dialog instead to see curves according to colorimetric linearity or ISO 20654 (also known as SCTV).

    General Settings

    Units: Defines the measurement units used (mm or inches) in the Export Chart dialog.

    Default Color Space: Defines the color space for the 2D and 3D view of the View tool. Available color spaces are Lab, LCh, YXZ and Yxy.

    3D Gamut Axes Ratio (L:a:b): The default 3D gamut view uses an 1:1:1 axes ratio of the Lab axes (L:a:b). Alternatively, the axis ratio of 2:1:1 used in ColorAnt 8 and older can be selected.

    Automatically reorder known charts: Enables the automatic rearrangement of color patches of randomized test charts according to the known default layout (see screenshot), i.e., it can be specified whether the existing randomized layout should be kept when loading the chart or whether the color patches should be rearranged automatically.

    Note: The state of the checkbox can be switched by holding the Alt key when dragging and dropping files into ColorAnt.

    Left chart: With automatic reordering
    Right chart: Without automatic reordering
    Test chart: IT8.7-4

    Report Options 

    Default save path: Reports (in PDF, XML and XSD format) are automatically saved in the folder specified here.

    Default report format: Select the preferred file format for the report, either PDF or XML. If XML is selected as the format, the corresponding XSD files will be created automatically as well.

    Default DeltaE Method: Define the DeltaE method to be used in reports, either dE76 or dE2000.

    Open profile reports automatically with default viewer: Define whether the report should be automatically opened in the standard PDF viewer after creation.

    Report Customization

    The report Title and the report Logo for measurement data reports can be customized individually for all report types. Select the report type from the drop-down menu and set the desired Titel and Logo for each of the available reports.

    Remaining number of characters: Shows the number of remaining characters for the report title. The report title can contain a maximum of 50 characters.

    Supported image formats for the Logo are TIFF, JPEG or GIF in RGB color space.

    ColorAnt | Main Window

    Main Window

    Access all features of ColorAnt

    Main Window: Sidebar – Data Sets – History

    Overview

    ColorAnt’s main window is divided into 3 sections: The Sidebar, Data Sets and History.

    All tools are located and grouped by function on the left side in the Sidebar, measurement data is shown in the Data Sets section on the right-hand side upper window.

    Tools applied to the measurement data show are shown in the lower right hand side History window.

    Note: If no dataset is selected, the tools are applied to all opened datasets!

    All ICC profile drop-down menus function as search fields. Simply type in some letters of the desired profile name and only those profiles containing these letters will be shown in the drop-down menu.

    Working With ColorAnt

    Data Sets

    The Data Sets section displays relevant information about the measurement data: Number of Patches, DCS (color model: CMYK, RGB, Multicolor) and measurement type CIE (colorimetric = Lab, spectral = Remission).

    Open or import data

    Measurement data can either be opened (File > Open) or dragged and dropped into the Data Sets window.

    Note: If measurement data has been saved in an ICC profile (e.g., in profiles created by ColorLogic’s CoPrA), it can simply be dragged and dropped onto the Data Sets window. The measured values are then displayed. If the profile does not contain any measured values, an error message appears (Missing ICC Tag: Could not read color data from file).

    Extraction of original measurement data from an ICC profile: This functionality imports the original measurement data from ICC profiles. If you created or updated a profile with CoPrA using the Measurement Processing options Brightener Compensation and/or Measurement Correction, CoPrA stores two data sets inside the profile. The original measurement data (raw data) as well as the corrected data used for profiling (profiling data). ColorAnt extracts both data sets naming them accordingly when opened or when an ICC profile is dragged to the ColorAnt window.

    Predefined data and recently opened files are also available from the File menu.

    Measurement data can also be captured using the Measure Tool and transferred to ColorAnt. Measurement files created by Measure Tool are saved in the folder Username/Documents/ColorAnt/MeasurementData.

    The ICC specification allows ICC profiles with up to 15 channels. Consequently, ColorAnt allows loading and saving test chart measurement data with up to 15 channels. If data with more than 15 channels is to be loaded, a warning is displayed as such data cannot be processed.

    Note: This does not affect spot color data. It is still possible to load spot color measurement data containing thousands of colors.

    Workaround for profiles without measurement data

    If the measurement data of a profile is missing, you can use the ICC Transformation tool to create virtual measurement data:

    1. Open a reference file in ColorAnt with the color space of the profile
    2. Open the ICC Transformation tool
    3. Select the profile with the missing measurement data, the Checkbox Convert to Lab is enabled automatically
    4. Select Absolute colorimetric
    5. Click Start to convert the profile to Lab
    6. The profile data is opened under Data Sets in ColorAnt

    The quality of the generated measurement data depends on the accuracy of the profile.

    Opening combined CxF files

    A single CxF file can contain several data sets, e.g., Lab data, remission data, CMYK data or DCS values.

    When opening a CxF file that contains multiple measurement conditions, a prompt automatically appears inquiring which of the contained data sets is to be opened.

    Either select the desired data set or open All available data sets.

    Supported file formats

    The following file formats can be opened:
    CGATS text file (TXT) (including multiple tables)
    CGATS XML file (XML) (including multiple tables)
    Named ICC Profile (ICC)
    Color Exchange Format (CxF)
    Photoshop Palette (ACO)
    Adobe Swatch Exchange (ASE)
    GMG CSC file (CSC)
    Ink Master file format (MIF)

    The following file formats can be saved:
    CGATS text file (TXT)
    CGATS XML file (XML)
    Named ICC Profile (ICC)
    Color Exchange Format (CxF)
    Photoshop Palette (ACO)
    Adobe Swatch Exchange (ASE)
    GMG CSC file (CSC)

    History

    History: Shows the tools and corrections applied to the measurement data of each editing step and allows to switch between different editing states of a file. By clicking on an entry in the History window (either above or below the current status) an individual processing step can be accessed and checked, for example in the View window.

    Double-clicking on an entry in the History opens a window that displays the settings that were applied to the data in exactly this step. This information can be saved as a PDF document using Save Log.

    This has an additional advantage when averaging files using the Averaging tool. The averaging log contains a detailed report with sample colors that compares the averaged data with all files and provides useful statistics for process control, such as standard deviations (sigma, 2 sigma, 3 sigma) for Density, dE and dH/dL. This makes it easy to identify colors with large deviations.

    Save History Log: Saves all changes applied to all files to a PDF document.

    View, Compare and Evaluate

    Advanced viewing options for ColorAnt’s tools located at the bottom of the main window that can be enabled for both viewing measurement data (View) and pre and post comparison of measurement data (Compare).

    Evaluate can be used to check whether the proof measurement data from a media wedge fulfills the requirements for a contract proof according to ISO 12647-7 or a validation print according to ISO 12647-8.
    In addition, a PSD evaluation can be performed using two different evaluation methods: “Side-by-Side” or “Media Relative”. Finally, a fully detailed report can be created with a pass/fail indicator.

    Note: The Evaluate tool is available from ColorAnt L.

    At the bottom of the sidebar, you can access the Registration page, where you can load and manage your licenses. Absolute or Relative Density can be set in ColorAnt’s Preferences.

    Context Menu

    The context menu can be opened with a right-click on a selected measurement file or the Gear icon and thus enables quick access to all tools of the Sidebar and the functions from the File menu of the menu bar.

    Note: Depending on the selected file(s) only the relevant options are available via the context menu. Options that are not available are grayed out. A file has to be selected for the context menu to appear unless there is no file loaded, then the context menu appears when right-clicking in the empty Data Sets section, for example, to open files. 

    Workflow
    The Workflow feature enables automatic processing and optimization of measurement data. The application of various tools for data processing can be defined and adapted to the requirements of specific jobs, which means that measurement data can be automatically processed in a precisely specified manner.
    Detailed information can be found on the Workflow page.

    Open Recent: Opens a list of all recently opened files. Frequently used files (favorite files) can be added to this list as well, and can then conveniently be opened via the context menu.

    To make them accessible in the context menu, store them in the FavoriteFiles folder which can be opened via the ColorAnt File menu.

    All supported files of this folder are displayed at the top of the list of recent files, separated by a dashed line. As this list is shared by all ColorLogic applications, the files contained there are also available in CoPrA and ZePrA.

    Layout

    The Layout submenu contains options to rotate and mirror test charts and to change the overall layout.

    Layout: Allows you to change the width and height of the color patches. For example, the number of rows in a chart can be defined by Height and the number of columns by Width.

    Filter Colors

    Filter Primaries: Extracts the primary colors from a measurement file.

    Filter Full Tones: Extracts the full tones from a measurement file.

    Filter Corners: Extracts the corner points from a measurement file.

    Filter CxF/X-4 Data: Extracts all values corresponding to the CxF/X-4 specification (e.g., the gradients of the primaries on white and black) from a measurement file.

    Filter CxF/X-4 Data With Black Gradient: Extracts all values useful for CxF/X-4 including a black gradient from a measurement file.

    Data Import/Export

    Patches from Image: Creates an image-related test chart based on a loaded image by extracting the most common/important colors from that image. It can be accessed via the context menu or by dragging and dropping TIFF or JPEG files into ColorAnt’s main window. In the Patches from Image settings screen, select the number of desired patches for the test chart and whether the corner points should be added as well.

    Note: This function determines the best color set to accurately render an image (if these colors are accurately rendered, the entire image will be accurately rendered). This requires a compromise in color frequency, avoiding neighboring colors, avoiding large gaps and covering the gamut of the image.

    Separate Esko Test Charts: Extracts data out of a 7C data set to generate a 4×4 Equinox test chart (Equinox is a Multicolor profiling application from Esko that has special requirements for creating test charts for Multicolor profiling).

    Example: For a CMYKOGV data set, this function creates the following four data sets: 

    1. CMYK.txt, which contains the CMYK components
    2. OMYK.txt, which contains the OMYK components, but the first channel (Orange) must be named Cyan
    3. CGYK.txt, which contains the CGYK components, but the second channel (Green) must be named Magenta
    4. CMVK.txt, which contains the CMVK components, but the third channel (Violet) must be named Yellow

    Export Lab/XYZ/Density/CxF/X-4: Data can be exported in the following formats:
    Lab, XYZ, density in formats such as CGATS text files (txt) or Color Exchange Format (CxF3).
    For more information on this format, see the help on Export CxF/X-4.

    Delete: Removes the selected files from the Data Sets window. However, the files are not deleted from the hard disk.

    Save as combined CxF
    Combined CxF files may contain several measurement sets (e.g., spectral and Lab datasets) and can be generated directly in ColorAnt.
    This function is only available when several files are loaded in the Data Sets area. Select all files which are to be combined in a single CxF file, then select Data Import/Export > Save as combined CxF and then the CxF format.

    Note: A single dataset can be saved as a CxF file by using Save as.

    Editing

    Intersection: Compare measurement data containing a differing number of color patches and/or color channels. To use this function, choose the two measurement data sets in the main window and select Intersection from the context menu. Alternatively, click the button with the gear symbol to the right below the measurement data list.

    ColorAnt then scans both files for color patches with identical device values and removes all other values. This creates two new files containing identical device values which can be compared in the Compare window.

    Enumerate patches: Sometimes IDs of patches get mixed up, for example, when merging several files, resulting in different types of IDs.

    The Enumerate patches function creates new, consistent IDs for all patches.

    Merging and Conversion

    Unlink PCS and DCS: Separates the measurement data from reference data. (Splits files with reference and measurement data into two individual files).

    Clear History: Removes all entries in the History window.

    Sidebar

    Automatic Correction

    Auto 

    Correct measurement data automatically

    Workflow

    Customized automatic processing and optimization of measurement data

    Data Import/Export

    Custom Chart 

    Create custom reference files for test chart creation

    Export Chart

    Create printable test charts from custom reference files

    Measure

    Measuring printed test charts with the Measure Tool

    Report

    Detailed analysis of measurement data as PDF or XML file

    Embed CxF/X-4

    Embed spectral color information in PDF files

    Editing

    Redundancies

    Remove redundant color patches

    Correction

    Correct erroneous and inconsistent measurement data

    Smoothing

    Smooth and correct measurement data

    White/Black Correction 

    Adjust the black and white of measurement files

    Brightener

    Remove optical brightener from measurement data

    Tone Value

    Adjust dot gain curves

    Rescale

    Scale measurement files to create required test chart layouts

    Edit Primaries 

    Add, remove or exchange primaries and paper white in existing measurement data

    Color Editor

    Optimize color patches and (spot) colors

    Merging and Conversion

    Averaging

    Average measured values from multiple similar test chart prints

    Link

    Combine measurements from several test charts into a new measurement file

    ICC Transformation 

    Comparisons and profile tests with printer and DeviceLink profiles

    CIE Conversion

    Change the observer and illumination

    Menu Bar

    ColorAnt

     About: Calls the Registration. Contains information about the version and build number.
    Preferences: Adapt ColorAnt to your requirements. Define the display of density, the tone value calculation, report settings and general settings.

    File

    Under File you can open, save or export data in various formats.

    Save As: Saves files in the following formats:

    • CGATS text file (txt)
    • CGATS XML file (xml)
    • Named ICC profiles (icc)
    • Color Exchange Format (CxF)
    • Photoshop Palette (aco)
    • Adobe Swatch Exchange (ase)
    • GMG CSC file (csc)

    Special features of the formats:
    Named Color Profiles are special ICC profiles that are intended for spot color tables. They contain the CIE and DCS values in addition to the color name.
    ACO and ASE files can contain either CIE or DCS values. Therefore, when saving in one of the two formats, a message appears to select which data should be saved.
    CGATS files can contain different specifications in one file, e.g., measurements from different test charts or different color spaces. ColorAnt supports multiple tables in CGATS files. A typical use case would be the export of various Lab values of converted spot colors from the Spot Color Report feature in ZePrA and their import to ColorAnt for further inspection.

    Duplicate: Creates a copy of the selected file.

    Export Lab/XYZ/Density/CxF/X-4: Data can be exported in the following formats:

    As Lab, XYZ, density in formats such as CGATS text files (txt) or Color Exchange Format (CxF3).

    For more information on this format, see the help on Export CxF/X-4.

    Help

    Online Help
    ColorAnt’s Online Help Guide

    Quick Start Guide
    Access ColorAnt’s online Quick Start Guide

    Tutorials/Sample Data
    Link to the Tutorials website which contains a download link for Sample Data. With this data you can test or demonstrate the different tools of ColorAnt. You can download the sample data as an archive file (SampleData.zip).
    The package also includes a PDF document that explains all the examples and how to use the sample data.

    What’s new?
    View what’s new, includes new features and bug fixes in ColorAnt.

    Readme.txt
    Version notes for the current release

    ColorAnt CLI Documentation: ColorAnt provides a command line interface for integration into other workflows. The document ColorAntCLI.pdf provides an overview of the available commands and can be opened by clicking on ColorAnt CLI Documentation in the Help menu. It is intended for developers, scripters and experts and describes the usage of the command line interface of ColorAnt.
    Note: The CLI functionality is part of the ColorAnt XL package.

    Register
    Access the Registration information window

    Check for update
    The automatic update in ColorAnt checks for updates via an internet connection. Enable Automatic Update Checks may be disabled at any time which is recommended if an internet connection is not available. When disabled, it is still possible to manually update and download it directly from the dialog.

    Save Support Data
    If support issues arise, use the Save Support Data menu entry under Help to save support data and send it to a ColorLogic representative for assistance. This feature will gather the required information such as the operating system used, ColorAnt’s log file and the functions enabled when the issue occurred.