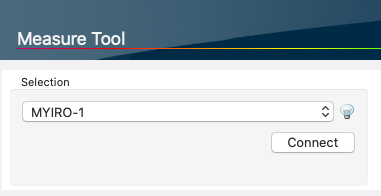
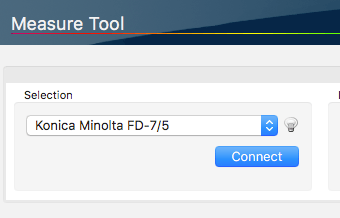
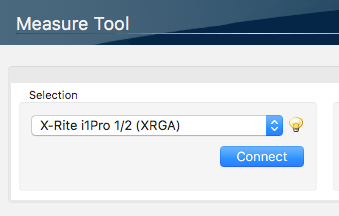
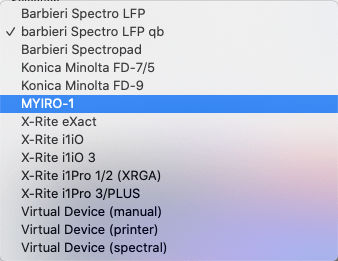
Selection
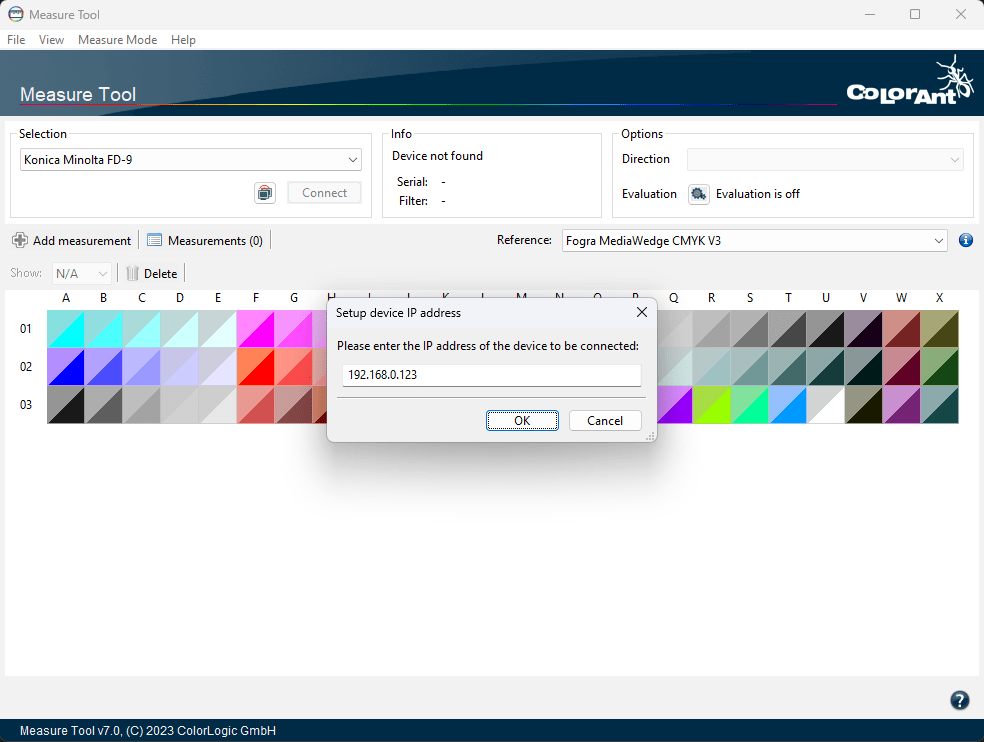
Select your device and connect it to the Measure Tool by clicking Connect.
Note: If a measuring device is not recognized or does not work properly, make sure that no other software or service is accessing the device in the background.
Other applications that support measurement devices may be connected to them by default. This is because the connection application (e.g., X-Rites i1Profiler Tray) is started by default at system startup and runs continuously in the background. So, when these applications are running, the Measure Tool may not be able to detect and connect to the measurement device. The solution is to launch the Activity Monitor (on macOS) or Task Manager (on Windows) and close the connection application (see screenshot).
In addition, devices must not have an existing Bluetooth connection, otherwise they will not be recognized and cannot be connected to the Measure Tool.

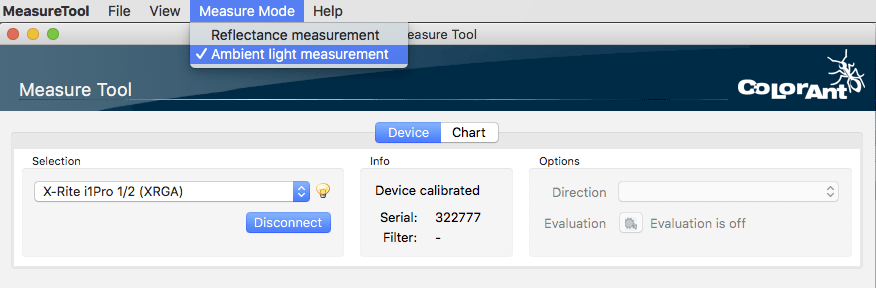
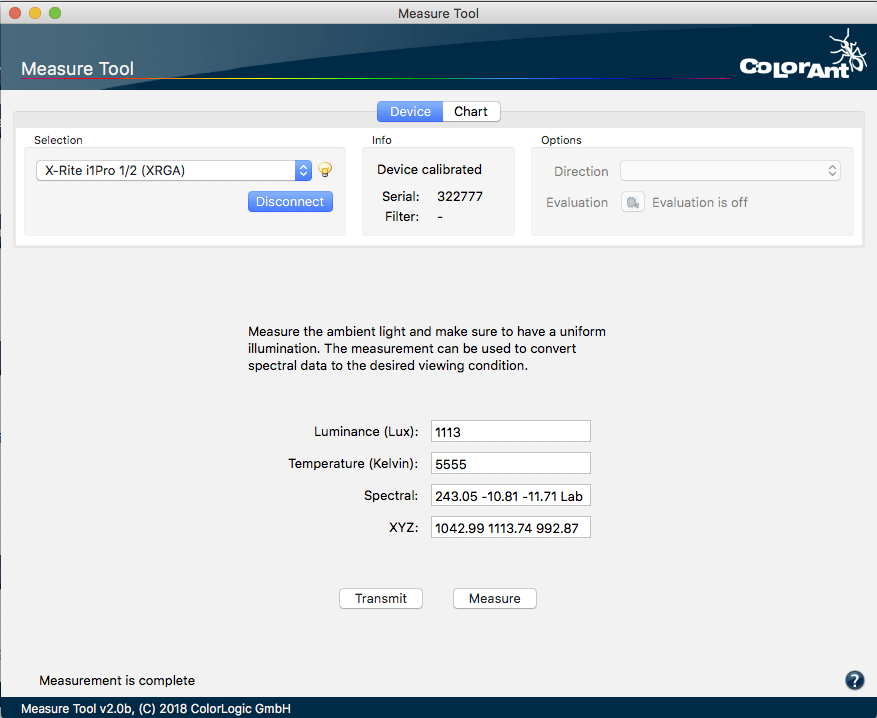
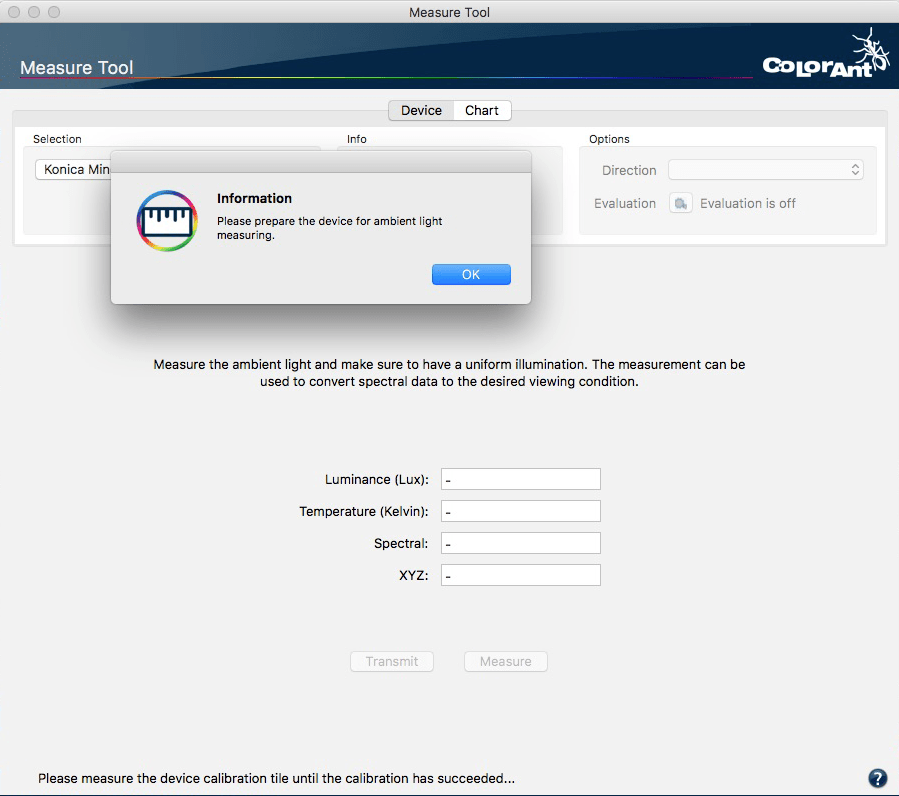
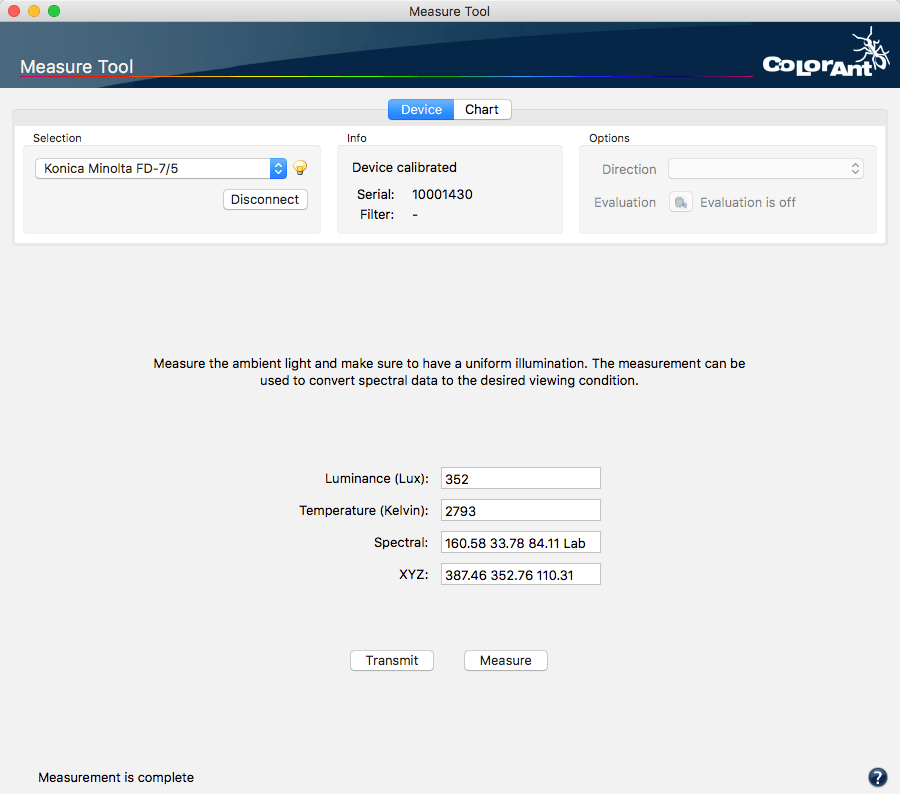
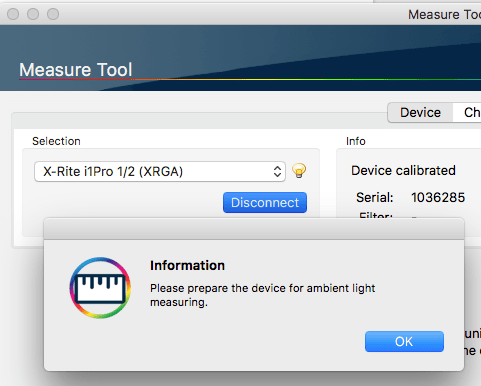
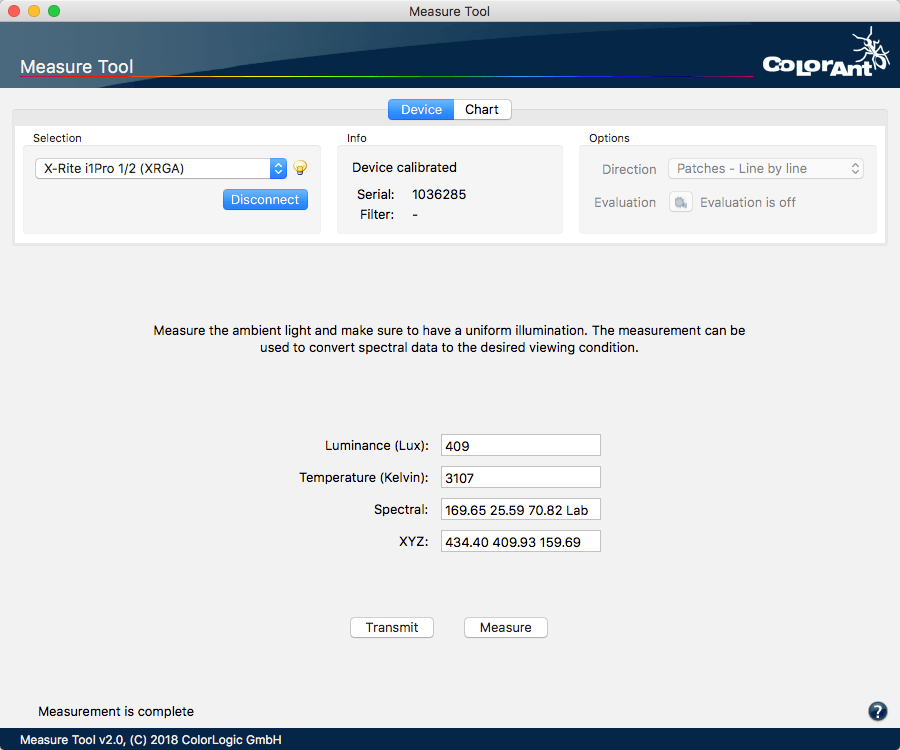
Light bulb icon: The Light bulb icon is shown when an instrument (such as the X-Rite i1Pro or the Konica Minolta FD-7) supports the Ambient Light Measurement mode. Clicking on this icon will switch between Ambient Light Measurement and the standard Reflectance Measurement. The mode can also be switched in the file menu Measure Mode. More information can be found in the chapter Ambient Light Measuring in Measure Tool below.
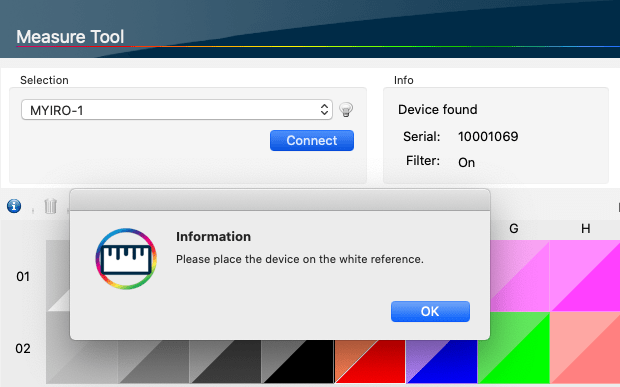
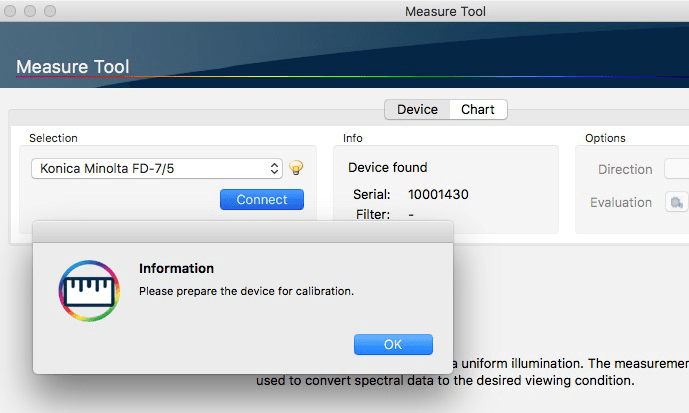
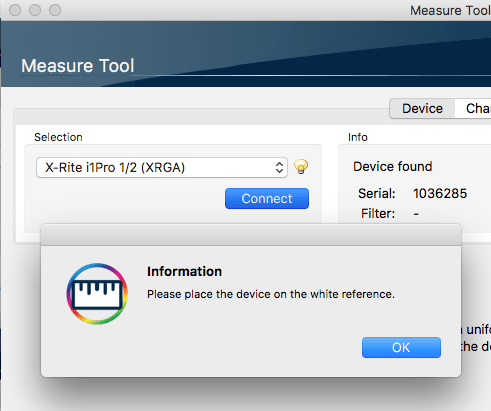
Info
Shows the current device information (if the selected device was found, version number and if the built-in filter is active).
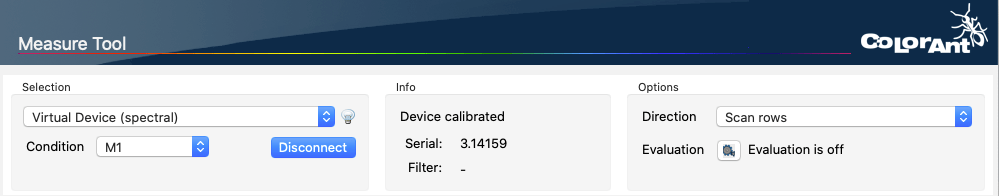
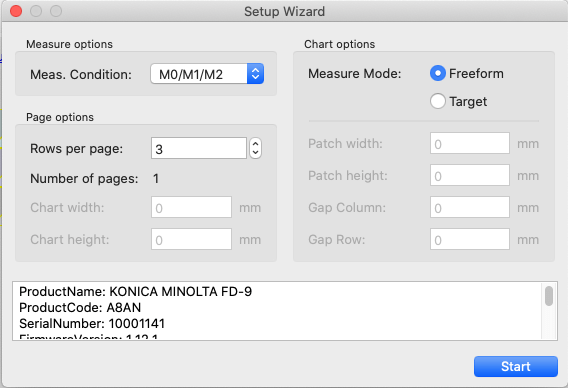
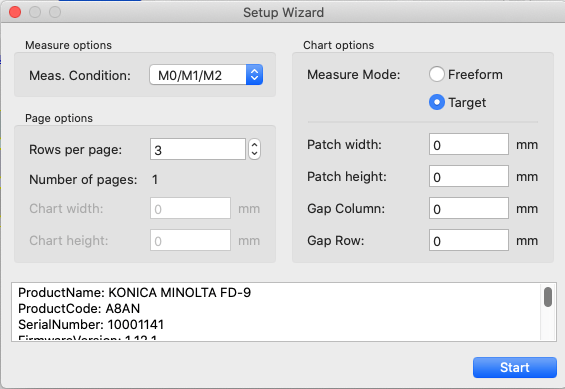
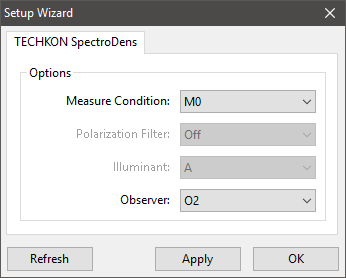
Options
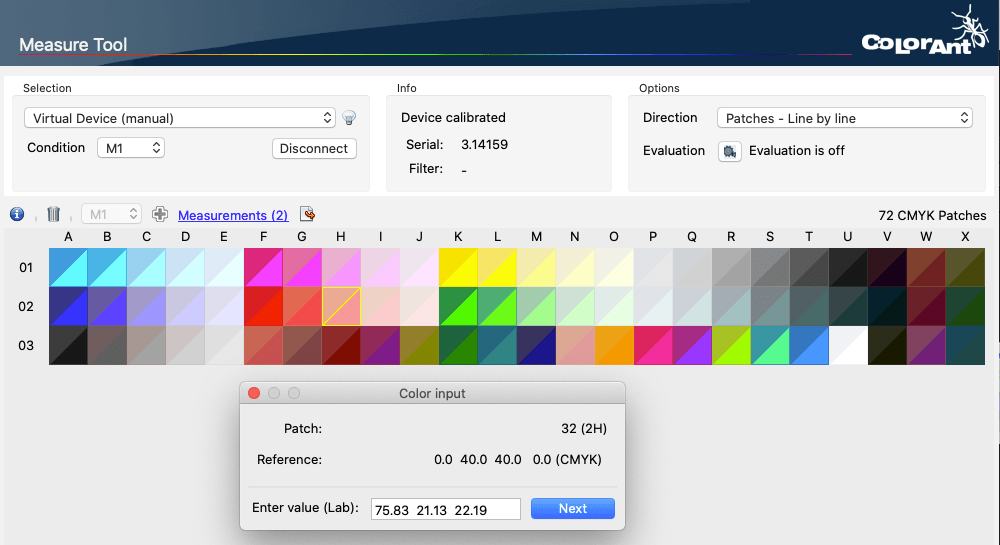
Direction: Specifies how the chart is measured. Depending on the selected device, single field measurements or strip measurements in horizontal or vertical direction are available.
Evaluation: Allows you to compare the measured data with a profile of your choice. Click on the Gear icon and select the comparison profile from the list of profiles available on the system. All patches with a DeltaE deviation higher than 20 are highlighted in red on the chart. By default, evaluation is disabled.
Note: The Evaluation can be deactivated by selecting the first entry Deactivated in the profile selection.
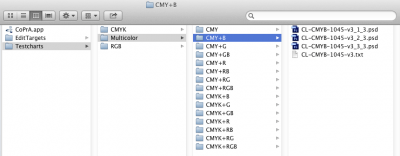
Opening charts
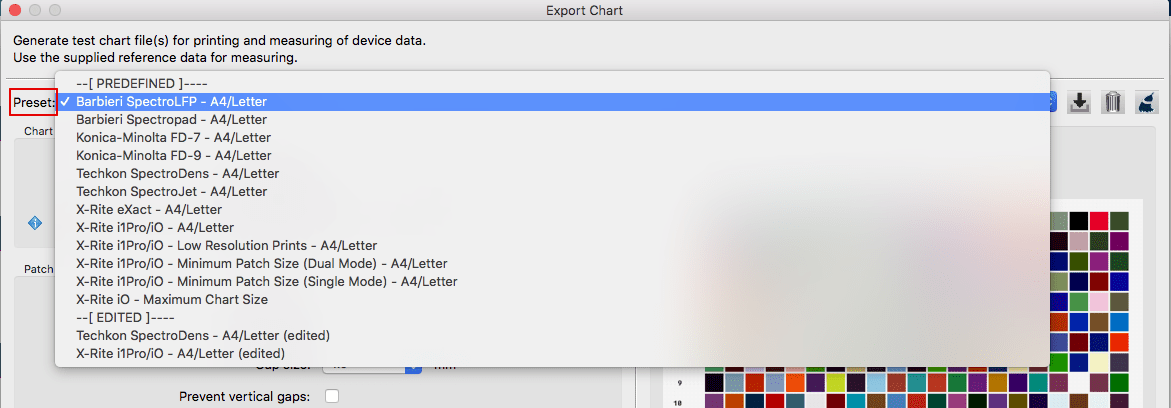
Charts can be opened via the File menu via the Recently used files and Predefined Charts entries. You can add your own charts to the list by placing them in the ColorAnt Wedges folder (User\Documents\ColorAnt\Wedges). The menu entry Open chart directory takes you directly to the Wedges folder.
Alternatively, simply load a reference file or drag it onto the window.
Note: The Measure Tool and ColorAnt can be used in parallel. Additional files can be sent from ColorAnt to the Measure Tool while it is running. These files are added to the Reference list.
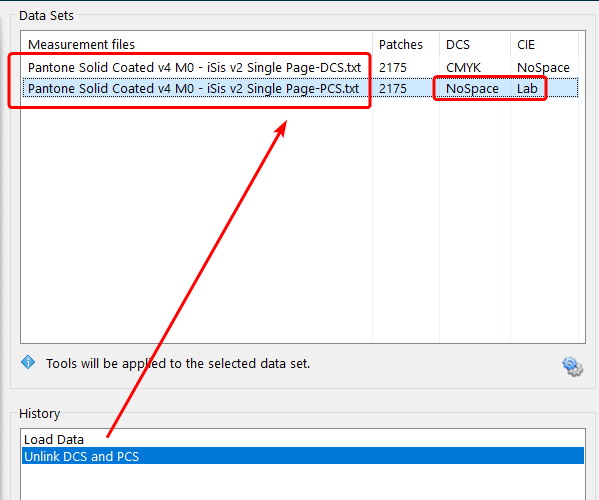
When measurement data is found in the loaded data, the user has the option to either use this data for remeasurement or to delete the measurement data and use the reference data for a new measurement.
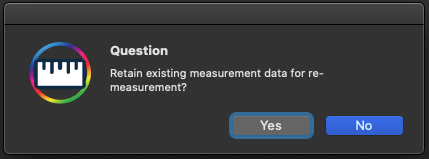
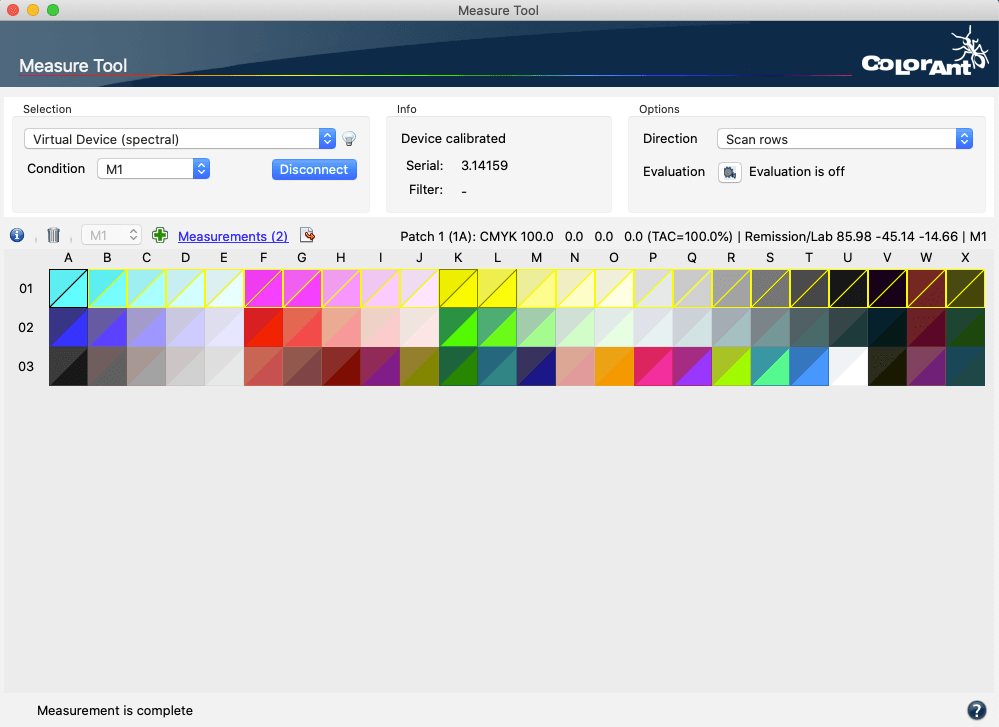
Chart display area
The chart display area shows the selected chart with row and column numbers.

The next patch or row to be measured is highlighted by a yellow frame. If Evaluation is turned on, measured patches with a high DeltaE variance are marked in red.
Show reference data (accessible under View in menu bar): Allows a split view of the patches. One half shows the reference color value, the other the measured color value.
Fit to width (accessible under View in menu bar): The chart expands to the width of the window. For larger charts, a scroll bar appears on the right.
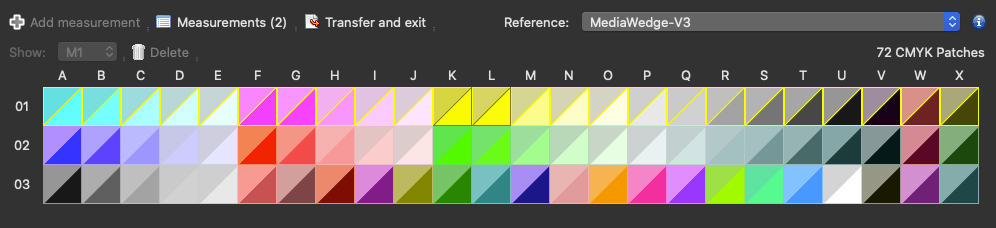
Add measurement: Manually adds completed measurements to the Measurements list. Usually, completed measurements are automatically added to the list. However, for re-measurements the data must be added manually to the Measurements list using the Add measurement button.
Measurements: Opens a list with all measurements of the current measuring session. The chart selected in the list is shown in the Measure Tool main window. More details about the Measurements window are available below.
Transfer and exit: Transfers all data to the Data Sets section in ColorAnt’s Main Window and closes the Measure Tool.
Reference: Lists all reference files added to the Measure Tool in the current session.
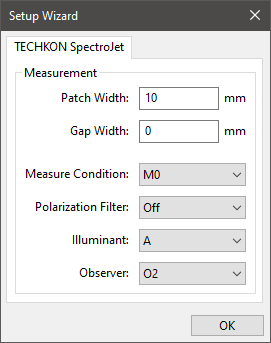
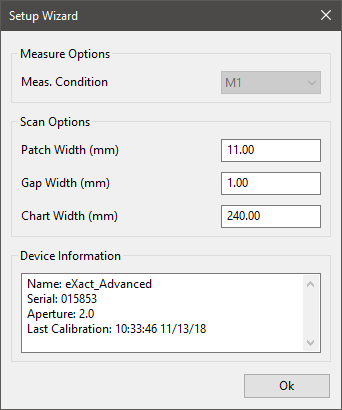
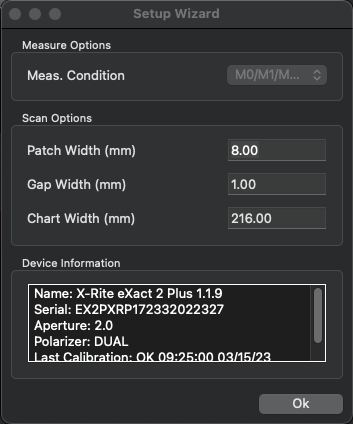
Info icon: Hover the mouse pointer over the icon to display information about the chart, such as the name of the reference, the number of patches, rows and columns of the chart. This information is useful for some devices, for example, to set them up quickly and easily.
Patch information: When hovering the mouse over a color patch, information about the respective patch is displayed, such as the patch number, the color space including reference values and measured values. When comparing with a profile, information about the DeltaE deviation is also displayed.
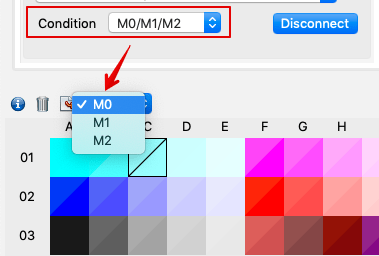
Show: Select the measurement condition to be displayed. Only available for datasets containing multiple measurement conditions.
Delete icon: Deletes all data measured so far and displays the chart with the reference values.
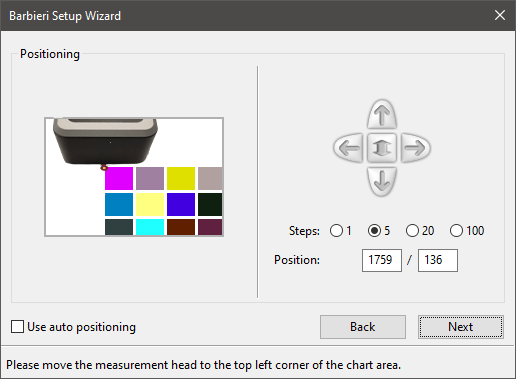
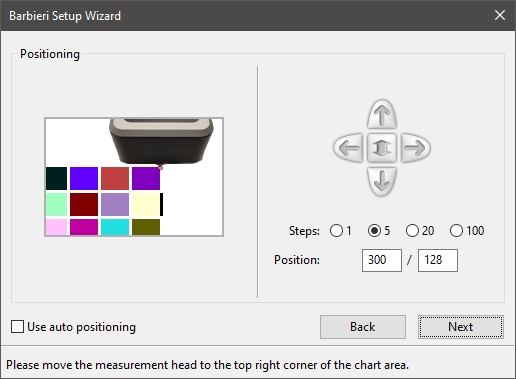
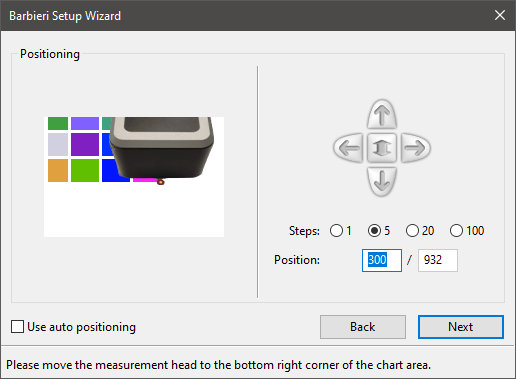
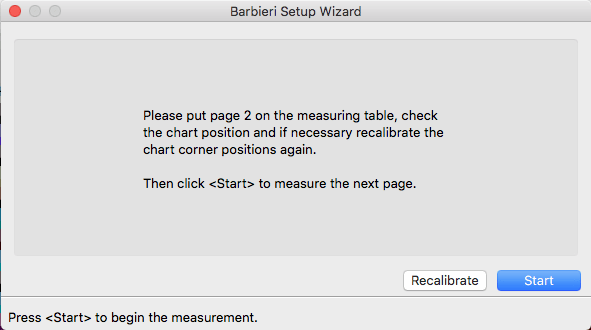
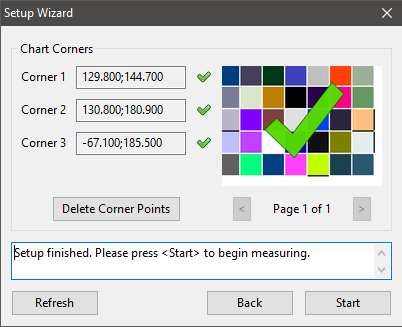
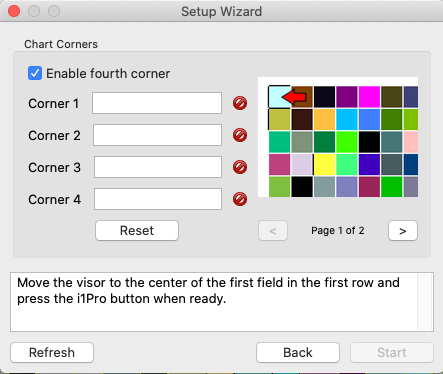
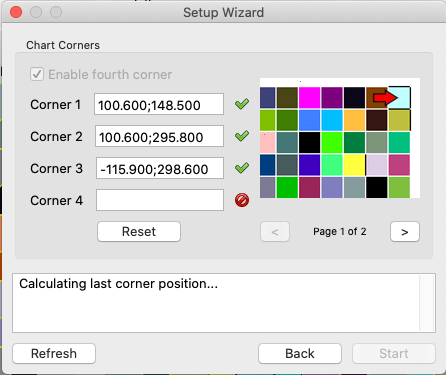
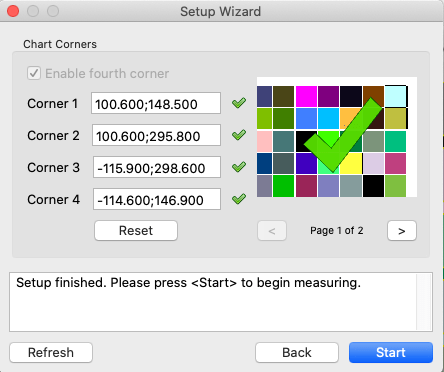
Notification messages: On the left below the display area you will see various notes and messages about the current measurement. For example, when measuring charts, there may be instructions about changing charts, or a message indicating a questionable measurement in a row (e.g., when the wrong row has been measured).
Help icon: The help icon on the bottom right takes you to ColorAnts Online Help with a single click.
Measurements window:
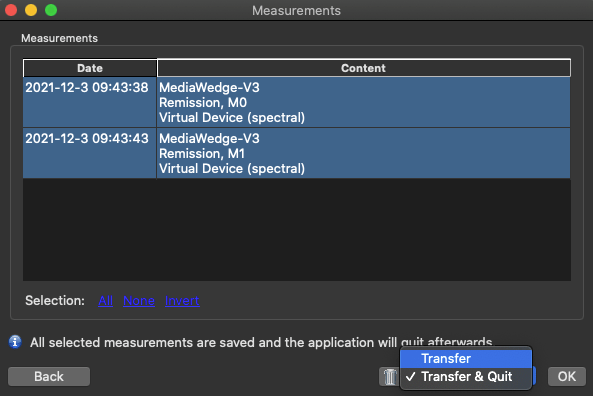
Date: Shows the date and time of the chart measurement.
Content: The name of the measured chart.
All: Selects all entries.
None: De-selects all entries.
Invert: Inverts the selection.
Back: Returns to the Measure Tool.
Trash can icon: Deletes selected measurements.
Transfer: Transfers the selected data to ColorAnt’s Data Sets section and returns to the Measure Tool.
Transfer and Quit: Transfers the selected data to ColorAnt’s Data Sets section and closes the Measure Tool.