ZePrA | Configuration | Image Quality

Image Quality

Manage all image quality settings in one place

Image Quality

All image quality-related aspects, such as Format Options, the Image Resolution and Image Dimensions as well as the sharpness (Sharpening) are grouped together in the Image Quality tab.

Format Options

TIFF, JPEG, PSD, or PSB image formats are processed in ZePrA  the same way as image data of a PDF file.

ZePrA supports images with 8 bit and 16 bit color depth. The color depth of the input data is preserved in conversions unless TIFF, PSD or PSB files are saved as JPEG files. This results in a color depth of 8 bit since only 8 bit is possible in JPEG files.

Compression Method: Four compression methods can be used for the color conversion of images:

  • Automatic: Images of PDF files can use a variety of compression methods. The Automatic method typically ensures that all existing image formats and compression methods are preserved. The only exception is that JPEG2000 compressed images of PDF files are written as lossless ZIP compressed images.
    This improves interoperability with various PDF workflows and viewers.
  • Lossless: Saves the image file in either PSD or TIFF format. JPEG data compressed into a PDF file is converted to ZIP. Multicolor files cannot be saved as JPEG.
  • JPEG: JPEG compression converts TIFF and PSD files to JPEG as well as uncompressed or ZIP compressed data of PDF files.
  • From Source: Ensures that all existing image formats are preserved, neither the color depth, type nor compression of the input data are changed.
    Note: ZePrA does not support JPEG2000 image file formats such as *.jp2, *.jpf or similar.

Preferred lossless Format: TIFF or PSD are available as lossless output formats.

JPEG Quality: Specifies the quality of JPEG compression for pixel images and JPEG-compressed images in PDF files. The compression rate is set to High by default, which can result in a larger file after color conversion for maximum compressed JPEG images.

Select one of the four predefined quality levels or use Custom to set an individual compression factor.

Tip: We recommend using the default setting High (90%).

Image Resolution

The Image Resolution section allows changing the resolution of images by adding thresholds for downscaling and upscaling. This applies to both pixel images and images in PDF files.

Change Image Resolution: This checkbox defines the desired resolution of images. Specify the required resolution in dpi. At least one of the threshold checkboxes must be enabled.

Downsample Threshold: Specifies the resolution from which images should be downscaled, for example, to optimize data for display on the Internet, to adjust the resolution for printing, or to avoid unnecessary resizing.

Note: ZePrA uses the “Bisquare” interpolation method to compensate for the potential loss of sharpness that may occur when images are scaled down.

Tip: The bicubic (sharpen) interpolation method of Photoshop can produce sharper images than ZePrA, but unlike ZePrA it shows noticeable artifacts. As described under Sharpen, the image downscaling and sharpening functions can be combined in ZePrA, in which case ZIP compression is used for images.

Upsample Threshold: Specifies the resolution from which images should be upscaled, for example if the image resolution is too low for printing (such as 72 dpi) or to avoid unnecessary resizing.
Example: To upscale images with a resolution below 150 dpi to 300 dpi, set the Upscale Threshold to 150 dpi and the Change Image Resolution value to 300 dpi. This configuration ensures that only images with a resolution lower than 150 dpi are upscaled, while images between 150 and 300 dpi remain unchanged to prevent unnecessary resampling.

Note: ZePrA uses the “Bicubic Catmull” interpolation method to compensate for the potential loss of sharpness that may occur when images are upscaled.

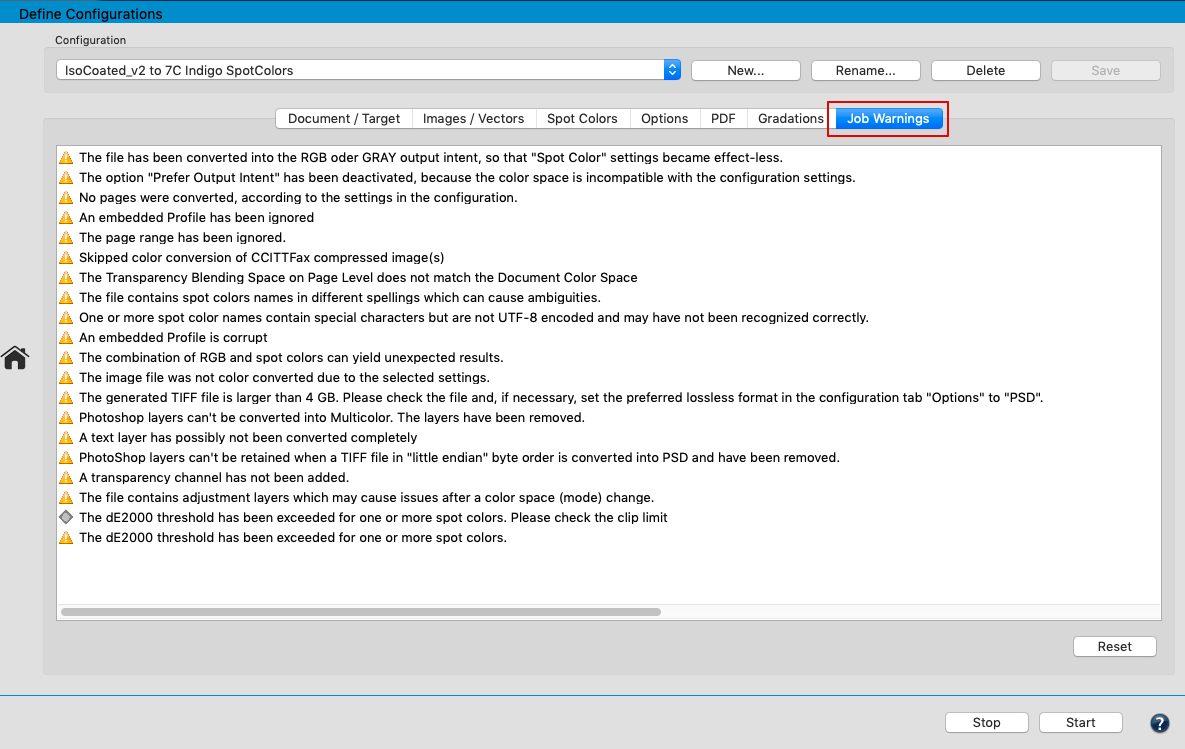
Note: When changing the image resolution, it is not sufficient to just activate the checkbox Change Image Resolution and deactivate the threshold. If no threshold checkbox is enabled, a job warning is displayed.

When all images, regardless of their resolution, are to be rescaled to a specific resolution (e.g. 300 dpi), activate the Change Image Resolution checkbox and enter the desired resolution. Select both checkboxes for the threshold values as well and define the same dpi figure in each number field. This way, images with a higher resolution (300 dpi in this example) will be scaled down, and images with a lower resolution will be scaled up.

In most situations, however, the image resolution should not be changed, and a resampling should only be considered if the image resolution is much too high or much too low. In such cases, appropriate resampling thresholds can be set.

When only downscaling from higher resolutions is required, enable the Downsample Threshold checkbox.

Conversely, if only low-resolution images need to be upscaled, just enable the Upsample Threshold checkbox.

Image Dimensions (Image Files only )

The Image Dimension section is intended for resizing image files. Among other things, this is useful for adjusting the usually enormous dimensions of pictures taken with smart phones.

Note: This only applies to image files (TIFF, JPEG, PSD, PSB files) but does not affect images in PDF files.

Mode: The available modes allow for flexible resizing with or without preserving the image’s original proportions.

  • Don’t Change: The image size and proportions remain unchanged.
  • Change Width and Height: This option allows you to manually set both the Width and Height of the image, regardless of its original proportions.
    This is useful when the image must conform to certain dimensions and the aspect ratio is of no concern.
    Note: Changing the aspect ratio will distort the image.
  • Preserve Proportion (specify width): This option allows you to change the Width of the image, while its height is automatically adjusted to maintain the original aspect ratio.
    This is useful when the image has to be adjusted to a certain width and image distortion is to be avoided.
  • Preserve Proportion (specify Height): This option allows you to change the Height, while the width is automatically adjusted to preserve the image’s aspect ratio.
    This is useful when the image needs to fit to a specific height and image distortion is to be avoided.
  • Change Width only: This option changes only the Width, without adjusting the Height, which will distort the image.
    This option is useful when a horizontal stretching or compression effect is desired and proportional accuracy is not required.
  • Change Height only: Changes the height while keeping the width fixed. This will stretch or compress the image vertically.
    This option is useful when a vertical stretched or compressed effect is desired and proportional accuracy is not required.

Width: Enter the desired image width and select the appropriate unit from the drop-down menu.

Height: Enter the desired image height and select the appropriate unit from the drop-down menu.

No Resampling: The number of pixels in the image remains unchanged, only the physical dimensions (width and height in cm or inches) are adjusted by automatically adjusting the image resolution. This avoids resampling, which is typically associated with a loss of quality.
This approach is particularly useful for images with low and unsuitable resolutions for print, such as smartphone images at 72 dpi, but with very large width and height.
Note: The checkbox is only available if the Image Resolution options above are unchecked. It is best suited when one of the two Preserve proportion Modes is used. In other modes, a workflow warning appears, but the function can still be executed.

Sharpening

Lack of sharpness is usually already compensated for by the camera or the integrated recording software. In addition, the Sharpen function is also used as a creative option in image processing programs.

ZePrA uses the “Unsharp Masking” algorithm for sharpening, which is also used by Adobe Photoshop. Sharpening images involves intensifying differences in brightness or color between two adjacent pixels. This can lead to lines between image areas with different brightness/color when sharpening strongly.

With ZePrA’s Sharpen function, images can be sharpened after color conversion. In media production, there are several reasons for using sharpening:

  • To compensate for digitalization shortcomings (digital photo or scan)
  • Sharpen as a creative option
  • To compensate for loss of detail after changing the image resolution
  • To compensate for shortcomings in the printing process (e.g. screening)

Sharpening of image data can be applied to individual color formats (CMYK, RGB, Multicolor, Gray, Lab) or all color formats simultaneously.

Sharpening generally takes place after color conversion. In certain situations, for example when a transparency reduction is to be performed at the same time, images are sharpened before conversion.

Sharpening Presets

Three presets are available for sharpening – in addition to the option not to sharpen. Custom settings are also possible.

Note: Files that were created in a controlled, in-house working environment can usually be sharpened stronger.

Preset

  • Moderate Sharpening of all Images: Recommended presetting. Compensates for typical anomalies in the printing process.
  • Strong Sharpening of RGB and Gray Images: For media-neutral workflows that frequently use high-resolution RGB and Gray images.
  • Moderate Sharpening of downsampled Images: Compensates for minor sharpening losses that can occur, for example, when downscaling.
  • Custom: Allows all sharpening parameters to be defined individually. An Amount of 80% and a Threshold of 8 usually provide stable results.

The following parameters can be set individually:

Radius: The wider the radius, the wider the line created during sharpening. The choice of the correct radius depends on several factors, such as the usual viewing distance or the resolution of the printing process used. For more information see the section on the relationship between scaling and image resolution below.

Amount: Indicates the intensity of sharpening in relation to the selected radius and should take into account the sharpness of the original image and the anomalies of the printing process.

Threshold: Describes the difference in color or brightness at which the sharpness filter will apply. The lower the threshold, the more image areas will be sharpened and the greater the risk that unwanted image artifacts will also be sharpened. The usual values here are 2 to 10.

Tip: Too much sharpening due to an excessively high Radius and too much Amount can lead to an unnatural image display. Depending on the Sharpening settings, artifacts that were previously not visible can now be visible and over-emphasized. This applies in particular to the square patterns of JPEG compression or the image noise in dark areas of digital photos.

To learn more about the special work processes/flattened transparencies and sharpening, see Working with Transparencies.

Image-based vs Output-based Sharpening Radius

The sharpening Radius can be defined in two different ways: image-based or output-based.

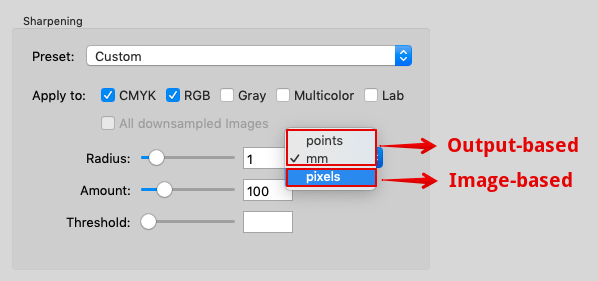
Image-based sharpening: The Radius is specified in pixels. With a radius of 2 pixels, the effective width of the sharpening is correspondingly 2 pixels. Corresponds to the method of the “Unsharp Mask” filter in Photoshop.

If a sharpened image is placed in a layout program, the visually perceived effective width or radius of the sharpening depends on the image resolution in pixels per inch (ppi) and the scaling in the layout program.

Example: If you specify a radius of 2 pixels for an image with 288 ppi resolution and place it in a layout program with a 100% scale, the visually perceived radius of sharpening is 0.5 points (0.18 mm). This results from the fact that 72 points represent one inch. For an image with 288 pixels per inch, one pixel is 0.25 points (0.09 mm) wide.

Output-based sharpening: The sharpening radius (in points or mm) remains the same for images with different resolutions or scaling in the layout program. Since output-based sharpening mainly compensates for detail losses of the output system (e.g. due to rasterization), it is ensured that the sharpening radius of all images in the document counteracts the detail loss of the output in a comparable way.

sharpening-2 sharpening-one

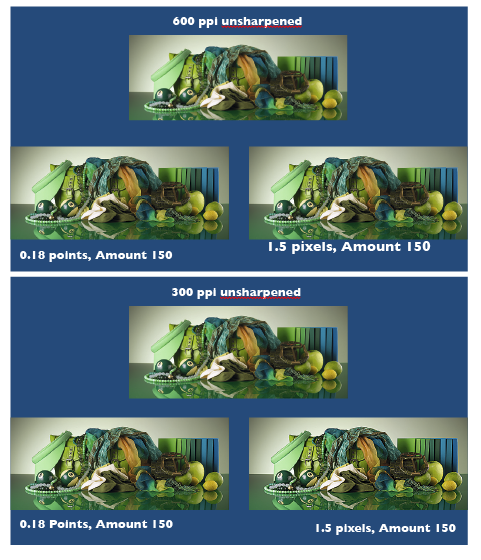
Correlations Between Scaling and Image Resolution

If you reduce the image from the previous example with 288 ppi resolution to 50% in the layout program, the image resolution changes to 576 ppi. An output-based sharpening with 0.5 points results in a doubled radius of 4 pixels.

Typical image-based sharpening radii of 300 dpi images with 100% scaling in the layout program correspond to the following values of output-based sharpening in points:

0.8 pixels = 0.19 points
0.9 pixels = 0.22 points
1.0 pixels = 0.24 points
1.1 pixels = 0.26 points
1.2 pixels = 0.29 points
1.3 pixels = 0.31 points
1.4 pixels = 0.34 points
1.5 pixels = 0.36 points
1.6 pixels = 0.38 points

Converting the Width of an Image Pixel of Any Resolution into Points

The following correlation applies:

Radius (in points) = 72 / Image resolution (in ppi)

Note: Adobe Photoshop uses the term dpi (dots per inch) instead of ppi (pixel per inch).

The radius of the sharpness should not be larger than the raster width in the print. The following table shows the raster width and the radius of the sharpness (in mm) in a ratio of 1:1:

60 l/cm= 0.17 mm (0.48 points)
70 l/cm = 0.14 mm (0.40 points)
80 l/cm = 0.13 mm (0.37 points)
90 l/cm = 0.11 mm (0.31 points)
100 l/cm = 0.10 mm (0.28 points)
110 l/cm = 0.09 mm (0.26 points)
120 l/cm = 0.08 mm (0.23 points)
200 l/cm = 0.05 mm (0.14 points)

l/cm = lines per centimetre

If you are printing with a 70 l/cm screen ruling, the radius should be 0.14 mm or less.

The sharpening radius (in mm) corresponding to a given screen ruling can be calculated using the following formula:

Radius (in mm) = 10 / screen ruling (in lines per centimeter)

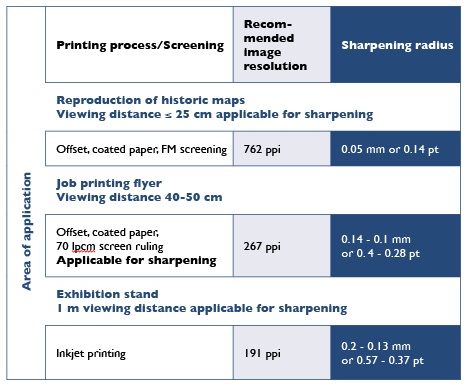
Sharpening and Image Resolution in Relation to Viewing Distance, Printing Process and Screen Ruling

The radius of the sharpening can be determined by taking the viewing distance, the printing process and the screen ruling into account.

The maximum resolution of the eye – depending on the contrast of the structures and the position in the field of view – is approximately 0.2 mm (127 pixels per inch) at a viewing distance of 1 m or approximately 0.05 mm (508 pixels per inch) at a viewing distance of 25 cm.

The image resolution and effective width (or radius of sharpening) should only be adjusted to the print resolution if the selected printing method is capable of reproducing details in the resolution of the eye for the respective viewing distance. To be on the safe side, the image resolution should be approximately 1.5 times higher than the print resolution or the assumed viewing distance.

Example 1: An offset print with a screen ruling of 70 l/cm (178 lpi) can reliably reproduce details up to 0.14 mm wide, which also defines the maximum radius of sharpening. With a 1.5-fold reserve, the image resolution should be at least 267 ppi.

Example 2: At a trade fair stand viewed from a distance of 1 m, the normal eye can detect details down to approximately 0.2 mm, which determines the radius of sharpening. With a 1.5-fold reserve, an image resolution of 191 ppi is sufficient.

ZePrA | Spot Color Iteration (ZePrA 9 and higher)

Spot Color Iteration

Iterate spot colors to improve or maintain quality

Iterate Spot Colors

Spot Color Iteration is a process that involves printing of the spot colors converted from ZePrA on the printer to be used for the print job, followed by measuring test charts and optimizing the color differences (expressed in deltaE2000) until the measured deltaE values are within the desired tolerances. Printing the test chart and applying the Iterate Spot Colors feature once only already results in an improved spot color rendering which is usually close to the optimum of this printer.

Why can spot color iteration be required?

First of all, be assured that ZePrA already calculates the best possible spot color conversion based on the target profile set under Configuration/Target Color Space. However, printers, inks and papers drift over time so that there are always some deviations from the state the printer was profiled. During spot color iteration we measure how converted spot colors are actually printed in the current state, and subsequently optimize the deltaE2000 values. The iteration report shows which colors are improved and where restrictions based on the color gamut or the spot color Calculation Method occur so they can’t be optimized further or if additional iteration steps are recommendable.

Procedure

Open the Spot Color Iteration Wizard, either from:

  1. The Spot Colors tab under Configurations (Configurations > Spot Colors > Iterate at the bottom of the window).

  2. The Tools menu (Tools > Spot Color Iteration).

  3. Alternatively, if a job with spot colors has been converted via a queue and the associated configuration is set to Convert Spot Colors, the Spot Color Iteration Wizard can be started by right-clicking on this job in the Processed Jobs section of the Overview window and selecting Spot Color Iteration.

Note: A spot color module license is required to use the tool.

The Spot Color Iteration Wizard dialog consists of two tabs, the Current Iteration and the Archive tabs. The Current Iteration tab contains the actual iteration wizard and typically, if a configuration is selected that has not yet been iterated, the wizard is started directly there. The Archive tab contains all the iteration steps that have been carried out, including all the evaluation details.

The wizard guides the user through the iteration process in seven steps:

Step 1: First, select the Configuration you would like to use for printing. The option Convert Spot Colors must be enabled in this configuration.

Notes: When the Spot Color Iteration Wizard is started via Processed Jobs of the Overview, the Configuration is already preselected.
The best approach for the iteration of spot colors is to set the Calculation Method to Precise Match or Visual Match in the respective Configuration.
The setting Use the least Amount of Channels may be insufficient for iterating spot colors. Importantly, spot color iteration will not work when the spot color conversion is set to Convert using Alternate Color Space from PDF.

Step 2: Select the source of the spot colors you would like to optimize. You can either choose a PDF or Image File with spot colors or an entire spot color Library.

Note: When the Spot Color Iteration Wizard is started via Processed Jobs of the Overview, the Job (PDF or image file) is already preselected.

Step 3: Select one or more spot colors for iteration. All spot colors of the job, PDF or image file will be automatically extracted and displayed. Disable the colors that are not to be iterated. By default all spot colors are preselected.

Step 4: Choose to Create a Test Chart or to measure the full tones of spot colors from an existing print (Don’t create Test Chart).
Create a Test Chart: Creates a test chart with the spot colors selected in the previous step. Select an Instrument Setting and click on Save to enable the Continue button.

Don’t create Test Chart: Some prints contain control patches of spot colors that can be used for measuring. Larger areas in the design that contain the 100% tone of a spot color can also be used.

Note: The test chart contains the converted spot colors as given in the Configuration using the conversion settings and Calculation Method defined in the tab Spot Colors.

Step 5: Measure the printed spot colors. When using the test chart, it must be printed on the printer without any color management and can be measured after drying.
Measure: Starts the Measure Tool. You do not need to worry about the reference file and layout, as this is already preselected within the Measure Tool. Instructions on how to select your device and make measurements can be found under Measure.

Load: If you have created a test chart you can use the associated exported reference file and measure your printed chart with a different measurement tool. Make sure that the measurements are saved in standard file formats that can be read by ZePrA, such as CGATS TXT, XML or CXF3. The external measurement files can be loaded using the Load button.

Once the measurement data has been transmitted from Measure Tool or loaded from external sources, and it conforms to the printed chart which is indicated by a green check mark, you can proceed by clicking Continue.

Note: When loading measurement data that does not match the chart layout or the corresponding patches in the reference file, you are alerted by a warning message and cannot proceed to the next step.

Step 6: The evaluation results of the measurements of each spot color are displayed in comparison to the reference Lab values of the original spot colors. In addition to the DeltaE2000 (dE00) and DeltaE76 values, a Status information text is also displayed, either in green, yellow or orange. The Legend below the table explains the indication colors and status information.

Green: The spot color match is less than 1 dE00 and a perfect match is achieved. Further optimization is then no longer required. 

Yellow: The spot color match is less than 2 dE00 but higher than 1 dE00 and the Status column indicates that the match can further be improved.

Orange:  The spot color has a higher deviation than 2 dE00 and the Status column indicates that the match can further be improved.

If a color is not optimizable or out-of-gamut, it can not be improved which is indicated in the Status information column, too.

ZePrA preselects one of the two options (Apply Optimization or Don’t apply Optimization) depending on the evaluation results. However, the preselection can be overridden and another iteration cycle can be applied if the results are to be improved even further. To do this, select the Apply Optimization radio button and click Continue. Alternatively, if you just need the measurements for evaluation select the Don’t apply Optimization radio button.

Step 7: The concluding step of the iteration cycle contains three options and a checkbox to choose from. Based on the previous results, the wizard already preselects a logical option for you to follow:

  1. Optimize Spot Colors again: Runs another iteration cycle, for example, to check whether a previously iterated spot color successfully passes the evaluation. If you select this radio button and click Continue, a new iteration cycle starts with step 1 and the selection of the spot colors to be optimized.
  2. View the evaluation results in the Archive tab: If you have already completed several iterations or would like to see the evaluation results once more, select this option. When you click Continue, the Archive tab opens.
  3. Close this dialog: If the evaluation results are fine or if you want to end the iteration process you can simply select Close this dialog and by clicking Continue the iteration is ended. 

The checkbox Repeat Job works independently from the three radio buttons. If it is enabled when clicking Continue the last job is converted again with the configuration. This is especially helpful if the spot colors of that last job have been optimized by the wizard which in turn optimizes the spot color settings in the configuration to improve the spot color rendering. 

You will find the optimized device values (Output values) in the table of the tab Spot Colors under Configuration. They will be marked as Iterated in the column Information of the table. 

Archive

All data created during the iteration – such as test charts, reference data and measurement data, as well as the report – are stored in an internal database in addition to the save location defined by the user.

Therefore, if data is deleted from the save location it can still be restored from the internal database any time via the Archive tab. Users can stop an iteration process and even close the Spot Color Iteration Wizard dialog at any time and can revert back to the last completed step with the help of the information stored in the Archive.

The Archive tab shows all iteration steps and evaluation details. The History table contains a list of all iterations. More information for the selected iteration step is displayed under Details.

The columns of the History table show the iteration step number #, the maximum DeltaE00 value dE00 (max), the average DeltaE00 value dE00 (avg), the Status of the selected iteration step. It also shows some Information about the iteration process itself, such as Optimization applied, when the measurements done from the printed test chart have actually been used to iterate a spot color, or Evaluation measurement, when the measurements have been used for evaluation only and have not been used to iterate a spot color.

In addition, the iteration process (being performed in the Current Iteration tab) can be discontinued, which is indicated with various messages such as Next step: save chart, Next step: measure or load data, Next step: Evaluate.

Right clicking on an iteration step in the History displays a context menu with the following options:

Save Chart: Exports the test chart into a file selected by the user. The test chart is not newly created but only copied from the internal database. This implies that the file selection only supports the file type initially chosen by the user.

Save Reference Data: Exports the reference data that belongs to the test chart into a file selected by the user.

Save Measurement Data: Exports the measurement data into a file selected by the user.

Save Report: Saves a report containing all Details displayed on the right and the full information about each spot color. This is useful to identify colors with the highest or lowest deltaE values, or colors which are out of gamut. The report is explained in more detail below.

Revert to state before: This is only available for iterations with the status applied. Reverts back to the state before this iteration, giving the previous iteration, if any, the applied state. The status changes to evaluation measurement. All subsequent items are deleted.

Revert to state after: This is only available for iterations with the status applied. Proceeds to the state after this iteration step, making it the active iteration. The status of a next iteration, if available, would be evaluation measurement. All subsequent items after the next iteration are deleted.

Apply Optimization: This is only available for iterations with the status evaluation measurement. It can be used for evaluation measurements that have not been applied in the iteration process itself. Use this option if you want to apply an iteration later on.

Evaluation Results

The Evaluation Results shown under Details are always the evaluations of the previous step. This means, if an iteration has been applied in step 1, the evaluation results shown under Details for the selected step 1 are the values before the iteration has actually been applied. Therefore, in order to see the results of the first iteration a second step is necessary. The evaluation results shown for that second step are actually the iteration results of the first iteration step, and so on. This offers the possibility to use the results of an iteration itself for a second iteration. But again, another measurement step is needed to find out if this iteration actually improved the result.

The Report

By right-clicking on an iteration step in the left table, a report can be created for this step which can be saved in various formats such as PDF, HTML, XML and TXT. The PDF and HTML formats are the most common versions for end users, while the other formats are more intended for automation and usage in other systems such as a MIS (Management Information System). The following is a description of the PDF report.

The Report contains all information about the spot color Name, the device values generated by ZePrA (displayed in the color space of the target profile) and the measured Lab values as well as the dE2000 and dE76 deviations from the reference Lab values of the spot color and the Status. Under Status it is displayed whether the respective spot color has been well matched (less than 1 deltaE2000) and whether it can still be optimized. If the match of a spot color is smaller than 2 dE00 but larger than 1 dE00 and the match can be further improved, then it is displayed in yellow in the Status column. Finally, spot colors with a deviation higher than 2 dE00 will be highlighted in orange. If a color cannot be optimized or is out-of-gamut, it cannot be improved, which is also displayed in the Status information. The Legend below the table explains additional information messages that can be displayed.

Video Tutorial: Spot Color Iteration Wizard

ZePrA | Proofing

Proofing

Color-consistent simulation of the printing result

Proofing

ZePrA’s sophisticated technology – e.g. the quality of DeviceLink and SmartLink profiles and the spot color rendering of its advanced spot color module – can be used for proofing as well. This is especially useful as many RIPs do not support CxF/X-4 data and SCTV calibration nor have a spectral color prediction model for spot color rendering.

The Proofing tab under Configuration contains all Media wedge settings and the Proofing Information label.

Media Wedges

Two types of media wedges can be used:

  1. Media Wedge in Simulation Color Space: Can be used to determine the accuracy of the proof. This media wedge is converted based on the color management setting defined in the various configuration tabs.
  2. Media Wedge in Proofer Color Space: Allows using a second media wedge that is not color managed. It must be in the color space of the proofer and can be used to determine the stability of the proof printer.

Choose a Media Wedge.The media wedge is added outside the document’s media box to verify the proof. This can either be a dynamic or an external media wedge.

Dynamic Media Wedge: Uses the color space information of the simulation color space and dynamically adds all spot colors of the documents to be processed. The required reference files for measuring the wedges are created on-the-fly by ZePrA. They will be saved in the Folder for Report and other Data folder of the proofing queue that has automatically been set up by the Auto Setup Wizard.

Note: Currently, a maximum of 32 channels is supported for dynamic media wedges.

The reference files for dynamic media wedges contain both the device values (DCS values) and the target Lab values. The target Lab values are also calculated for the spot colors of the job and incorporated into the reference file in addition to the color values of the document color space. This is done according to the settings under Configurations > Options (solid tone only or gradation values as well) and Configurations > Spot Colors.

The measured values obtained can then be immediately compared to the target Lab values (e.g. in ColorAnt/Compare or Evaluate). Use these reference files in appropriate tools, such as ColorAnt’s Measure Tool, for measuring.

Note: Reference files are not created when the report folder Folder for Report and other Data is missing. If an existing queue is to be used for proofing, it must be verified that the folder for reports exists. If necessary, it must be created manually so that a reference file can be created. If this folder is missing, the reference file cannot be created.​

Reference files are created for each job in the queue and named as follows:

Jobname_DynamicMediaWedgeReferenceSource
Jobname_DynamicMediaWedgeReferenceTarget

If dynamic media wedges are selected for source and target color spaces, two reference files for each job will be created.

Note: If the same job is run again, the reference file will be overwritten. This means that if the spot color patches are changed under Options, a modified reference file is saved, and any previous conversion with the reference file with a different number of patches is lost.
The use of spot colors for the dynamic media wedge can be defined under Options 

Media Wedge from File: Can be media wedges such as the FOGRA, UGRA, Idealliance* or other media wedges. For external media wedges, the corresponding reference file is required to measure the printed wedge. Measurements can be done with any proof evaluation software or with ColorAnt’s Measure Tool.

*The IDEAlliance ISO 12647-7 Control Wedge 2013 is included in ZePrA and available under /Users/Shared/ColorLogic/MediaWedges (Idealliance ISO 12647-7: 2013, 3-Row Digital Control Wedge ® is a registered trademark of the Idealliance).

Note: A separate ColorAnt license is required to use the measurement and comparison features.

Proofing Information: Enabling this checkbox will add text information which are in accordance with ISO 12647-7 such as information about the job, date and time, conversion settings and the software used. The information that will be added to the converted file can be verified and edited in the text field. For editing switch to Custom.

Frame: Adds a frame around the Proofing Information.

Logo: Inserts the logo specified in the Preferences into the Proofing Information.

Position: The two media wedges and the proofing information label can be positioned independently on the converted document. For each of these 3 elements, the user can specify where it should be placed. Positioning options are: Automatic, Bottom Margin, Right Margin, Top Margin, Left Margin. The elements are placed outside the media box of the document according to this setting. This results in an enlarged media box in the converted document. Automatic is suggested as default settings for all 3 elements to make sure that they are placed together on the converted job.

Options: General settings and settings for Dynamic Media Wedges can be defined under Options.

Media Wedge Options

General

Font Size: Defines the font size used for the proofing information label in points.

White Space: Allows the placement of margins on media wedges by entering a user-defined distance in mm. By default, a white space of 15 mm is added. This ensures that enough white space is added on the left and right of the placed media wedges which some instruments need for correct measuring. The White Space margin applies both to external and dynamic media wedges.
Note: If the external media wedge already has a margin, we recommend entering 0 mm as White Space. As a rule of thumb, the white space in millimeters for dynamic media wedges should be at least the size of the Patch Width. The white space of the Media Wedge in Simulation Color Space is color managed whereas the white space of the Media Wedge in Proofer Color Space is not.

Place on every page: For multi-page PDF files media wedges can be placed on each page. By disabling the checkbox media wedges will be placed on the first page of the PDF only.

Dynamic Media Wedges

Defines the Default Chart Width, the Patch Width and the Patch Height of the dynamic wedge.

Gap Size: To separate individual patches. Select the width in mm. When using the Auto option, gaps of 0.5 mm are added between patches.

Patch Distribution: Defines the distribution of patches on the media wedge.

  • Randomize: Color patches are distributed randomly.
  • Normal: Color patches are distributed as specified in the reference file.
  • Sorted: Color patches are sorted from light to dark.

Patches per Spot Color: Defines whether spot colors are to be used in the dynamic media wedge and, if so, whether tints are to be used.

  • None: No spot color is added to the dynamic wedge.
  • Solid Tone: Only the solid tone of each spot color in the job is used in the dynamic wedge.
  • 3 Patches: Uses the following patches for each spot color: 100%, 70%, 40%.
  • 5 Patches: Uses the following patches for each spot color: 100%, 70%, 40%, 20%, 10%.

Exclude Colors from dynamic wedges: Spot colors are used in documents for various reasons besides printing purposes, e.g. to illustrate the DIE cut lines, or varnish, braille or other nonprinting elements. Obviously, those colors are not to be used in the dynamic media wedge. To avoid using them in media wedges, create a library (or more if needed) containing all spot colors to be excluded and select it (or them) from the list under Exclude Colors from dynamic wedges. This list contains all spot color libraries managed by ZePrA. Enable the checkboxes of only those libraries which contain the colors to be excluded.

The selected libraries containing the colors to be excluded are also applied to spot colors of external media wedges. Typically, if the Document Color Space is Multicolor, ZePrA assigns the channels of the Document Color Space to the channels of the media wedge. This is intended in most cases, e.g. if a 7C media wedge with generic channel names is used for a 7C Document Color Space in such a way that the channels are associated. However, this is not intended in case a spot color White is to be used as 5th channel and the 5th channel in the Multicolor profile of the Document Color Space is called Orange (for example). To retain the white spot colors an exclusion library which contains White as non-printing color can be selected.

Video Tutorial

How to Use the Proof Evaluation Tool in ColorAnt in combination with ZePrA

Learn step-by-step how to use the Proof Evaluation tool in ColorAnt for the evaluation of a proofing media wedge created with ZePrA. In this example, we will be demonstrating the special feature of ZePrA to create a dynamic media wedge using process and spot colors and how to use the supplied reference data from ZePrA for evaluation of a Contract Proof.

ZePrA | Job Warnings

Job Warnings

Customize job warnings for configurations

Customize Job Warnings for Configurations

In general, job warnings and error messages will be issued when problems or errors occur while processing a file. Files with a yellow warning in the Overview window have been processed but may have issues. They are placed in the Output Folder. Alternatively, when configuring the Queue, define an Output Folder with Warnings, where such files will be moved after processing. Incorrectly processed files, fatal errors or unsupported file types are highlighted in red and are moved to the Error Folder.

The list contains all existing warning messages. Their behavior can be customized independently for any configuration, for example if you don’t want a warning message for a certain problem or if you feel that a problem is so serious that it should better be treated like an error.

Note: The behavior of error messages can’t be changed.

Job Warnings can be adjusted individually: Right click on the desired job warning to open the context menu. Select Inactive, Active or Active (Treat as Error).

Inactive: Deactivates the job warning in the selected configuration. The Overview window no longer displays a yellow warning.

Active: Activates the job warning in the selected configuration.

Active (Treat as Error): Treats the associated problem like an error. The file will be highlighted in red and moved to the Error Folder.

Reset: Resets the changed warnings to the default settings.

ZePrA | Spot Color Iteration

Spot Color Iteration

Iterate spot colors to improve or maintain quality

Iterate Spot Colors

Spot Color Iteration is a process that involves printing of the spot colors converted by ZePrA on the printer to be used for the print job, followed by measuring test charts and optimizing the color differences (expressed in deltaE2000) until the measured deltaE values are within the desired tolerances. Printing the test chart and applying the Iterate Spot Colors feature once only already results in an improved spot color rendering which is usually close to the optimum of this printer.

Why can spot color iteration be required?

First of all, be assured that ZePrA already calculates the best possible spot color conversion based on the target profile set under Configuration/Target Color Space. However, printers, inks and papers drift over time so that there are always some deviations from the state the printer was profiled. During spot color iteration we measure how converted spot colors are actually printed in the current state, and subsequently optimize the deltaE2000 values. The iteration report shows which colors are improved and where restrictions based on the color gamut or the spot color Calculation Method occur so they can’t be optimized further or if additional iteration steps are recommendable.

Procedure

Open the Iterate Spot Colors dialog right from the Spot Colors tab of the Configuration you would like to optimize or the Tools menu and follow the steps from top to bottom. A Spot Color module license is required to use the tool.

Step 1: First, select the Configuration you would like to use for printing. The option Convert Spot Colors must be enabled in this configuration.

Notes: The best approach for the iteration of spot colors is to set the Calculation Method to Precise Match or Visual Match in the appropriate Configuration.

The setting Use the least Amount of Channels may be insufficient for iterating spot colors. Importantly, spot color iteration will not work when the spot color conversion is set to Convert using Alternate Color Space from PDF.

Step 2: Select the source of the spot colors you would like to optimize. You can either choose a PDF or an image file with spot colors or a complete spot color library. In the following example we will use a PDF file with spot colors as source file.

Step 3: A test chart file will be created from either a PDF or Image File or a spot color Library. If you select a PDF file and click on the Save button, ZePrA will extract all spot colors (full tones) used in the file and convert them using the selected configuration. In this step select an Instrument Setting for your measuring instrument. In the Save dialog, choose either a PDF or TIFF file type to create a test chart which contains the spot colors as a strip optimized for your measuring instrument. In addition, the  associated reference file for measuring will be created. The newly created test chart needs to be printed on the printer to be used for the print job.

Note: The test chart contains the converted spot colors as given in the Configuration using the conversion settings and Calculation Method defined in the tab Spot Colors.

Step 4: Print the test chart on your printer. Do not apply any color management when printing the test chart.

Step 5: Subsequently, measure the printed test chart using ColorAnt/Measure Tool or an appropriate software. The required reference file which is needed for measuring the spot colors will be shown in step 3. Click on Measure to open the Measure Tool in ColorAnt. The reference file will be selected automatically so that you can use the tool right away for measurements with your instrument. For information on how to use the Measure Tool in combination with your instrument follow the instruction given in the online help. Alternatively you may use the provided reference file for measurements with other tools.

Step 6: This step is optional but highly recommended. If you click on Save Report a Spot Color Iteration Report will be generated. The report provides you with information about the achieved and measured deltaE values.

The last column of the report – Status – provides status information such as improvements, recommendations about further processing or warnings. If the deltaE00 value is already very low (lower than 1) further optimization is not needed and the color is marked green. Colors that are marked yellow are higher than 1 but below 2 dE00 and colors marked orange are higher than 2 dE00. For colors that have been improved by an iteration the improved value is shown in brackets expressed as deltaE behind the status. If a spot color is out of gamut or optimization is not possible due to restraints from the selected configuration those colors are marked accordingly. A Legend below the table of the report explains the different statuses.  If a color is marked as Optimizable, the value in brackets behind the status indicates the maximum improvement to be expected.

Step 7: When clicking the Apply button the optimized spot colors (based on the measurement data) will be calculated and applied in the Configuration. Only tick the checkbox Iterate all Spot Colors if you would like to iterate all spot colors. We recommend to deactivate the checkbox in order to include only those spot colors in the iteration which can actually be improved. Consequently, if the checkbox is disabled, spot colors which are already marked as Good in the report will not be optimized further.

A feedback message informs the user when a spot color iteration has been applied successfully.

You will find the optimized device values (Output values) in the table of the tab Spot Colors under Configuration. They will be marked as Iterated in the column Information of the table. 

Expert tips: It is a good idea to Export the optimized spot color table of the tab Spot Colors. This will give you the chance to revert to these values in case you do some further iterations or change some values manually. Another tip in case you would like to revert to the original values without iteration is to use the Reset button in the Spot Color Iteration dialog. This deletes the iterated colors from the table.

Additional information

If you would like to evaluate the improvements in terms of deltaE2000 after Step 7 you need to print the optimized spot colors once more. To do so click on the Save button  in Step 3 of the Iterate Spot Colors dialog to create a new test chart file with the optimized device values and a new reference file. Make sure to use the second  testchart file when printing and measuring rather than the first one! After measuring and saving a new Report you can assess the improved deltaE00 values. You can continue to iterate by simply clicking the Apply button in Step 7. Or, in case the deltaEs are fine and further iteration is not recommended, simply close the dialog without applying the new measurements.

If the selected source file does contain spot colors which have not been considered in the selected configuration, an error message will appear as the test chart cannot be created. For that reason we recommend to convert the source file containing the spot colors integrating the wanted configuration prior to the iteration, or to verify them using the Spot Color Report in order to ensure correct settings in the configuration.

If you would like to optimize the creation of the test chart for you measuring device (for Step 3 of the iteration) you can create your own settings using the tool Export Chart in ColorAnt. The newly created settings are available in the drop-down menu Instrument Setting after the dialog Spot Color Iteration has been closed and reopened.

The measurement data that has been transmitted from Measure Tool to ZePrA in Step 5 is saved for later use in the shared folder for all users under ColorLogic/SpotColorMeasurements (Windows: C:\Users\Public\Documents\ColorLogic\SpotColorMeasurements. Mac: \Users\Shared\ColorLogic\SpotColorMeasurements).

ZePrA | Applying Correction DeviceLinks

Correction DeviceLinks

Modify target profiles with updated profiles or correction DeviceLinks

Apply Correction DeviceLink Profile

The more reliable the color behavior of your press and the more accurate the associated ICC profile for the printing process, the better the color conversion with ZePrA. In practice, however, things often look different. Fluctuations between paper batches, varying tonal value increases or fresh printing inks deviate from the ink series last used, which leads to color deviations and differences in the tonal value distribution.

To compensate for these fluctuations and deviations, CoPrA SP* with its Update Profile module is part of ZePrA’s SmartLink module. Instead of generating a completely new press profile and DeviceLink profile in case of deviations, a correction DeviceLink profile can be used to adapt to the changed conditions.
Very little information, such as the spectral measurement values of dot gain strips or, even better, of the Reprofiler measuring strip provided by CoPrA SP*, will ensure that your press produces the same color impression as before the deviation.

The Correction DeviceLink profile will be applied after the color conversion defined in your configuration. So you can continue to use your tested and proven DeviceLink profiles and do not have to replace them due to a change in the target color space of your press.

Note: *SP = Serialized Profiles. The profiles created with CoPrA SP are encoded with the serial no. of the ZePrA color server and can only be used there.

Update/correct the target profile in CoPrA

CoPrA’s Update Profile module allows existing ICC profiles to be updated with a few measurements. Correction DeviceLink profiles based on updated profiles can optionally be created for application on print data. These profiles can be selected in ZePrA under Configurations in the Document/Target tab by activating the Apply Correction DeviceLink Profile checkbox in the Target Color Space control panel. ZePrA versions prior to 4.6.2 do not support this profile type.

Procedure

  1. Select a measuring strip. CoPrA contains two Reprofiler measuring strips for different measuring devices for CMYK and RGB-based printing systems. For other color spaces, ColorAnt can be used to create suitable measuring strips.
    (1) The Reprofiler measuring strip small is available in a one-row and a two-row version. The one-row version can be placed more easily in the trim area of a printing press. The two-row strip is more suitable for digital printing or inkjet systems.
    (2) The Reprofiler measuring strip large contains considerably more color patches and is therefore better suited for optimizing larger color variations, as well as in digital and inkjet printing.
    Note:Besides the included ColorLogic measuring strips, other measuring strips can also be used, for example Ugra/Fogra Media Wedge, IDEAlliance Media Wedge, ECI GrayControl Strip, ECI bvdm TVI or UGRA UDKS Wedge. Alternatively, you can use an existing measurement file that reflects your current printing conditions.
  2. Print the measuring strip. To do this, deactivate the color management settings, i.e. no simulation of a printing condition will take place. This is especially true for digital printing systems.
  3. Measure the measuring strip with a spectrophotometer.
  4. The Update Profile tool in CoPrA optimizes the ICC profile of your target profile (= printer profile selected as Target Color Space in ZePrA).
    Note: If you use the Apply Correction DeviceLink Profile function, you do not need to replace the profile set as the target color space because this is done elsewhere – see below. 

Applying the correction DeviceLink profile in ZePrA

  1. In Configuration, Document/Target click the checkbox Apply Correction DeviceLink Profile. If there are no correction DeviceLink profiles, the option is grayed out.
  2. Click Settings to open the Correction DeviceLink Profile dialog and select a correction DeviceLink that has previously been created by CoPrA.
  3. The corresponding optimized target profile should also be embedded in the converted file (Embed updated Target Profile instead of the Target Profile). This will make this profile the new Output Intent of the converted PDF file. The updated target profile is shown below.
    Note: ZePrA checks whether suitable Correction DeviceLink profiles and optimized printer profiles exist for the selected Target Color Space. Only corrected or optimized profiles are shown and can be selected after activating the Apply Correction DeviceLink Profile checkbox. If there are no Correction DeviceLink profiles, the checkbox is grayed out.