ColorAnt | Edit Primaries


Edit Primaries
The Edit Primaries tool allows users to add, remove, and exchange primaries or the paper/substrate in existing measurement data and also cover many other use cases.
In typical print production, adding or swapping ink(s) requires the expense of printing a complete, full size test chart. The Edit Primaries tool simply requires the spectral data of the new ink(s) to be added or exchanged. It also recalculates all overprints based on intelligent spectral color models.
One of the major features of the Edit Primaries tool is the ability to dynamically select the best patches from the data provided. The more complete the data (spectral data is preferred) the more accurate the results.
More complete data improves:
- Exchange of gradations of the primary color
- Overprint information, e.g the primary combined with black and secondary colors
- Spectral data in general, providing the printing sequence information.
This allows creating of new ICC profiles for new color combinations quickly.
Use cases and scenarios that demonstrate the potential of the Edit Primaries tool:
- Variance in press condition: The characterization press run is slightly deficient in solid ink density or hue on one or more colors.
This video demonstrates the procedure with ColorAnt - Exchange of paper/substrate: The inks are the same but a slightly different paper is used in production or a specific job.
- Exchange inks in packaging print production: Create a new set of characterization data that swaps in e.g. Blue for a Cyan or a Rhodamine Red for Magenta.
- Increase CMYK gamut: Add a fifth, sixth, or seventh color to your CMYK measurement data by adding only the data from a small spectrally measured wedge with the desired additional primary color..
- Modify ink names and channel order: Reorder channel names without data modification. Watch an example here.
- Adjust Printing Sequence: This simulates how a different printing sequence would render colors, and what impact this would have on the gamut.
- Creation of tints for spot colors if only the full tones are known.
- Create new characterization data with minimum information.
Define Primary Colors

Eyedropper icon: The primary colors of the selected dataset can be exchanged for primary colors of other datasets.

Click on the pipette symbol to open a list of available primaries.
This list shows all the primaries contained in the datasets loaded in the main window.

Lab values of the primary colors can be modified directly in the input field.

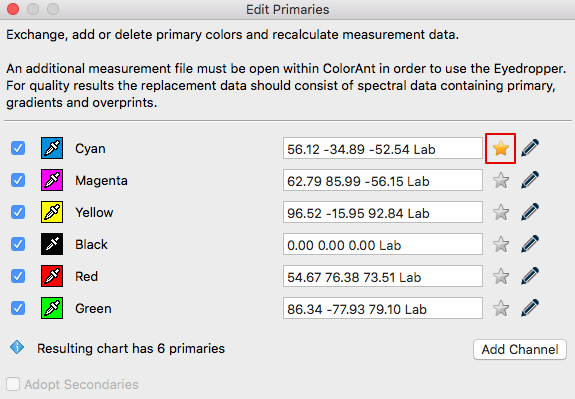
Star icon: A highlighted star symbol indicates that the imported measurement data is spectral data or contains a gradient.

Pencil icon: The Name of the primary color and/or its Density can be changed using the pencil icon. This allows density changes to be evaluated without having to print a new profiling chart, for example in Flexo printing when a new anilox roll is to be used for a primary color, or in offset printing if the density of an ink is to be increased or decreased.
After entering the new value for the density, corresponding Lab values are calculated and applied. The calculation is based on the spectral information of the primaries. Hence the density option is only available for spectral measurement data.

The value under Density indicates the current density taken from the measurement data. Enter the new density value and click on the triangular Arrow to apply the changes.

The Lab values are automatically calculated and displayed immediately. Clicking on OK accepts these values and closes the window.
The calculation can be aborted by clicking Cancel or reverted by clicking the Undo arrow to restore the original values.
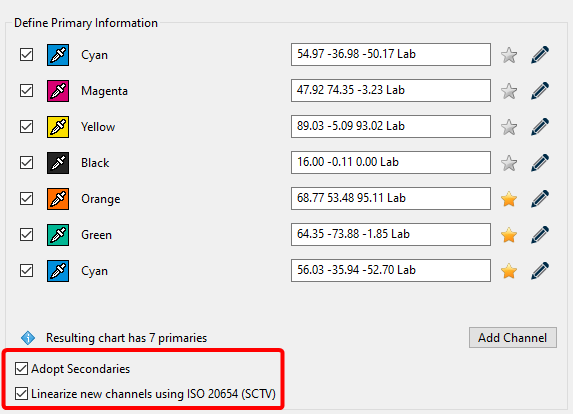
Adopt Secondaries: Allows secondary color values to be used additionally.

The checkbox is only available if secondary colors are present for at least two of the selected colors of a measurement file. At least one 100/100 color patch for the selected color must be present for the checkbox to be activated. In addition, other two-color combinations are considered as well (this can be any combination, such as 50/50 or 30/70 or 80/60 or any other combination of secondary colors).
The Lab values (or spectral values, if available) are then retrieved from the measurement file and entered into the spectral model. By supporting any existing printed secondary combination besides 100/100, the calculations are more precise.
Note: If a file contains the 50/50 patch but not the 100/100 patch, the file does have a secondary patch indeed, but the model still requires the 100/100 key point to function correctly.
When the mouse pointer is moved over the Adopt Secondaries function, a tool tip indicates the selected overprints and the associated data sets.

The option can be disabled if the measurement overprints are not suitable for the given data, in which case Edit Primaries will calculate the overprints itself.
Using color overprints can improve the accuracy of the rendering and calculation of the spectral color model.
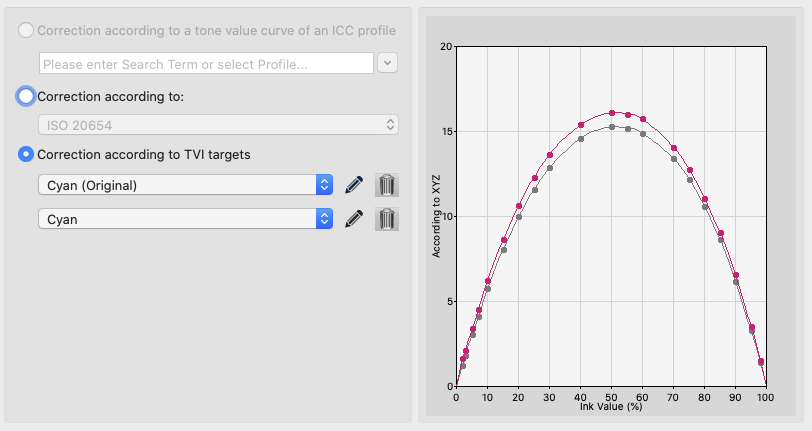
Linearize new channels using ISO 20654 (SCTV): The checkbox becomes available when a new channel is added, or if reference data without measurement data are loaded. When checked the gradients of the newly added channels are linearized according to the ISO 20654 (SCTV) standard. If channels of another data set are selected and the checkbox is selected, all channels are linearized according to ISO 20654 (SCTV). Otherwise, the original gradations of the loaded colors will be used.

Search: Allows searching for specific colors in large color libraries such as Pantone®. It is available in the context menu by clicking the eyedropper when replacing a color.

Restore last edits: Use this function to exit the tool without losing any of the changes already made.

Click Cancel. ColorAnt will remember the edits made up to this point, and leave the Edit primaries tool. Restore these edits after you return by clicking the Restore button. You can now continue your work where you left off.
Example: If it becomes apparent after a few editing steps that a required file has not been loaded in ColorAnt, the tool can be closed, and the missing file can be loaded. Then return to Edit Primaries and click on Restore. All previously loaded data will be loaded without having to perform these editing steps again.
Exchange of Primary Colors in existing Characterization Data
One of the main features of Edit Primaries is the exchange of primary colors creating a new set of characterization data.
Procedure:
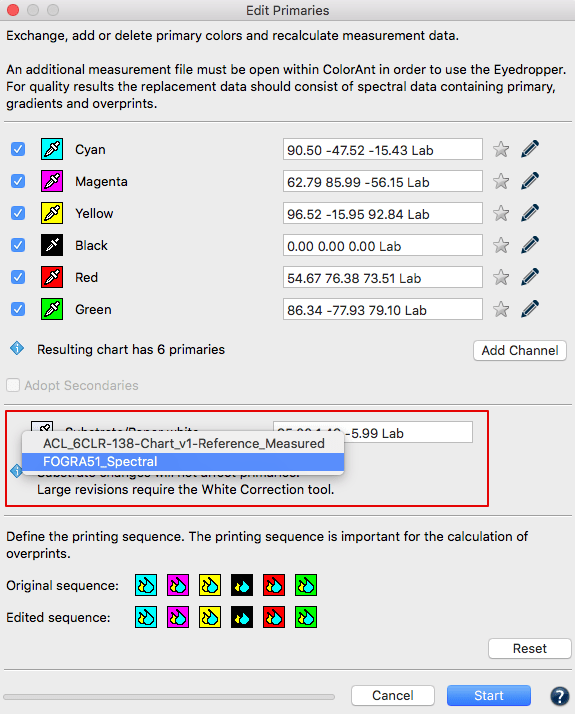
- Load the measurement data of the test chart to be edited in ColorAnt, then load the data set containing the measured new primaries, including gradations of the primaries and overprint information.
A sample of a reference file for CMYK plus one spot color is included with ColorAnt. The wedge Spotcolor-CMYK+X-v1.txt (shown as Red spot color in the screenshot) is located under File/Open Predefined. Use the tool Export Chart to generate a printable wedge. - Click on the measurement data to be edited (to select it) and click on Edit Primaries.

- Exchanging a primary: Click on the eyedropper icon of the color to be exchanged (see screenshot demonstrating an exchange of Yellow).
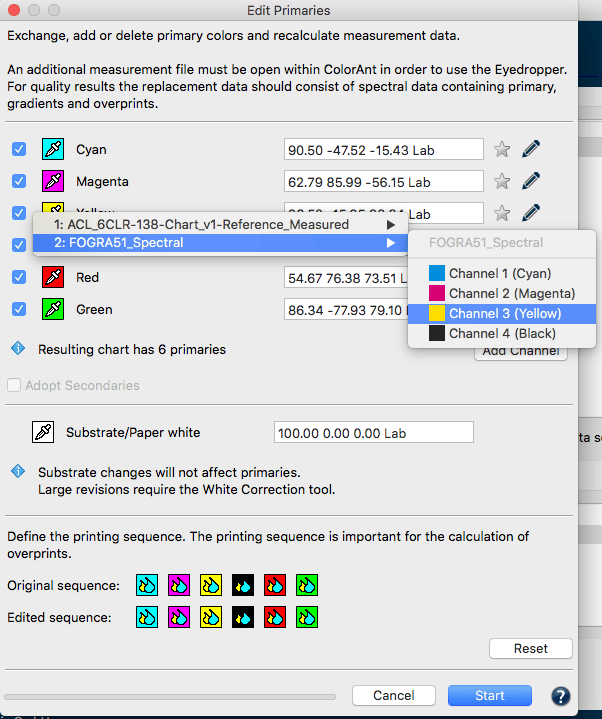
- Select the new primary from the second data set loaded in ColorAnt. To do so, click on the channel containing the new primary. Selecting a color from another channel of the same data set is also possible. In Edit Primaries the Lab value of the new primary will be shown allowing you to check immediately if the changes have taken place. If the imported measurement data are spectral data the star will be highlighted.
- If two or more primaries are added from a single data set containing overprints of these primaries, then these measurements can be used by ColorAnt and the checkbox Adopt Secondaries will be enabled.
Note: Adopt Secondaries is only enabled if secondary colors are available in the selected data set. When moving the mouse over the text a tooltip will show the selected color combinations and the associated data sets. - If no measurement data of the new primary is available, Lab values can be entered in the numbers box (however, calculations will not be as exact as with spectral measurement data). This will be visualized by a gray star icon.
- When complete click Start and the data will be modified and shown in the Data Sets section of ColorAnt. Save the new data with File/Save as to be used for other tasks, for example, creation of ICC profiles with ColorLogic CoPrA.
- To check the exchange of primaries, use the Compare tool to verify the data.
Specifics
- If a solid color is used to replace a primary color but does not contain any gradation values, ColorAnt uses the gradation behavior of the original primary color.
- Edit Primaries dynamically selects the best patches from the data provided. The more complete the data (spectral data is preferred) the more accurate the results. The exchange of primaries will improve when providing gradations of the primary color and overprint information, such as the primary with black overprints or secondaries.
Simulating Density Changes
The Density of primary colors can be changed using the Pencil icon. This allows density changes to be evaluated without having to print a new profiling chart, for example in Flexo printing when a new anilox roll is to be used for a primary color, or in offset printing if the density of an ink is to be increased or decreased.
After entering the new value for the density, corresponding Lab values are calculated and applied. The calculation is based on the spectral information of the primaries. Hence the density option is only available for spectral measurement data.
The value under Density indicates the current density taken from the measurement data. Enter the new density value and click on the triangular Arrow to apply the changes.
The Lab values are automatically calculated and displayed immediately. Clicking on OK accepts these values and closes the window.
The calculation can be aborted by clicking Cancel or reverted by clicking the Undo arrow to restore the original values.
Adding additional Color Channels to existing Characterization Data
Note: To add channels a ColorAnt L license is required.
Procedure:
- Load the test chart measurement data to be edited and load the secondary file with the measured primaries, gradation and overprint information into ColorAnt.
- Select the measurement data to be edited and click Edit Primaries.
- Click on Add Channel. A new channel with default gray Lab values and the channel name Auto is added.
Note: The Auto entry will take the channel name from the second data set. - Click on the eyedropper icon of the new channel and select the new primary from the second data set. Click on the desired channel to import its data.
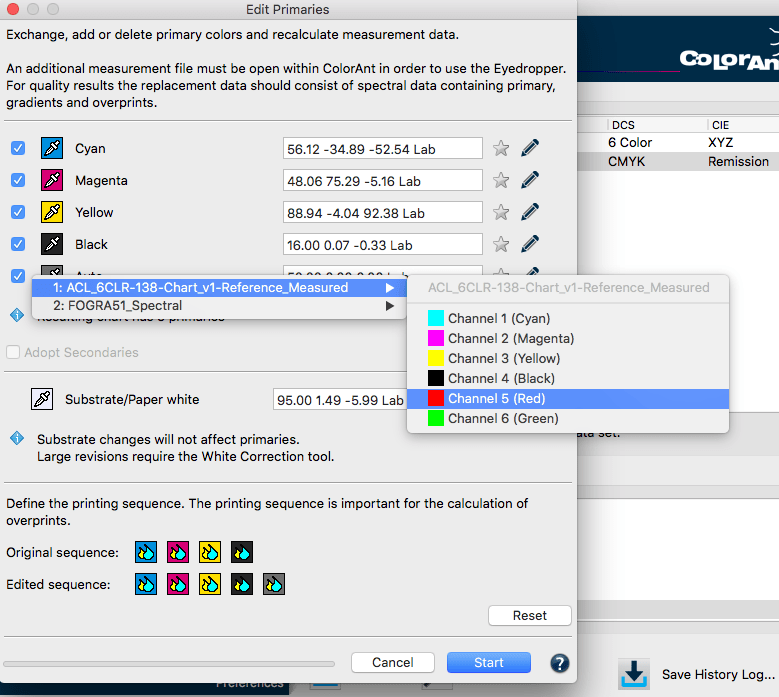
Example of a 5th color (Red) being added to an original CMYK data set.
- To rename the channel click on the pencil icon and enter the desired name in the appearing window Edit Primary Name.
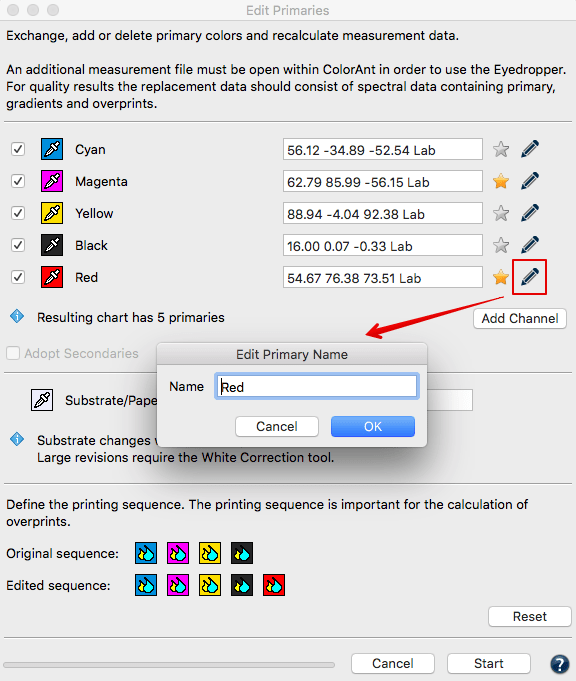
Important: Define the Original Printing Sequence and the Edited Sequence. This is especially important when a new ink is added as it can be added as the last ink or placed in between other primaries. - If two or more primaries are added from a single data set containing overprints of these primaries, then these measurements can be used by ColorAnt and the checkbox Adopt Secondaries will be enabled.
Notes: Adopt Secondaries is only enabled if secondary colors are available in the selected data set. When moving the mouse over the text a tooltip will show the selected color combinations and the associated data sets.
If no overprints are available in the loaded dataset, all overprints including secondary colors are still calculated using ColorLogic’s spectral overprint model. The Adopt Secondaries function, on the other hand, uses the existing data from the dataset and scales the spectral prediction to match the existing Secondaries data, resulting in slightly better matches of the loaded data. - Click Start to generate the new data set with the added channel. Save this file under File/Save as for further usage, for example to create ICC printer profiles in CoPrA.
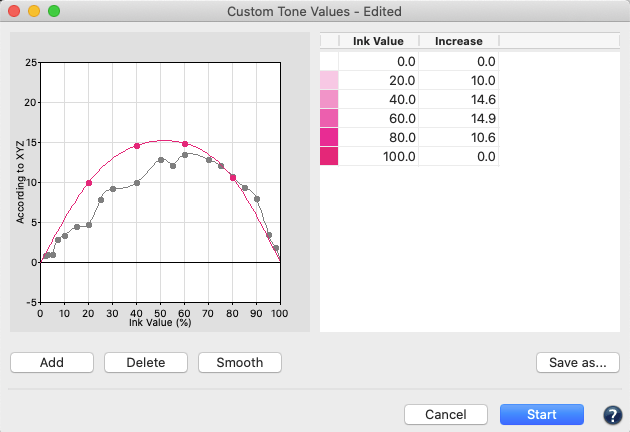
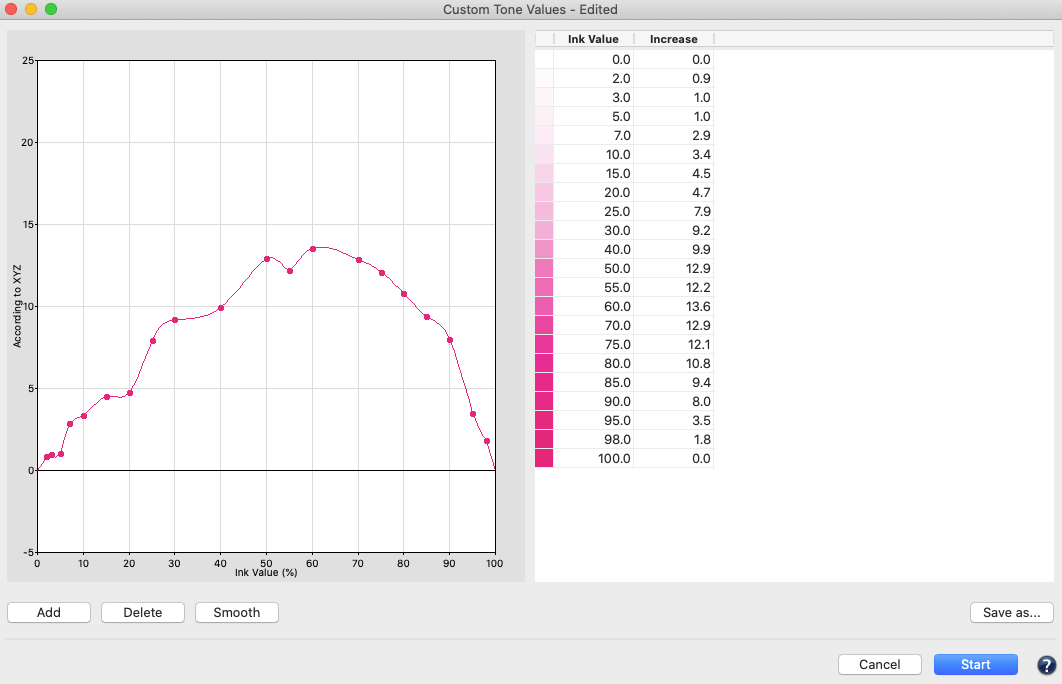
- To examine the new data set, use the View tool and select the tabs 2D, 3D, SpiderWeb and TVI to check that all colors including overprints have been added correctly. The TVI curves of the 5th channel can be edited further by using the Tone value tool and/or other tools like Smoothing. Finally, CoPrA can be used to build a 5 channel printer profile.
Adopt Secondaries: Allows secondary color values to be used additionally. The option is only enabled if secondary colors are available in the picked data set and at least two colors are exchanged. A tool tip indicates the selected overprints and the associated data sets. The option can be disabled if the measurement overprints are not suitable for the given data, in which case Edit Primaries will calculate the overprints itself.
Using color overprints can improve the accuracy of the rendering and calculation of the spectral color model.
Linearize new channels using ISO 20654 (SCTV): This function allows the gradients of newly added channels to be linearized according to the ISO 20654 (SCTV) standard. The checkbox is available when a new channel is added, or when reference data are loaded without measurement data. If channels of another data set are selected and the checkbox is activated, all new channels are linearized according to ISO 20654 (SCTV). Otherwise the original gradations of the loaded colors will be used.
Remove Color Channels from Characterization Data to Save Inks in Printing
Note: A ColorAnt L license is required to remove channels.
- Load and select the measurement data of a test chart and click Edit Primaries.
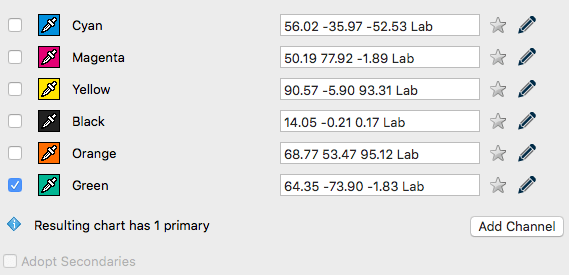
- Disable the checkboxes in front of the channels that need to be deleted and click Start. The information area of the Edit Primaries tool displays the channels of the resulting data set.
- The new data set will be reduced to the channels that have been enabled. Please be aware that this is a Multicolor file and may only be used in ColorLogic CoPrA if a Multicolor license is loaded.
Note: Edit Primaries can be used to extract individual channels from complete test chart measurement data by removing all other channels. Just leave the checkbox of the desired channel activated and deactivate the checkboxes of all other channels.
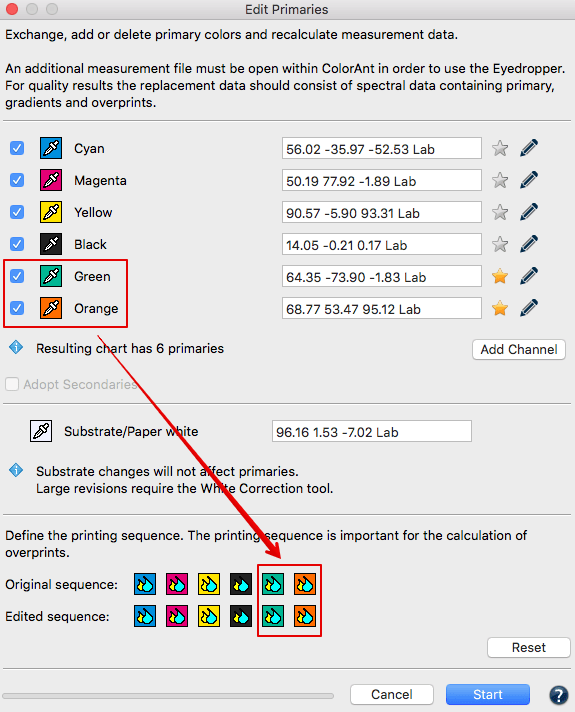
Change inappropriate Color Channel Order to optimize Characterization Data and Profiles
The channel order can be changed within a file without changing the measurement data itself. For example, if you have added the additional channels Orange and Green to a CMYK data set you can change the order to CMYK+Green+Orange afterwards.
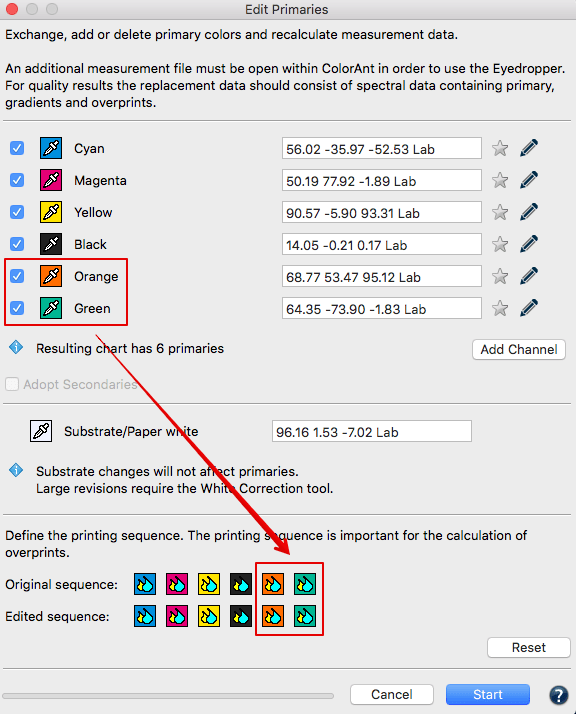
Simply click on the eyedropper icon and select Orange for Green and Green for Orange from the same measurement data file. This will change the channel order without changing the measurement data. If only the channel order has been changed, this is indicated by the name ChannelOrder in the file name.
Note: The channel reordering feature in Edit Primaries and the Link tool Merge by Channel Name can be used to prepare Multicolor measurement data from different origins. For example it allows to combine the four separate 4 color Esko Equinox files to a 7 color Multicolor data set to be used for profiling in CoPrA.
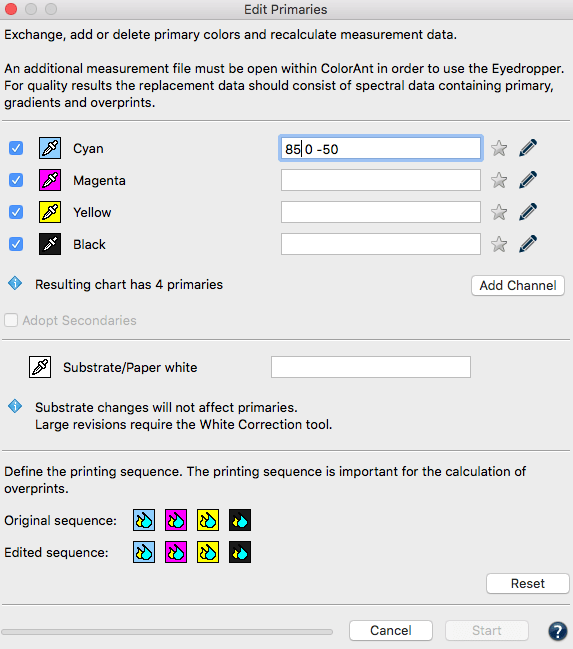
Creating new characterization data on existing wedges
The Edit Primaries tool allows the assignment of new color values to device values (DCS values) which do not already contain color values. Thus, new characterization data can be created based on CxF/X-4 data, existing wedges of primaries, the input of Lab values or other characterization data sets without the need to reprint test charts.
Procedure:
- Open a reference file (for example IT8/7-4) and, if available, measurement wedges or existing characterization data of test charts containing the desired colors.
- Select the reference file, click on Edit Primaries and use the eyedropper tool to choose colors from the pool of measurement values.
- Alternatively, fill in the Lab value if there isn’t other data available. The best results are achieved using spectral values, wedges or information on overprints.
- If two or more primaries are added from a single data set containing overprints of these primaries, then these measurements can be used by ColorAnt and the checkbox Adopt Secondaries will be enabled.
Note: Adopt Secondaries is only enabled if secondary colors are available in the selected data set. When moving the mouse over the text a tooltip will show the selected color combinations and the associated data sets. - If measurement values are assigned to all primaries and the paper white, click Start.
Note:
- The integrated progress bar shows the status of the calculations. With complex mathematical calculations, especially with large test charts and many channels, you are always informed how long these can still last.
- When extracting measurement data containing overprint information with black from CxF/X-4 files (so-called full characterisation), you should note that no black gradient is stored in CxF/X-4 files. If you want to edit a black channel with gradient in Edit Primaries, you should use the black gradient from another measurement file and not from the CxF/X-4 file.
Changing the Substrate/Paper White
Minor changes in paper color do not affect the full tone of the primary colors. In this case, the paper color can be replaced with a similar paper color of an existing dataset.
However, significant changes in paper white affect the entire color space. Major changes in paper white also have a strong effect on the primary colors.
If the white point changes significantly, it can be (re-)measured directly from within the Edit Primaries tool. This measurement data can then be used to correct the white point of the selected dataset. The corrected white point is then applied to the entire measurement data keeping the print characteristic intact. (see instructions below).
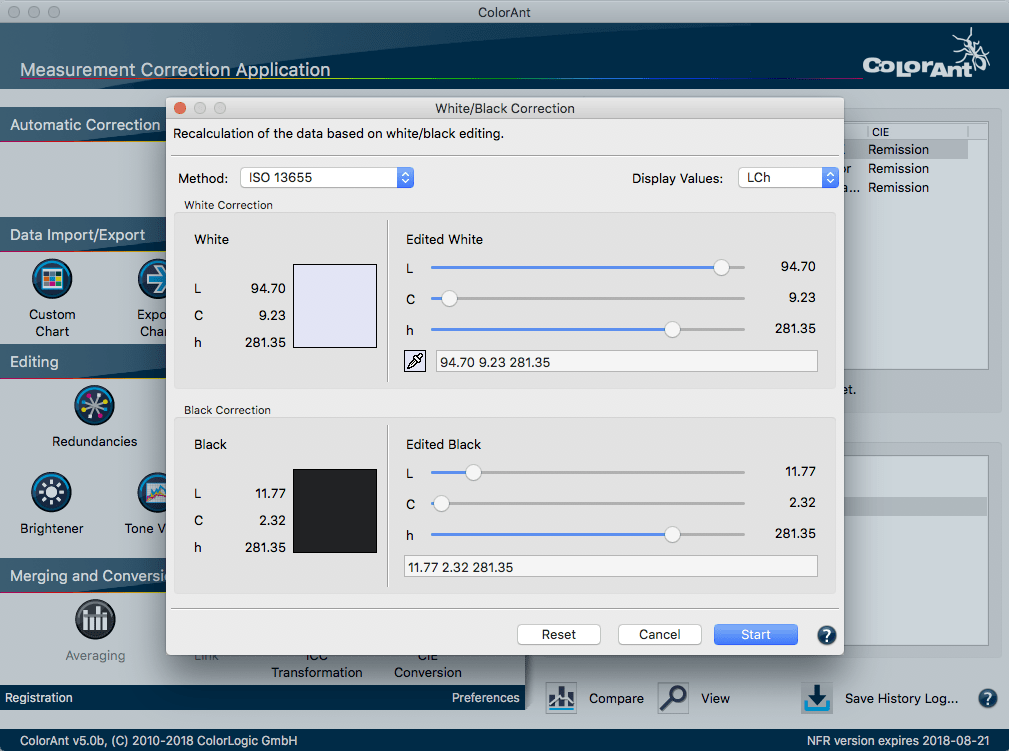
Note: If you just want to change the white point use our dedicated White/Black Correction tool.
Replacing the paper color with data from an existing dataset
- Load the test chart measurement data and load the secondary file containing information of the measured paper white into ColorAnt.
- Select the measurement data of the data to be edited and click Edit Primary.
- Click on the eyedropper icon of the Substrate/Paper white and select the new paper white from the second data set. Click on the name of the data set to import the data.
- Alternatively, if no measurement file of the new paper white is available, the new values can be entered in the number field as Lab values. However, this is not as precise as working with spectral data.
- Click Start and the data set will be modified. The modified measurement data can be found under Data Sets. Save this file under File/Save as for further usage, e.g., creation of ICC printer profiles with CoPrA.
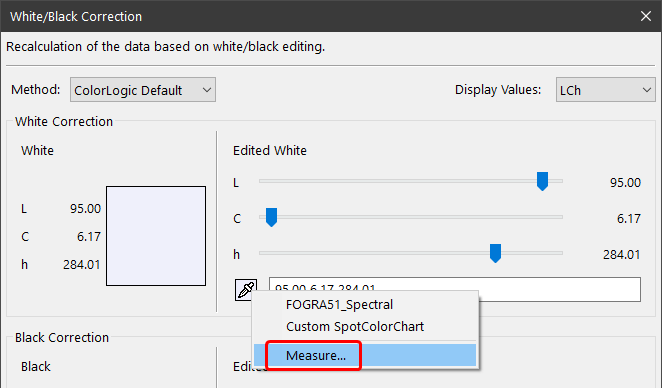
Direct measurement of the white point
Proceed as follows to measure and adjust the white point:
- Load the measurement data to be corrected and open the Edit Primaries tool.
- Click on the eyedropper icon and select the option Measure.
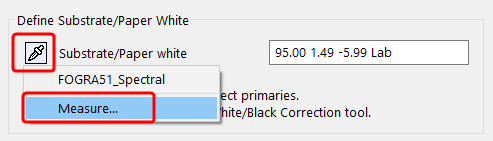
- The Measure Tool opens with the preselected chart for measuring the paper white with a single patch.
- After the measurement, the new white point data is transmitted back to the Edit Primaries tool and is applied to the entire measurement data keeping the print characteristic intact.
Note: The white point measurement is also listed under Data Sets.
Simulating the Differences in Color and Gamut Size when the Print Order is Changed
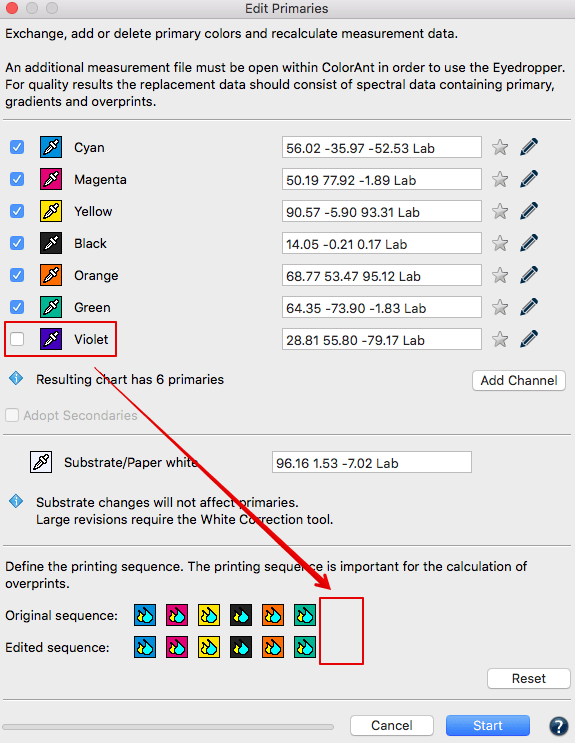
The Printing Sequence defines the order in which the colors are printed on top of each other and can be set independently of the channel sequence. When primary colors are exchanged or added, overprinting colors can be correctly calculated by specifying the correct printing order. By changing the print sequence, you can also check whether a changed sequence increases or decreases the gamut.
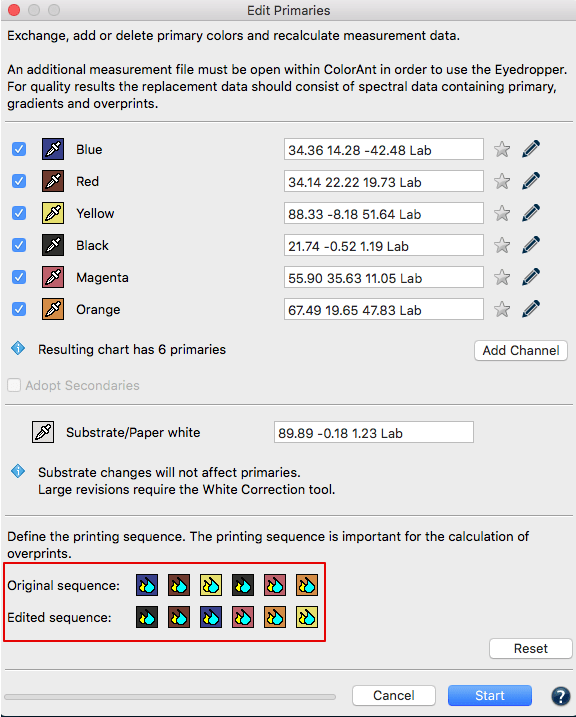
The printing sequence can be changed by dragging and dropping color symbols
Example: There is a difference in color when a red is printed on a yellow or vice versa. Users can set the print order independently of the channel order so that the channel order is maintained, for example as CMYK, even if the print order is KCMY.
Procedure:
- Load a measurement file under Data sets, preferably with spectral data, and open Edit Primaries.
- The initial print order, represented as the Original Sequence, of a loaded data set corresponds to the channel order. Change the Original Sequence by clicking on a colored icon and moving it to the desired position.
Example flexo printing: The colours are usually printed from dark to light, whereas the channel sequence implies a different arrangement.
Note: When an edited data set is reopened, the Original Sequence reflects what has been done and saved the last time. - Edited Sequence specifies the order of the colors in which they are to be printed.
Note: If you do not need to change the print order, make sure that the edited order is the same as the original order. - After you are done click Start and the data set will be modified. The modified measurement data can be found under Data Sets.
- Save this file under File/ Save as for further usage, e.g. creation of ICC printer profiles with CoPrA.