

Preferences
Use the ColorAnt Preferences to define the general behavior of the application.
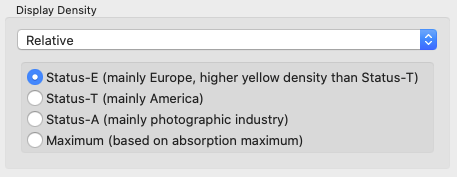
Display Density
Defines the method for calculating and displaying densities in View and Report.
Select whether the Relative or the Absolute density is to be displayed and which of the four methods is to be used for the calculation:
- Status-E: The default setting for CMYK data, mainly used in Europe.
- Status-T: Mainly used in America for CMYK data, with slightly lower yellow density values.
- Status-A: Used in the photographic industry. Use it with RGB printing systems.
- Maximum: For Multicolor/spot color measurement data. Automatically uses the maximum absorption of the spectral values to calculate the density instead of the specified CMY filters.
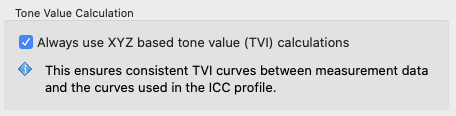
Tone Value Calculation
Changes the calculation and display of the TVI curves in the View dialog.
The default setting in ColorAnt will calculate the TVI curves based on XYZ values. This mode ensures consistent views of TVI curves between measurement data and the same curves derived from ICC profiles. ICC profiles use colorimetric data. When spectral measurement data is present and the checkbox is disabled in Preferences, the TVI curves are based on density and the selected density mode is used for the calculation of the curves. This method is more consistent with the one used in print process control. Keep in mind that both the XYZ and the density method are not good indications for how TVI curves of spot colors actually look as these methods do not work well for non CMYK colors. Refer to the Curves View dialog instead to see curves according to colorimetric linearity or ISO 20654 (also known as SCTV).
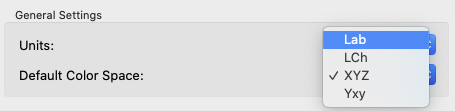
General Settings
Units: Defines the measurement units used (mm or inches) in the Export Chart dialog.
Default Color Space: Defines the color space for the 2D and 3D view of the View tool. Available color spaces are Lab, LCh, YXZ and Yxy.
3D Gamut Axes Ratio (L:a:b): The default 3D gamut view uses an 1:1:1 axes ratio of the Lab axes (L:a:b). Alternatively, the axis ratio of 2:1:1 used in ColorAnt 8 and older can be selected.
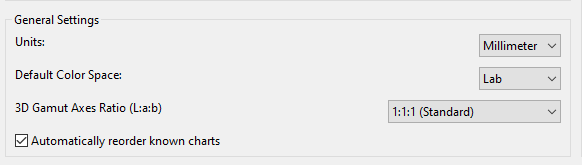
Automatically reorder known charts: Enables the automatic rearrangement of color patches of randomized test charts according to the known default layout (see screenshot), i.e., it can be specified whether the existing randomized layout should be kept when loading the chart or whether the color patches should be rearranged automatically.
Note: The state of the checkbox can be switched by holding the Alt key when dragging and dropping files into ColorAnt.
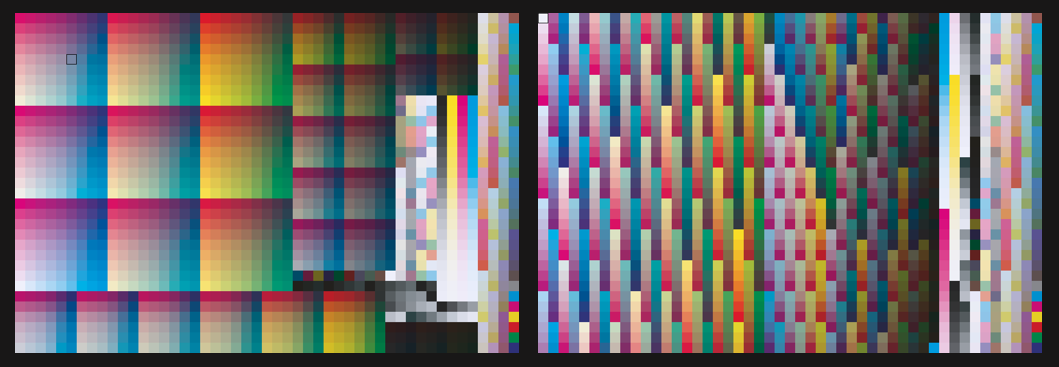
Left chart: With automatic reordering
Right chart: Without automatic reordering
Test chart: IT8.7-4
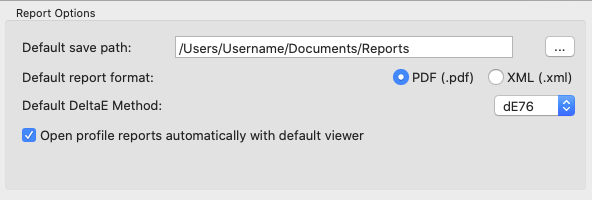
Report Options
Default save path: Reports (in PDF, XML and XSD format) are automatically saved in the folder specified here.
Default report format: Select the preferred file format for the report, either PDF or XML. If XML is selected as the format, the corresponding XSD files will be created automatically as well.
Default DeltaE Method: Define the DeltaE method to be used in reports, either dE76 or dE2000.
Open profile reports automatically with default viewer: Define whether the report should be automatically opened in the standard PDF viewer after creation.
Report Customization
The report Title and the report Logo for measurement data reports can be customized individually for all report types. Select the report type from the drop-down menu and set the desired Titel and Logo for each of the available reports.
Remaining number of characters: Shows the number of remaining characters for the report title. The report title can contain a maximum of 50 characters.
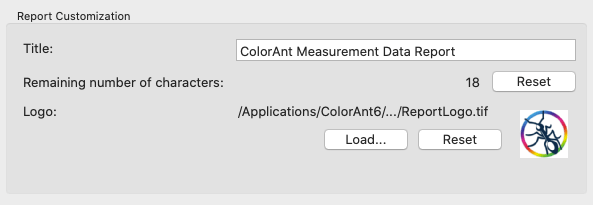
Supported image formats for the Logo are TIFF, JPEG or GIF in RGB color space.