
Iterate
Overview
An existing DeviceLink profile can be optimized based on measured color values by using a test chart of your choice (can be created with ColorAnt/Custom Chart, see video turorial below). The iterationtest chart needs to be converted from source to target profile using the original DeviceLink profile and printed on the target printer. The measured color values of the printed test chart are then used to improve the conversion in order to achieve lower color differences and a more accurate reproduction of the source color space. Based on the measured values, it is automatically determined whether the target values are reached (which are determined by the source and target profiles) and a correction is made for deviations. Iteration is therefore particularly useful in proofing situations with absolute or relative colorimetric rendering intents. Perceptive rendering intents can also be used as a special feature of DeviceLink iteration in CoPrA. The iteration calculates a new DeviceLink profile based on the original DeviceLink profile and the measured values. The new profile can be reinserted for iteration until the desired result is achieved.
Iteration for Proofing and Production Printing
Iteration is a great method to get the best possible match for proofing. Proofing uses absolute colorimetric rendering without color exceptions. However, in digital production printing, perceptual rendering methods and color exceptions are used to keep colors pure. Nevertheless, there might be an interest to optimize the colors by iteration measurements (Note: It is not always recommended to do so, especially as out-of-gamut colors cannot be optimized).
Using the Iterate tool, it is possible to iterate data for production printing while retaining exceptions during the iteration process. CoPrA recognizes exceptions and rendering settings from the selected reference DeviceLink profile and retains them (only if the selected DeviceLink is a ColorLogic profile). A checkbox is shown when exceptions are used. By default, the checkbox is enabled.
Notes:
- Iterate requires a DeviceLink license.
- The test chart must match the color space of the source profile.
- Out-of-gamut colors of the original color space can only be improved to a limited extent.
- In proofing situations, the gamut of the target color space ought to be larger than that of the source color space, which makes iteration particularly interesting for DeviceLink profiles in proofing applications.
- Iterations cannot be repeated arbitrarily due to fluctuations in print output, print material and the reproducibility of measuring instruments. More than 2-3 iterations are usually not necessary and not recommended.
- Only DeviceLink profiles whose source and target profiles are available and referenced in the DeviceLink profile can be iterated. A warning is issued if the required source and target profiles are missing.
- Third-party DeviceLinks that reference the used source and target profiles can also be iterated.
- DeviceLinks that use color Exceptions and perceptual rendering options (such as conversion and separation profiles) can be iterated as well, but it should be done with care and it can only be done for ColorLogic DeviceLink profiles.
Iteration allows the target values to be reached more accurately, which can result in a loss of channel purity if no exception settings are retained. Perceptive rendering intents require an interpretation of the measurement data, which can lead to slight shifts during iteration. - With a DeviceLink and a Multicolor license Multicolor DeviceLinks can be iterated, too.
Procedure
Procedure
Procedure
- Select Iterate in the sidebar or DeviceLink Iteration in the Navigation menu.
- Select the DeviceLink profile that you would like to iterate from the drop-down menu. Make sure that both the source and target profiles used in the DeviceLink are available in the ICC profile folder of your operating system, as CoPrA needs those to calculate the iterated profile.
- Convert the test chart to be used for iteration with the DeviceLink profile and print it on the printer using the same settings as for the profiling test chart for this printer. The test chart can be converted using CoPrA’s Image Conversion tool.
Note: Use a test chart that contains the colors you would like to optimize. Typically, test charts with few color patches will suffice, but those patches must reflect the colors to be optimized. Therefore, using large profiling test charts is not required. Instead of using large test charts, use charts that can also be used to update profiles (see ColorAnt/Custom Chart tool). The color space of the test chart must correspond to the color space of the source profile of the DeviceLink. - Measure the printed test chart in ColorAnt, save the measurement data and open it in CoPrA’s Iterate tool, either via drag-and-drop or via the Load button. Alternatively, click Measure and measure the test chart with CoPrA’s integrated Measure Tool.
- Depending on the selected DeviceLink profile and its settings, the checkbox Use same Settings from DeviceLink including exceptions will be activated or grayed out. It is activated for ColorLogic DeviceLink profiles that use Exceptions. If the DeviceLink is not a CoPrA profile or if it does not use exceptions, – which should be the default setting for proofing, – the checkbox is grayed out.
Note: If the checkbox Use same Settings from DeviceLink including exceptions is deactivated, then all Exceptions are deactivated in the iterated DeviceLink profile. - If you disable the checkbox Use same Settings from DeviceLink including exceptions, then all exceptions are disabled in the iterated DeviceLink profile.
- Click Next to get to the Save dialog Format, Size and Further processing.
Notes:
a) The Default Template uses an option to add the iteration count number to each iterated DeviceLink.
b) Size: It is recommended to select Auto because size matters for iteration. The Auto feature ensures that the highest precision is always used when creating the iterated DeviceLink.
c) The newly created DeviceLink will have a more accurate color rendering for most in-gamut colors compared to the original DeviceLink profile. You can now use it in exactly the same way as the original one or use it for further iterations.. - If you would like to further optimize the DeviceLink, proceed as described above. However, select the previously iterated DeviceLink instead of the original one. Now convert the original test chart with the iterated DeviceLink (do not take the already converted test chart from point 3!) and use the measurement data of this printout to calculate a further optimized DeviceLink profile.
Format, Size and Further Processing
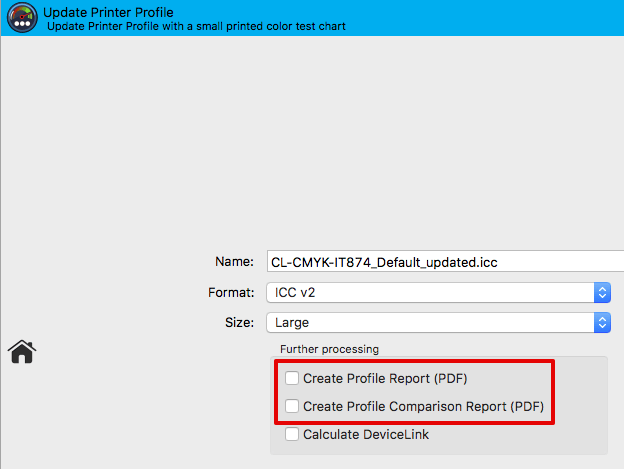
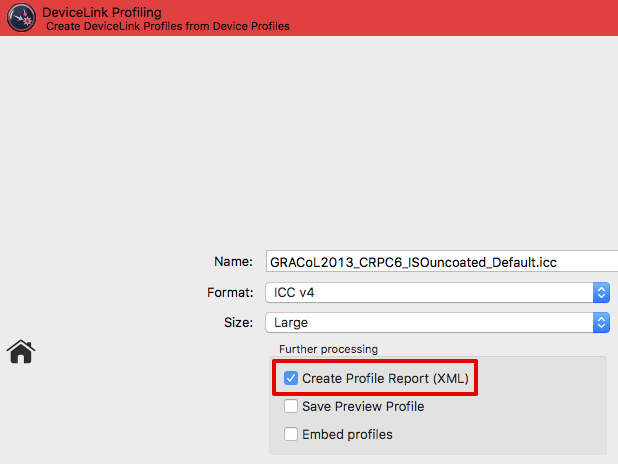
In the last step of profile creation, assign a Name and choose the Format and Size of the profile (see screenshot).
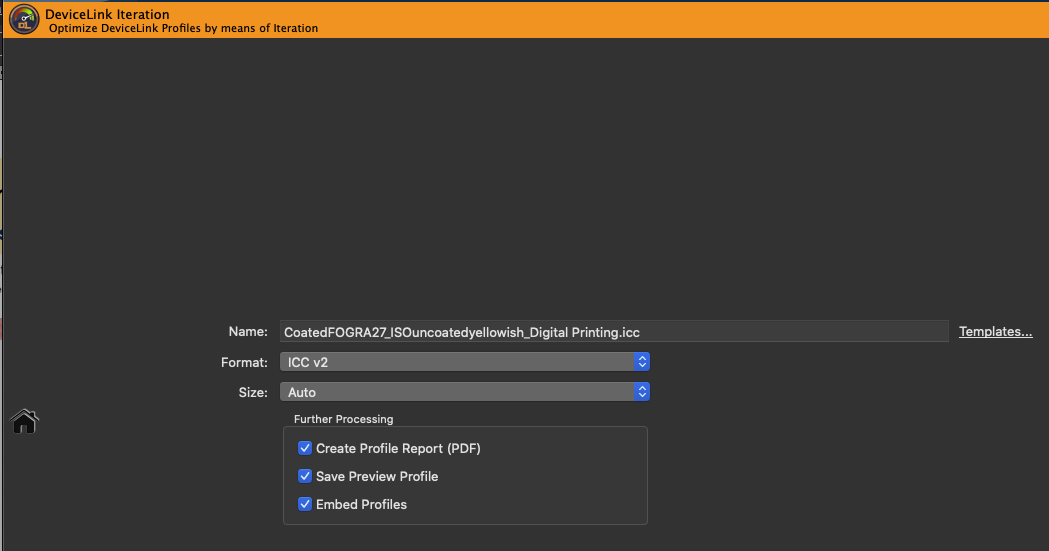
Name: Type in a Name for the profile.
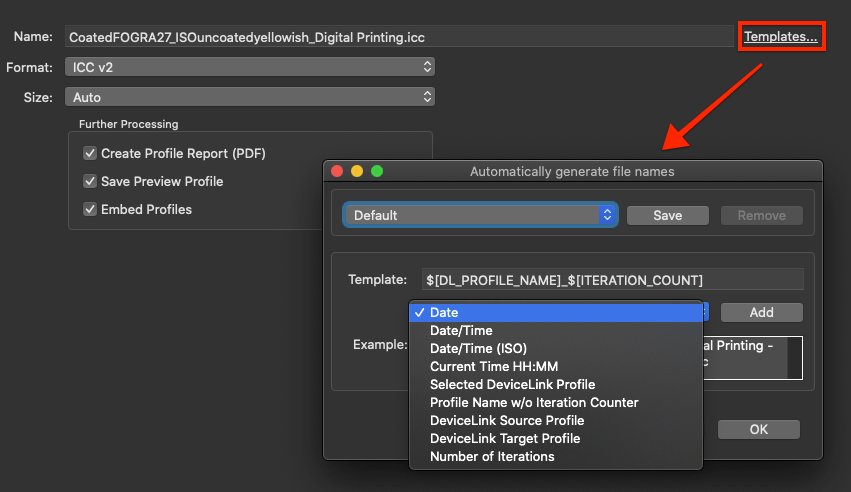
Templates: Allows to select and combine name components from a list of options and save them as custom templates. The last selected template is used when creating new profiles, so the naming of profiles is automated.
Available naming options depend on the current profile type and include Date, Date/Time, Measurement data file name, Source and Target profiles, Name of the current preset and others. Each name component can be added at a user-defined position under Template (the position is selected with the mouse pointer). The Example section below shows the resulting name. Additionally, user defined text can be added at any position within the Template field.
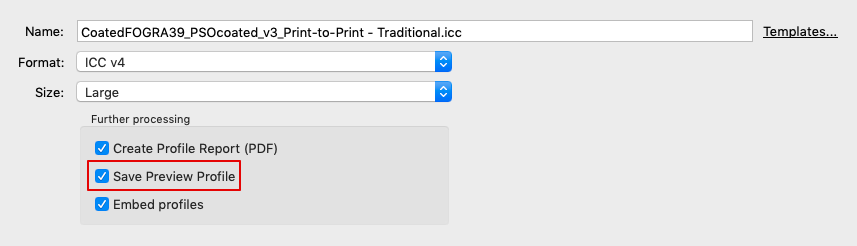
Format: Define the Format of your profile. An ICC format in accordance with specification v2 is recommended as a basic setting, however, the newer format ICC v4 can also be chosen. In this case, please ensure that your programs support this format.
Note: ColorLogic products handle and use ICC v4 profiles consistently and correctly.
Size: The setting Large is recommended. The size specifies the number of grid points in the profile and determines the amount of disk space required for the generated profile. Small profiles should only be used for test purposes. Very Large profiles can slow down further processing in subsequent programs. Additionally, some programs are not able to handle very large profiles.
Further processing
Create Profile Report: Recommended to activate. The PDF report provides an overview of the quality of the profile based on statistics, diagrams of gray balances, gradients and gamut representations as well as evaluation results and details of the DeviceLink iteration.
Under Preferences, the Default save path for the reports and the Default report format can be selected. If XML is selected as the format, the corresponding XSD files will be created automatically as well.
Save Preview Profile: Is only available in Multicolor printer profiling. By activating this checkbox an ICC preview profile will be created in addition to the printer profile. It can be used as a soft proof profile in Adobe Photoshop.
Notes: Preview profiles are only suitable for proofing purposes. Either a preview profile or a CMYK profile can be created in one profiling step, but not both.
Embed profiles: Physically incorporates the used source and target profiles into the DeviceLink. This function is tricky and only recommended if the DeviceLink has to be transferred to a computer which does not have the required source and target profiles. It was implemented mainly for use with certain RIPs which only accept DeviceLinks with embedded source and target profiles.
Save: Creates the printer profile and saves it in the folder Profiles (macOS) or Color (Windows), (macOS: /Users/Username/Library/ColorSync/Profiles, Windows: C:/Windows/System32/spool/drivers/color). Demo and encrypted profiles will be saved in a different location only relevant for ColorLogic applications.
Note: CoPrA-SP profiles are stored in the ColorLogic subfolder Licensed-Profiles.
Profile Reports
Profile reports can be created for Printer or DeviceLink profiles. To do so, activate the checkbox Create Profile Report in the last step of the profiling or, when updating profiles, the checkbox Create Profile Comparison Report.
Depending on the type of profile the report contains various statistical data, such as statistics about profile precision (Integrity, Precision, Black Point, White Point etc.), graphic representations of curves and gamuts (Gray Balance, Gradients etc.), conversions of test images, separations and color patches to evaluate the smoothness or the purity of colors. All this facilitates the detection of artifacts that may be present.
Profile reports can be created at any time in Batch Overview or in Profile Manager which, by the way, is not restricted to ColorLogic profiles.
Under Preferences you can define some basic settings for the creation of the profile report, such as the file location, the report format (PDF or XML) or the DeltaE method (dE76 or dE2000).
Note: If a profile comparison report is created when updating a profile, the measurement data obtained from the update test chart will be compared to the data of the original profile (reference profile).
If the checkboxes Brightener Compensation or Measurement Correction have been activated, the data of the original profile will not be compared to the measurement data from the update test chart but to the data modified by these options.
Verifying the optimization
Verifying the optimization
ColorAnt can be used to verify a successful optimization. First create a “Lab Reference” to compare the measured values of the printouts to the values of the DeviceLinks. Use the ICC Transformation tool to create the Lab reference values by using the device values of the original test chart and the source profile and rendering intent of the DeviceLink. These Lab reference values now serve as comparison values after each application of the iterated DeviceLinks on your test chart. Compare the measurements of the iteration with the “Lab Reference” using the Compare tool in ColorAnt.
You will notice that in-gamut colors of the iterated DeviceLink are closer to the Lab reference than those of the original DeviceLink.
Video Tutorial: How to create a test chart for iteration
Video Tutorial: How to iterate