ZePrA | Quick Start Guide EN

Profile assignments can customize ZePrA’s SmartLink function. Standard DeviceLinks, house standards, or custom profiles can be assigned to configurations automatically and used for conversions.
Create and manage profile assignments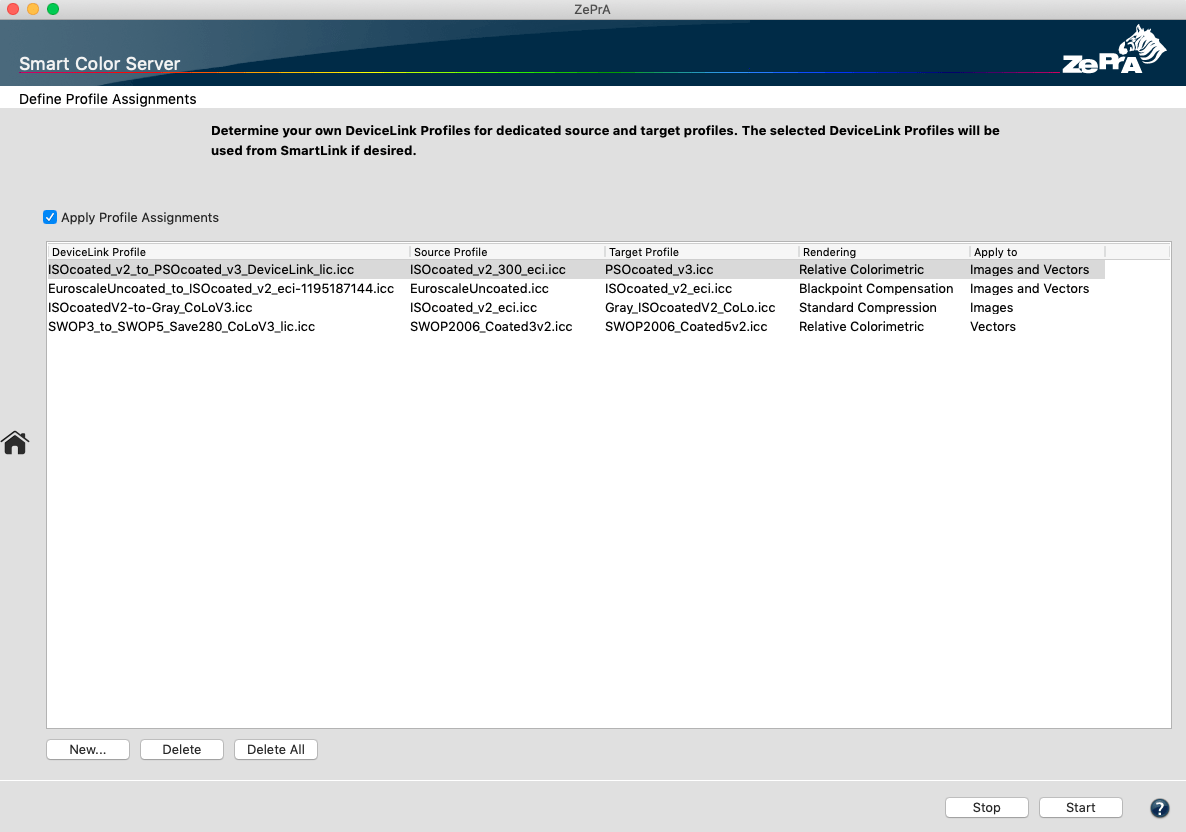
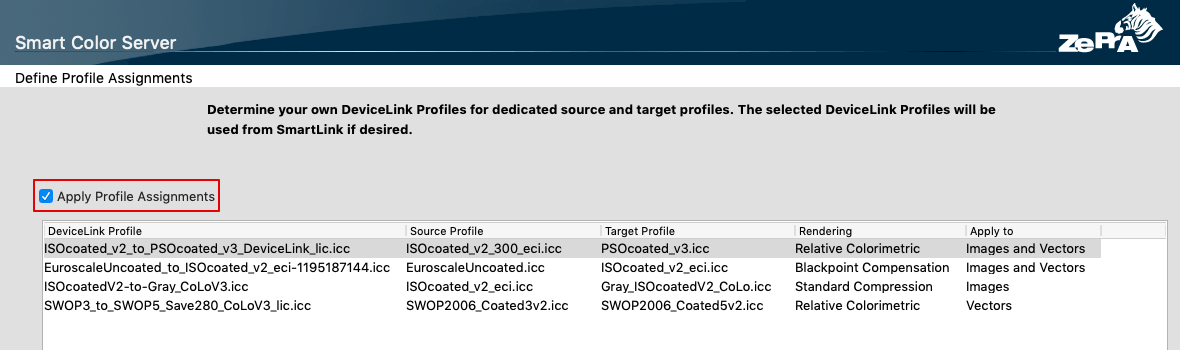
To create or edit SmartLink profile assignments, use existing Device Links or standard profiles.
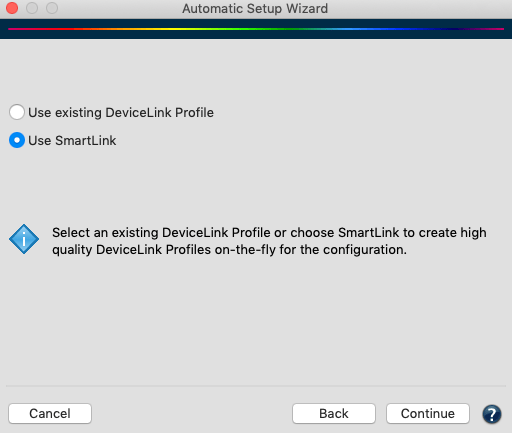
To add new profile assignments, click New at the bottom of the window and select the DeviceLink profile directly from the DeviceLink Profile drop-down menu.
To edit existing profile assignments, open the Edit Profile Assignment window by double-clicking the particular assignment.
Change profile assignment settings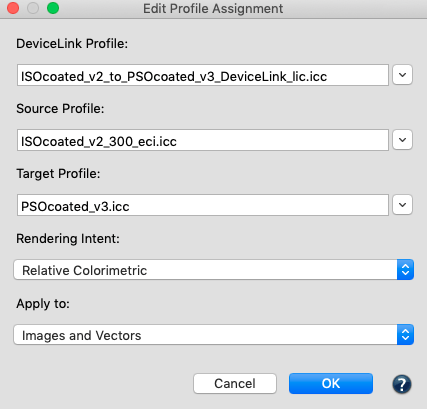
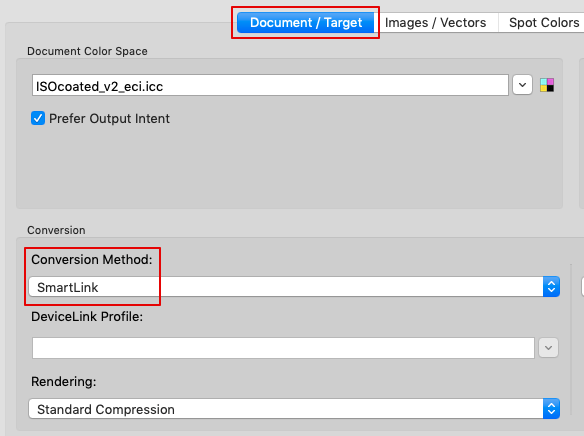
If the DeviceLink profile contains a PSID tag (e.g., ColorLogic profiles), the source and target profiles are automatically displayed in the Source and Target Profile drop-down menus. Alternatively, select a combination of Source and Target Profile and a Rendering Intent. The DeviceLink Profile matching this combination of color spaces can be selected from the drop-down menu.
To ensure that the selected DeviceLink profile is used, both the source and target profiles of the DeviceLink and the rendering intent must comply with the settings under Configurations. If the DeviceLink profile is to be a priority, regardless of the rendering intent selected under Configurations, then select the entry All in the Rendering Intent drop-down menu under Edit Profile Assignment. The DeviceLink will be used with all rendering intents.
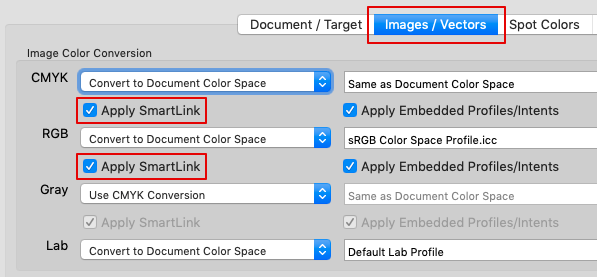
Apply to specifies whether a DeviceLink is to be applied to vectors and images, only to vectors, or only to images. This allows a vector DeviceLink profile to be selected for a color conversion (e.g., AdobeRGB to ISO Coated V2) that converts primary and secondary colors to 100% of the corresponding CMYK values, while a different DeviceLink can be selected for images for which such a conversion is not desired.
Delete removes individual profile assignments, Delete All removes all table entries.
Note: When jobs are being processed, ZePrA displays in the status bar of the jobs and queues Overview whether DeviceLink profiles are calculated via SmartLink in the background. In the Job Properties, you can also view the color spaces and whether a DeviceLink profile was derived from the Profile Assignments or whether SmartLink created it on-the-fly.

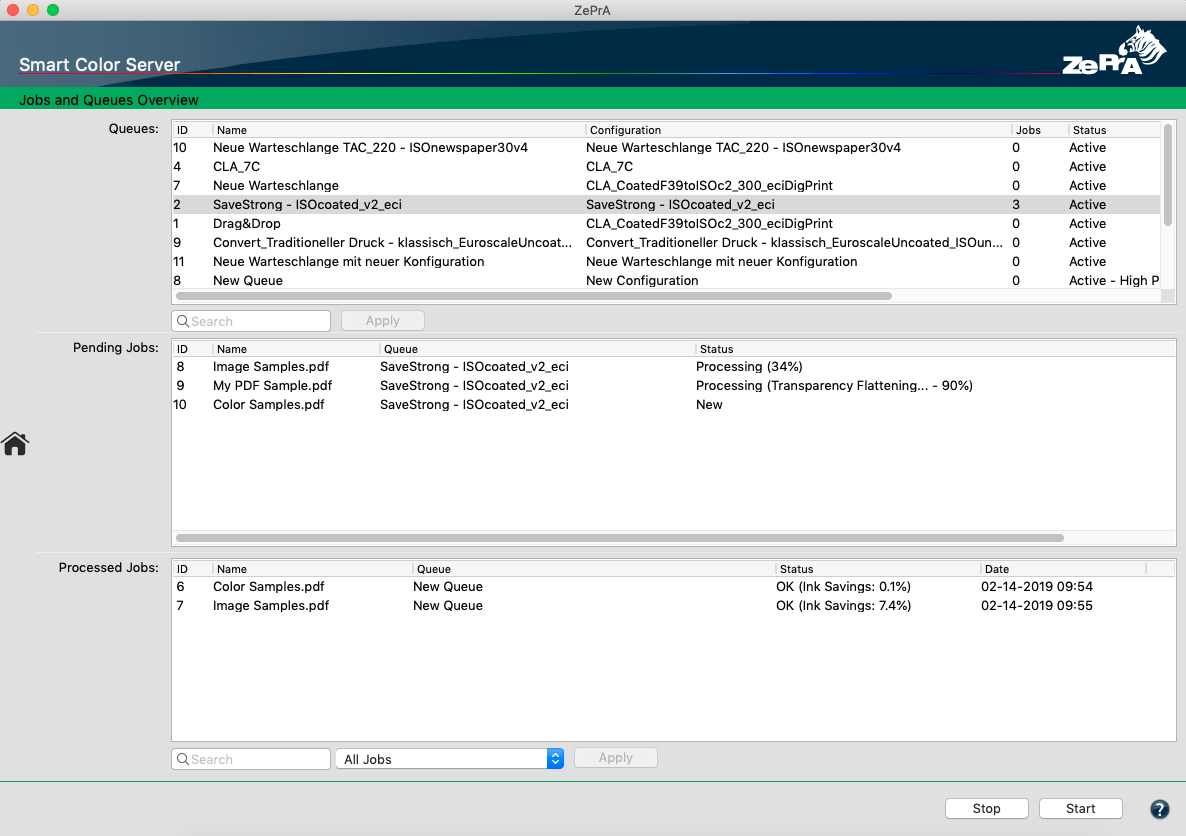
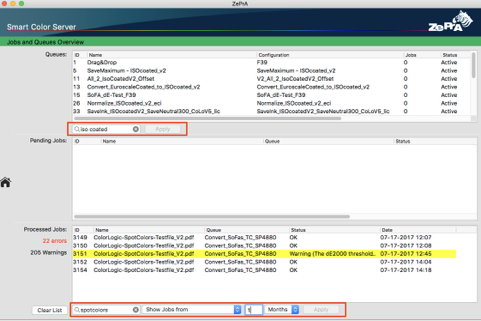
Jobs and Queues Overview
The Overview window is divided into three sections: Queues, Pending Jobs and Processed Jobs.
ZePrA Configurations are associated with queues, however, the queue and its configuration are managed separately. Configurations can be assigned to Queues or changed anytime. The configuration assigned to a queue is displayed in the Configuration column.
To quickly access a queue’s hot folder, right-click a queue and select Open Folder in the context menu.
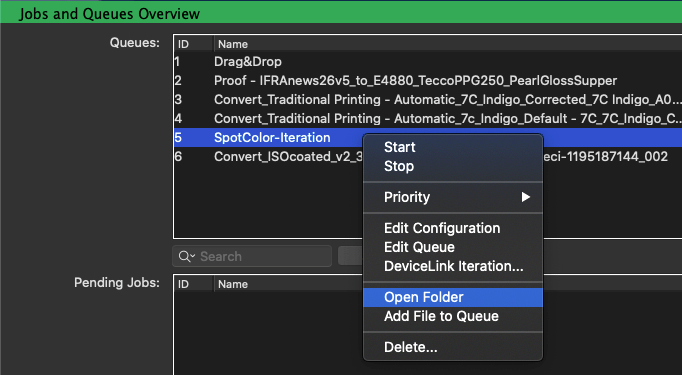
Stop or Start a queue via right clicking.
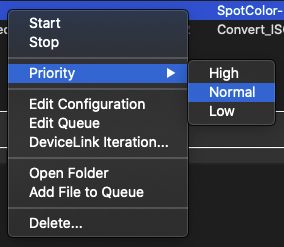
The priority order for queues can be controlled for file processing. Change the Priority of any queue by right-clicking on the queue to change the default setting Normal to High or Low.
Queues that are inactive or invalid are highlighted in orange. Incorrectly configured queues may be highlighted due to incomplete entries or missing profiles.

The job lists in the lower panes of the window show which jobs are still pending and which have been processed.
If errors occur when processing files, or if ZePrA detects non-supported file types, they are highlighted in red in the list Processed Jobs. If warnings occur during processing, file processing continues and the job is highlighted in yellow and labeled with a warning. Warnings show what action to take.
The Queues list can be sorted by ID, file Name, Configuration, Jobs and Status. Clicking on the ID column places the most recently processed job at the top, while clicking on the Status column sorts the files according to their Priority.
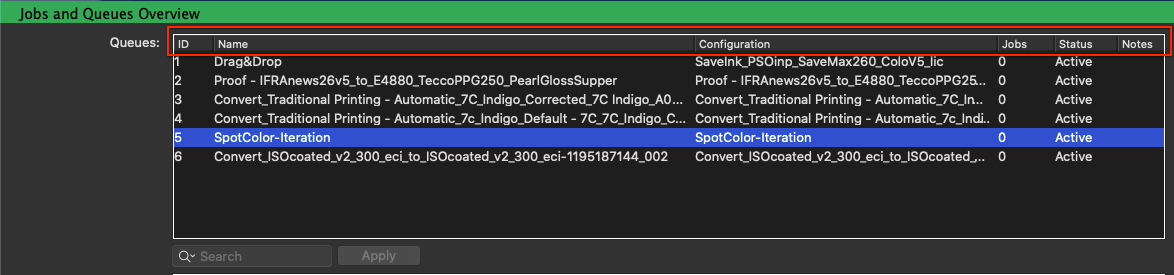
The Notes entered in the Configurations and Queues dialogs are displayed in ZePrA’s main window in the Queues list. The Notes column allows to quickly find queues based on cleverly selected keywords, such as customers, printers, media types, or other special properties.
Processing of queues can be started or stopped with the Start and Stop buttons on the bottom right of the window. The buttons are grayed out appropriately based on the queues status being active or inactive, e.g. they are grayed out for inactive queues.
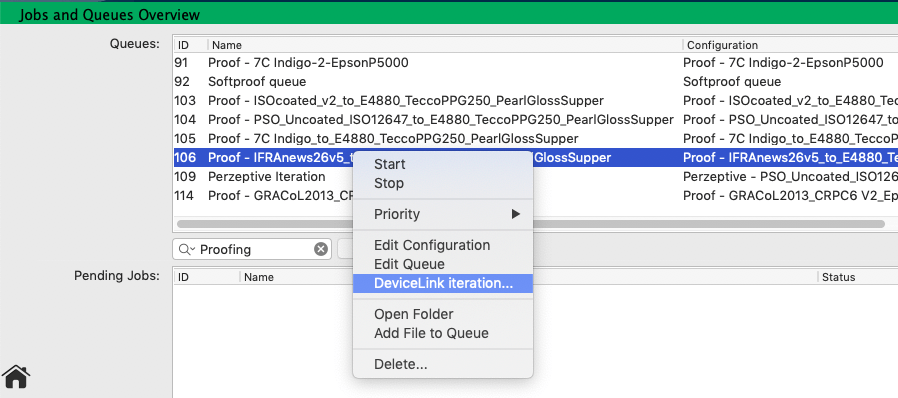
Right-clicking on jobs under Queues opens a context menu where the following options can be chosen:
Start
Starts the selected queue.
Stop
Stops the selected queue.
Priority
Changes the Priority of the jobs to be processed. Change the setting to Normal, High or Low.
Edit Configuration
Change the selected configuration settings.
Edit Queue
Edit the queue settings.
DeviceLink Iteration
Starts the DeviceLink Iteration Wizard for the selected configuration.
Open Folder
Opens the queue’s folder (hot folder).
Add File to Queue
Select the file to be processed, it will be imported directly into the Input hot folder of the queue and processed immediately.
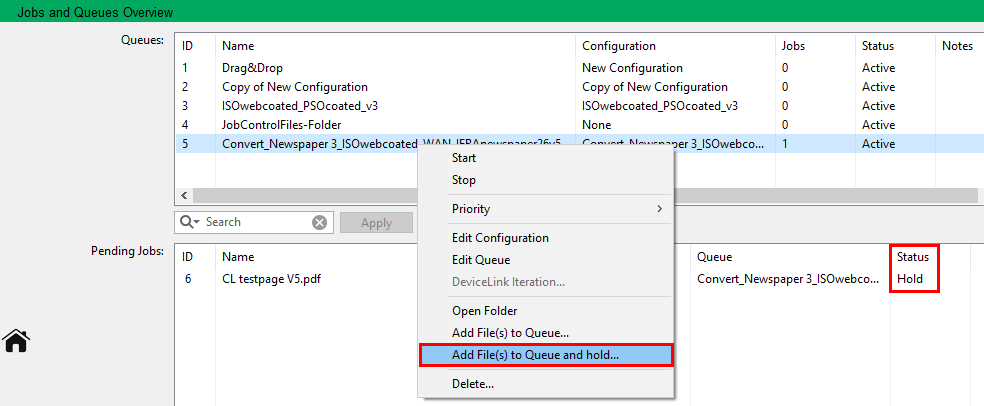
Add File(s) to Queue and hold
Allows you to add files to the selected queue and hold a job, e.g., to temporarily edit the configuration settings without permanently changing the configuration, or to add Job Control Files (XML or JSON) with the processing parameters for the selected job. Several files can be added at once. For more information, see Temporary Change of the Job-specific configuration settings.
Delete
Opens the Delete Queues dialog.
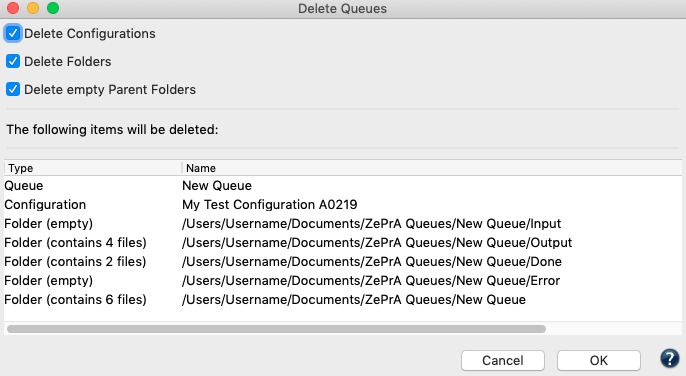
Delete Configurations: Deletes the Configuration associated with the queue.
Delete Folders: Deletes all subfolders associated with the queue. The Base Folder of the queue is not deleted.
Delete empty Parent Folders: Deletes all subfolders and the Base Folder of the queue.
The table shows the files and folders which were selected for deletion.
Type: Indicates whether it is a queue, a configuration or a folder. For folders, the number of files contained is also displayed.
Name: Shows the names of queues, configurations and folders. For folders, the whole path is displayed.
If all checkboxes are unchecked only the queue will be deleted. In that case, the configuration and all folders will remain on the hard drive.
Configuration settings can be changed temporarily on a job-by-job basis. Add File(s) to Queue and hold allows you to load and hold a job and temporarily edit the configuration settings without permanently changing the configuration.
Example: You are printing various jobs on a digital printer and most of the jobs are to be printed on cardboard, with your configuration in ZePrA defined for this purpose, but one job is to be printed on a different substrate. In both cases, the same configuration is used, but with different target ICC profiles. Instead of creating a copy of the existing configuration for this one job, you can use this feature to temporarily edit the configuration settings without permanently changing the configuration.
Note: Several files can be selected at once.
Procedure
Right-click on the queue and select Add File(s) to Queue and hold from the context menu and select your file(s).
Processing of the selected file is paused in the Pending Jobs section. Right-click on the job and select an option from the context menu:
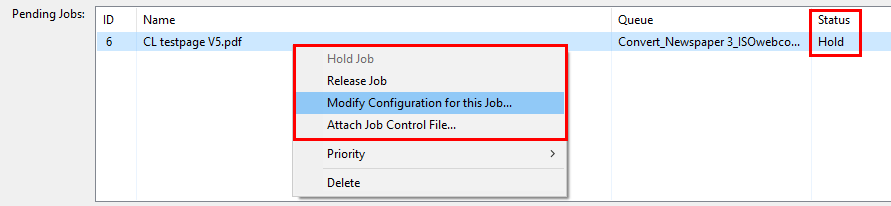
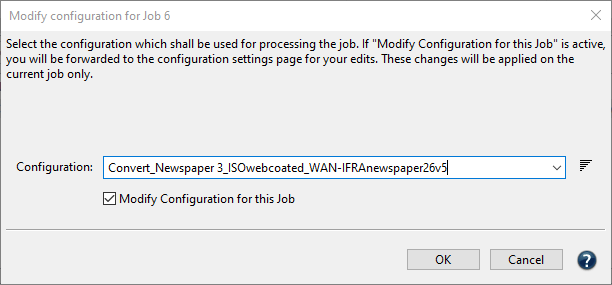
Modify Configuration for this Job: Allows changing the base configuration to be used for the processing the selected job. By default, the configuration associated with the selected Queue is preselected. Select the checkbox Modify Configuration for this Job if additional changes in the configuration are required and click OK.
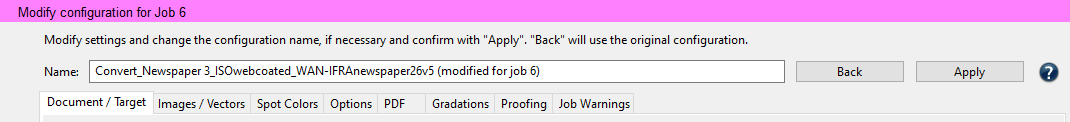
Modify Configuration for this Job: Opens a temporary copy of the selected Configuration in a separate dialog. Name shows the currently used configuration. The text in brackets indicates that this configuration is temporarily modified for the selected job.
Change the desired settings and optionally change the name of this customized job-specific configuration to make it easier to recognize later on.
Once you are done with your edits click Apply to confirm or Back to return to the original settings. In both cases the dialog will close and ZePrA will revert back to the
Overview dialog.
Release Job: Starts processing the job with the modified settings. Keep in mind that the edits will be applied to this one job only.
Iteration can be necessary to achieve the best possible color match, especially when proofing. To apply an iteration, a special test chart must be converted with the desired color management settings of a given configuration, printed and measured. Based on the measurements the DeviceLink profile can then be optimized. After one to three iteration cycles, a closer match in terms of DeltaE values is achieved. This process is error-prone if done manually, however, it is easy to accomplish with the help of the DeviceLink Iteration Wizard, which guides you through each step.
Overview of the DeviceLink Iteration Wizard in ZePrA.
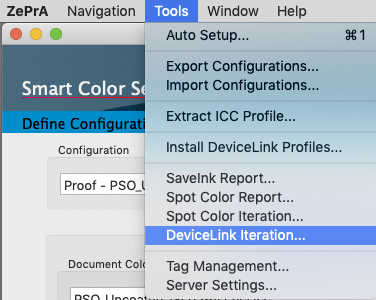
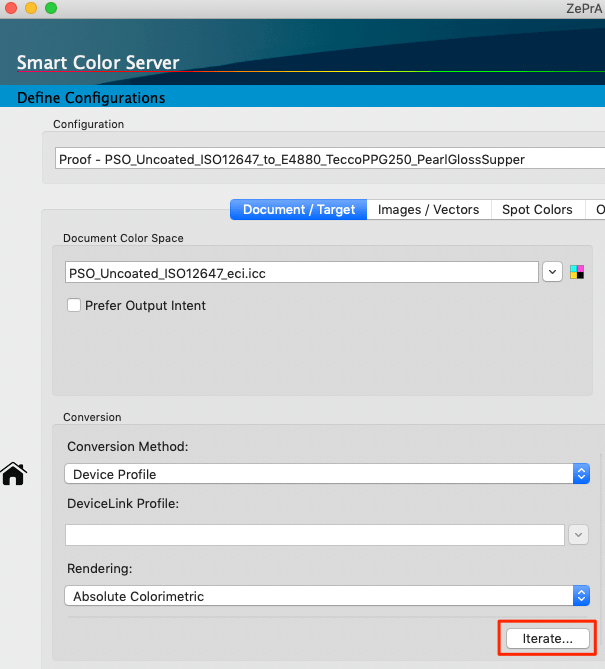
The iteration starts by selecting the configuration containing the DeviceLink to be iterated. This can be done in three different ways:
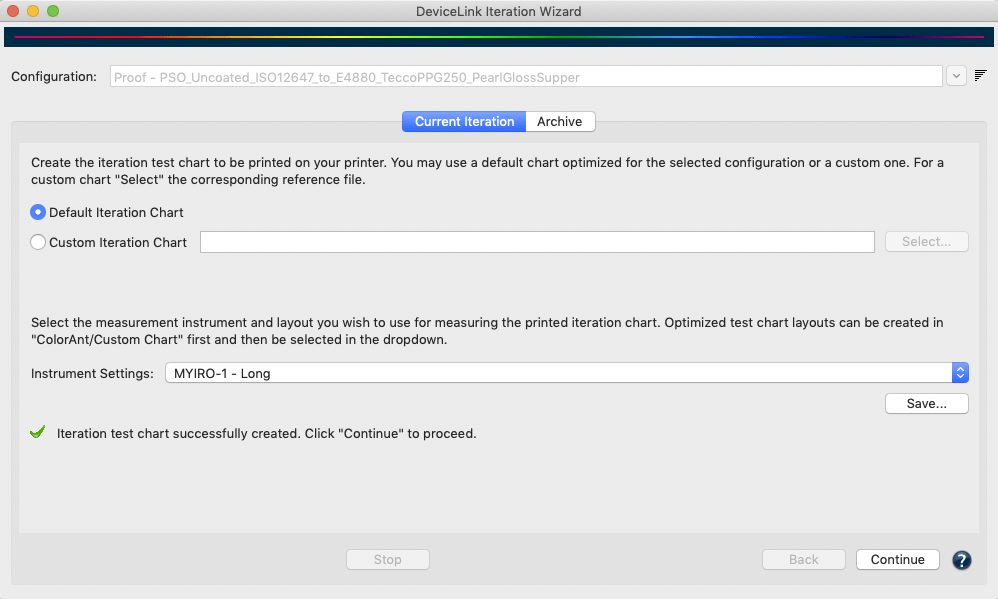
The DeviceLink Iteration Wizard dialog consists of two tabs, the Current Iteration and the Archive tabs. The Current Iteration tab contains the actual iteration wizard and typically, if a configuration is selected that has not yet been iterated, the wizard is started directly there. The Archive tab contains all the iteration steps that have been carried out, including all the evaluation details.
The wizard guides the user through the iteration process in these four steps:
There are two possibilities to create the test chart. Either you use the included Default Iteration Chart, which of course is always optimized for the color space of the given configuration. Or, select your own reference file (TXT, CXF3, XML) of a custom chart under Custom Iteration Chart.
After that, define your measurement Instrument Settings. Various settings for the supported measurement equipment can be selected from the drop-down menu in the Measure Tool (the Measure Tool is included in ZePrA).
Note: ColorLogic ColorAnt users can create their own instrument settings optimized for their specific requirements in the Export Chart tool.
Click Save and choose a file format (PDF, TIFF or PSD) to create the test chart in the selected location. All color management settings of the configuration will be applied automatically.
Note: In some cases the creation of the chart may take some time, for example if the Conversion settings SmartLink or Device Profile are used in the configuration, as the wizard will then need to create a DeviceLink profile first.
After you successfully created the chart and the associated reference file, a message and a green check mark indicate that you can now proceed to the next step by clicking the Continue button.
The second step consists of two operations. First, the chart created in step 1 must be printed on the printer without color management settings. Then, after drying, the print must be measured. If the Measure Tool is to be used, simply click on the Measure button. You do not need to worry about the reference file and layout, as this is already preselected within the Measure Tool. Instructions on how to select your device and make measurements using the Measure Tool can be found here.
Note: Alternatively, you can use the previously exported reference file and measure your printed chart with a different measurement tool. Make sure that the measurements are saved in standard file formats that can be read by ZePrA, such as CGATS TXT, XML or CXF3. The external measurement files can be loaded using the Load button.
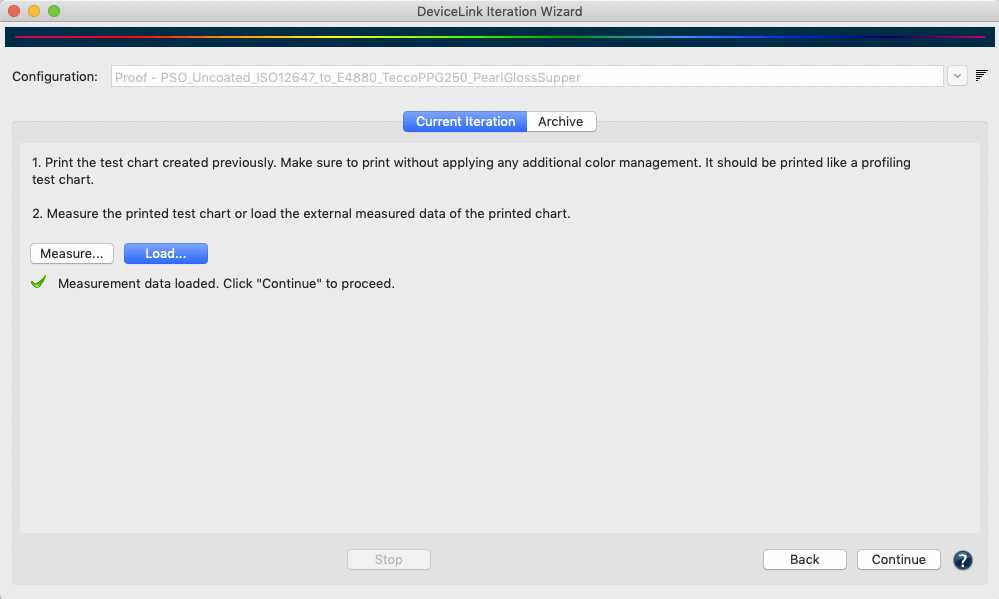
Once the measurement data has been transmitted from Measure Tool or loaded from external sources and it conforms to the printed chart a green check mark indicates a match and you can proceed by clicking Continue.
Note: When loading measurement data that does not match the chart layout or the corresponding patches in the reference file, you are alerted by a warning message and proceeding to the next step is not possible.
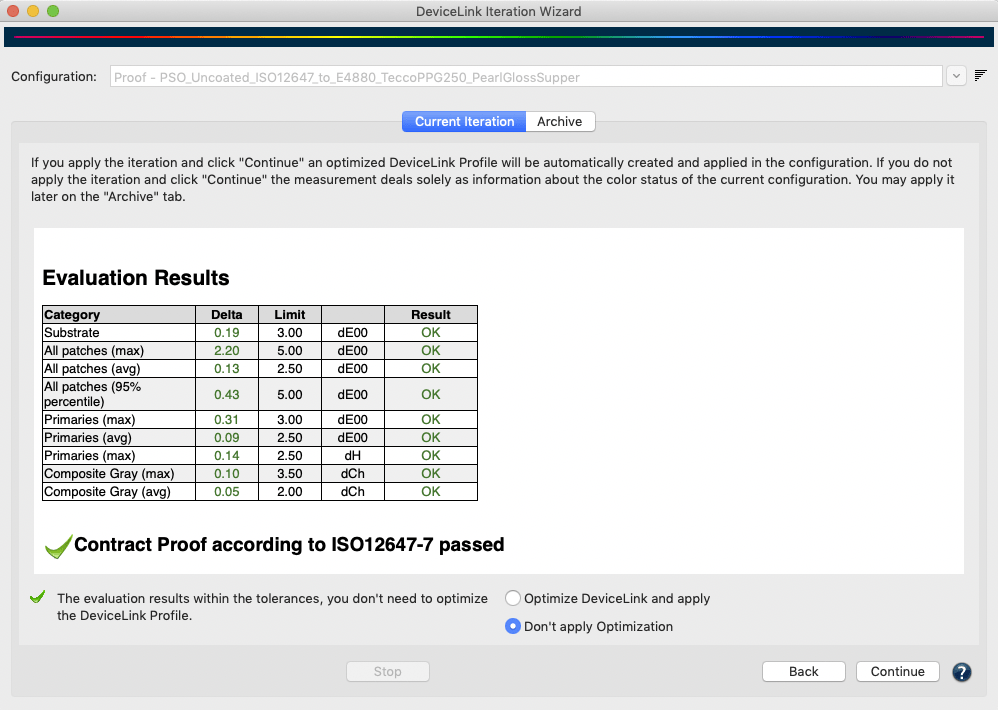
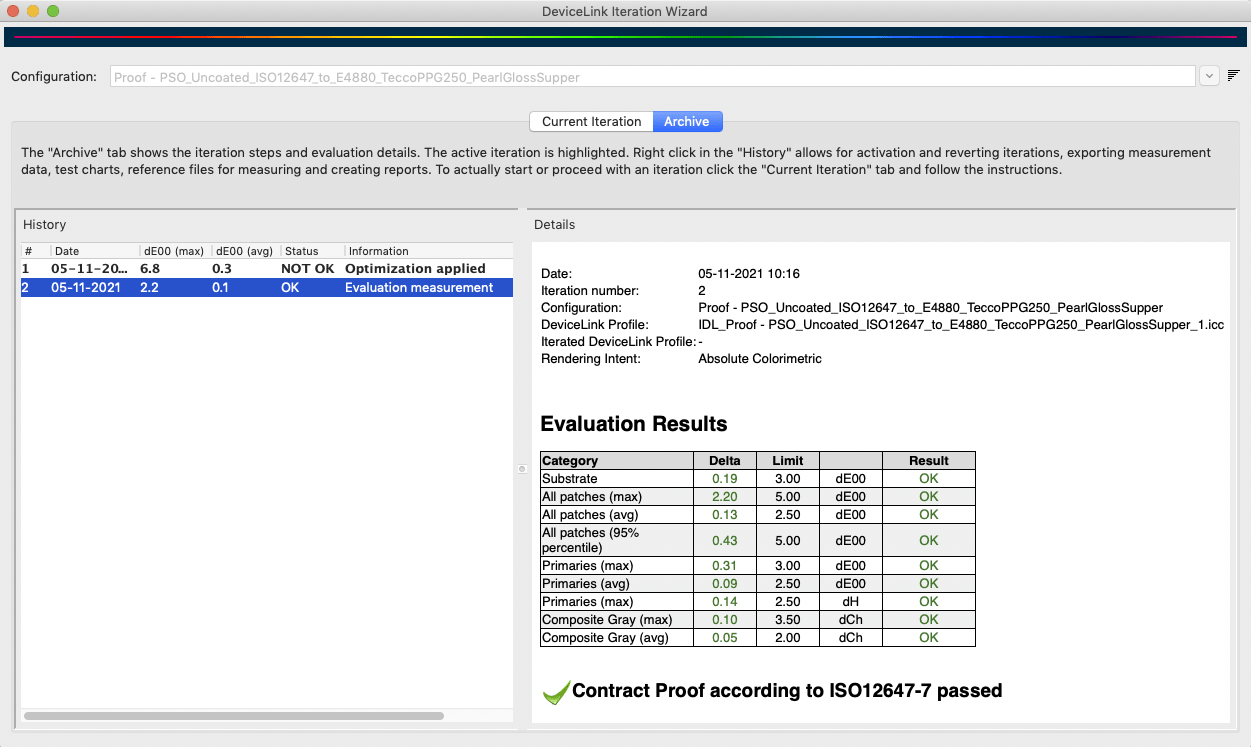
The third step shows the Evaluation Results of the measurements compared to the desired color conversion.
If all categories such as substrate, the maximum and average deltaE for all patches, etc. are within their limits they are marked green and the overall result is marked all right.
In a proofing case, e.g if an absolute colorimetric rendering intent was used in the configuration, the proof print is compatible with a Contract Proof according to ISO12647-7 and the wizard indicates this by a green check mark and a corresponding note text. A further iteration is then not required, hence the Don’t apply Optimization radio button is preselected.
However, the preselection can be overridden and another iteration cycle applied if the results are to be improved even further. To do this, select the Optimize DeviceLink and apply radio button and click Continue. Alternatively, apply the iteration later via the Archive tab.
If only a single category is displayed in orange or red in the table of Evaluation Results, the proof print is considered to be not okay and the validation has failed. In this case, a warning is displayed and it is suggested to apply an iteration to improve the result. The corresponding radio button Optimize DeviceLink and apply is then preselected.
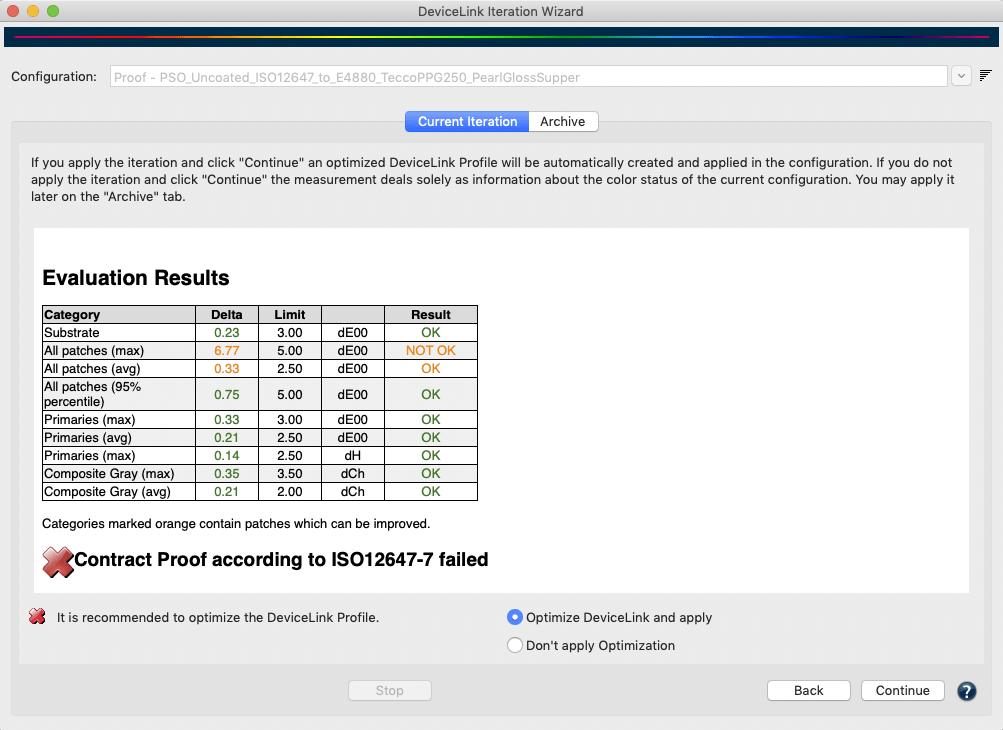
By selecting Optimize DeviceLink and apply and clicking on Continue, an iterated DeviceLink is created on-the-fly and automatically entered in the configuration.
ZePrA checks for out-of-gamut colors and evaluates whether those colors can be improved. Color values that are displayed in red in the Evaluation Results and Report are considered to be out-of-gamut and their deltaE00 values can most likely not be improved. Nevertheless, an iteration can slightly change the rendering of out-of-gamut colors, for example, to correct hue errors when colors are far from the desired hue. Color values that are displayed in orange, however, can be improved with further iteration. If there are only red values left, ZePrA informs, that further iterations are of no use and preselects the Don’t apply Optimization radio button. If, however, there are orange values left, these can be further optimized and ZePrA suggests Optimize DeviceLink and apply.
The fourth step concludes the iteration cycle. Here, there are three options to choose from. Based on the previous results, the wizard already preselects a logical option for you to follow:
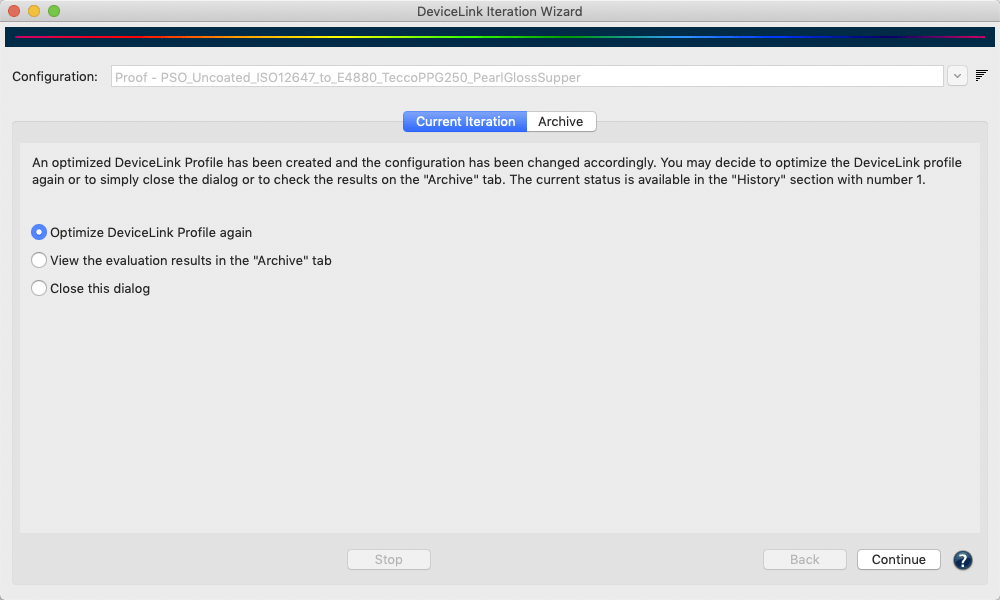
All data created during the iteration - such as test charts, reference data and measurement data, as well as the report - are stored in an internal database in addition to the save location defined by the user.
Therefore, if data is deleted from the save location it can still be restored from the internal database any time via the Archive tab. Users can stop an iteration process and even close the DeviceLink Iteration Wizard dialog at any time and can revert back to the last completed step with the help of the Information stored in the Archive.
The Archive tab shows all iteration steps and evaluation details. The History table contains a list of all iterations, with the active iteration highlighted. More information for the selected iteration step is displayed under Details.
The columns of the History table show the iteration step number #, the maximum DeltaE00 value dE00 (max), the average DeltaE00 value dE00 (avg), the Status of the selected iteration step and some Information about the iteration process itself, such as Optimization applied, when the measurements done from the printed test chart have actually been used to create an iterated DeviceLink, or Evaluation measurement, when the measurements have been used for evaluation only and have not been used to create an iterated DeviceLink.
In addition, the iteration process (being performed in the Current Iteration tab) can be discontinued, which is indicated with various messages such as Next step: save chart, Next step: measure or load data, Next step: Evaluate.
Right clicking on an iteration step in the History displays a context menu with the following options:
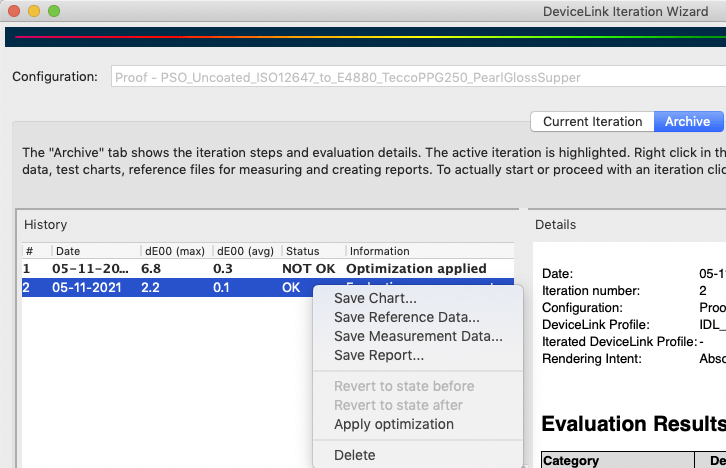
Save Chart: Exports the test chart into a file selected by the user. The test chart is not newly created but only copied from the internal database. This implies that the file selection only supports the file type initially chosen by the user.
Save Reference Data: Exports the reference data that belongs to the test chart into a file selected by the user.
Save Measurement Data: Exports the measurement data into a file selected by the user.
Save Report: Saves a report containing all Details displayed on the right and the full information about each measurement patch. This is useful to identify colors with the highest or lowest deltaE values, or colors which are out of gamut. The report is explained in more detail below.
Revert to state before: This is only available for iterations with the status applied. Reverts back to the state before this iteration, giving the previous iteration, if any, the applied state. The status changes to evaluation measurement. All subsequent items are deleted.
Revert to state after: This is only available for iterations with the status applied. Proceeds to the state after this iteration step, making it the active iteration. The status of a next iteration, if available, would be evaluation measurement. All subsequent items after the next iteration are deleted.
Apply Optimization: This is only available for iterations with the status evaluation measurement. It can be used for evaluation measurements that have not been applied in the iteration process itself. Use this option if you want to apply an iteration later on.
Evaluation Results
The Evaluation Results shown under Details are always the evaluations of the previous step. This means, if an iteration has been applied in step 1, the evaluation results shown under Details for the selected step 1 are the values before the iteration has actually been applied. Therefore, in order to see the results of the first iteration a second step is necessary. The evaluation results shown for that second step are actually the iteration results of the first iteration step, and so on. This offers the possibility to use the results of an iteration itself for a second iteration. But again, another measurement step is needed to find out if this iteration actually improved the result.
Evaluation measurements for the different Categories are shown according to the proof evaluation tolerances defined in ISO 12647-7. They can even be regarded as proof evaluation when an absolute colorimetric rendering intent has been used in the configuration. The values shown in the table can assume three different colored states that are green, orange or red. Values shown in green are within the Limit and therefore all right. Orange values are outside the Limit but can be improved by iteration. Red values are outside the Limit and cannot be improved. This is mostly the case if a source color can’t be reproduced in the target color space because it is out-of-gamut. An overall statement of the accuracy of the rendering is given below the table. A green check mark indicates that the color conversion is within the limits, whereas a red cross indicates that it is not.
Special cases arise if the rendering intent used in the configuration is not absolute colorimetric. In case of relative colorimetric or perceptual rendering intents the reference Lab values used to iterate the conversion need to be calculated from the initial DeviceLink profile. The measurements are then compared to those rendering intent specific reference Lab values. The iteration is still using the tolerances from ISO 12647-7 for the analysis of the iteration accuracy. However, since this conversion is not a proof print, a different statement results for the overall iteration accuracy compared to the iteration result with an absolute colorimetric rendering intent.
The Report
By right-clicking on an iteration step in the left table, a report can be created for this step. The report can be saved in various formats such as PDF, HTML, XML and TXT. The PDF and HTML formats are the most common versions for end users, while the other formats are more intended for automation and usage in other systems such as a MIS (Management Information System).
The report contains all displayed Details and the complete information for each measuring patch. This is handy for identifying colors with the highest or lowest DeltaE values or colors that are out-of-gamut. A Legend explaining the color highlighting in the DeltaE column is shown at the bottom of the last page of the report.
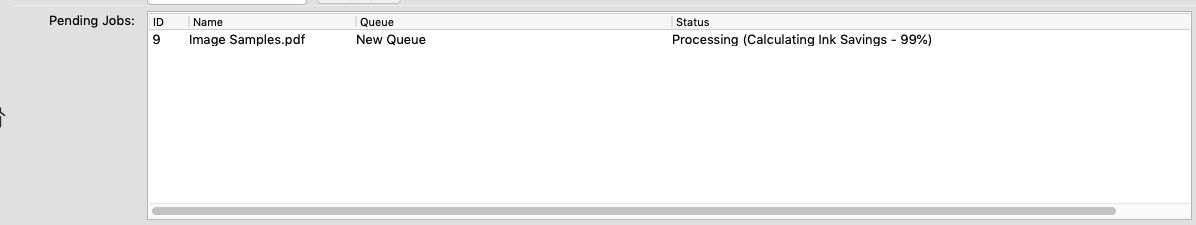
The list Pending jobs shows the Job-ID, the file name, the queue and the status of the queue. It can be sorted by ID, Name, Queue and Status. Clicking on the ID column places the most recently processed job at the top, while clicking on the Status column places the files with errors and/or warnings at the top.
The Status column provides information about the progress of file processing. Displays the processing step (such as SmartLink calculation or ink saving calculation) and the progress in percent.
Right-clicking on a job under Pending Jobs opens a context menu containing the following options:
Priority
Change the priority of the job to Normal, High or Low.
Delete
Deletes the selected job.
The list Processed Jobs at the bottom of the window shows which jobs have been processed.
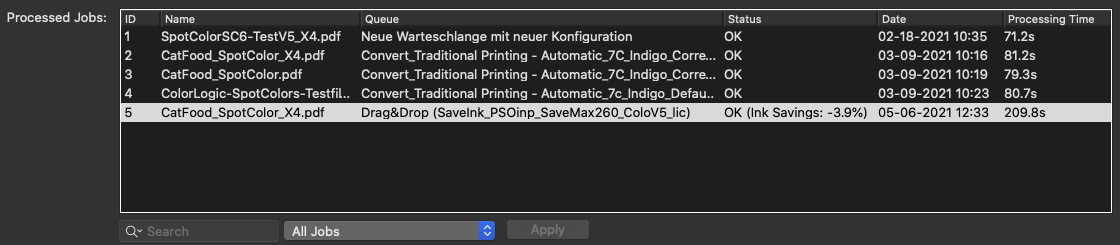
If errors occur when processing files, or if ZePrA detects non-supported file types, they are highlighted in red. If warnings occur during processing, file processing continues and the job is highlighted in yellow and labeled with a warning. Warnings show what action to take.
The list shows the Job-ID, the file name, the queue, the status and the date. It can be sorted by ID, Name, Queue, Status and Date. Clicking on the ID column places the most recently processed job at the top, while clicking on the Status column places the files with errors and/or warnings at the top. By right-clicking on the header of the list, the columns ID, Queue, Date, and Processing Time can be enabled or disabled. The Processing Time of the job is displayed in seconds.
Right-clicking on jobs under Processed Jobs opens a context menu containing the following options:
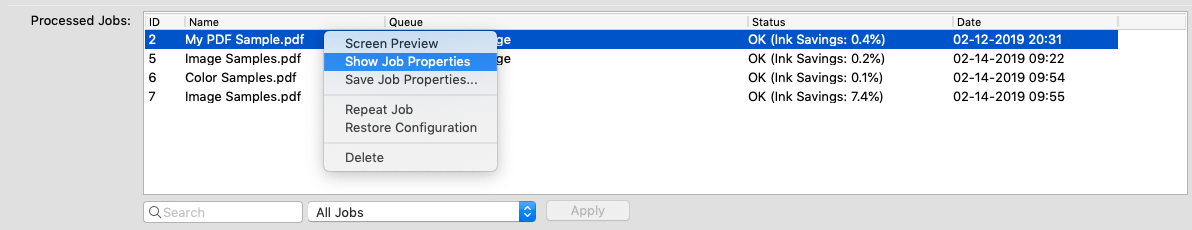
Screen Preview
View a screen preview with color management of the selected job.
Show Job Properties
Opens the Job-Report which contains properties of the selected job. More information on job properties can be found in the section Show and Save Job Properties below.
Save Job Properties
Saves the Job Report as PDF, HTML, TXT or XML file.
Repeat Job
Allows to process a processed job once again using the same configuration without the need to open the hot folder.
Restore Configuration
ZePrA allows restoring the configuration of a previous job in order to reprocess a file. As of ZePrA 7, the configurations of all jobs are saved and kept for future re-prints.
When to restore a configuration: A customer requests a reprint of a job and requires a similar or even identical color appearance previously printed. If that configuration has not been saved, or has been changed since, it is lost and it might be difficult or even impossible to remember the ZePrA settings used for that job.
Restore Configuration allows restoring a previously used configuration.
Spot Color Iteration
Starts the Spot Color Iteration Wizard with the spot colors of the selected file and the matching configuration.
Delete
Deletes the selected job.
The search function can browse through the sections Queues and Processed Jobs to search for the following criteria:
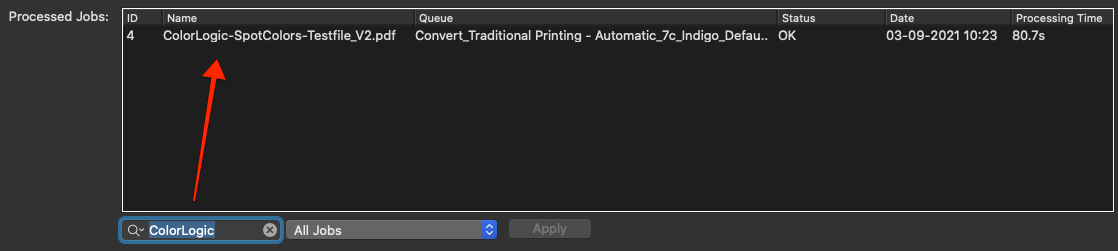
To use the search function, enter the search term in the text field with the magnifying glass icon.
In the Processed Jobs section, limit the search to a specific date range. This is useful to check how many and what kind of jobs have been completed in the searched time period (for example for a specific customer).
Search jobs by a defined range or in a period of the last few days, weeks, months or years. To do so, select one of the three options from the drop-down menu:
The Notes that have been entered in the dialogs Configurations and Queues are shown in the main window of ZePrA in the list Queues. The Notes column allows to quickly locate queues based on relevant keywords, for example; customers, printers, media types or other special properties.
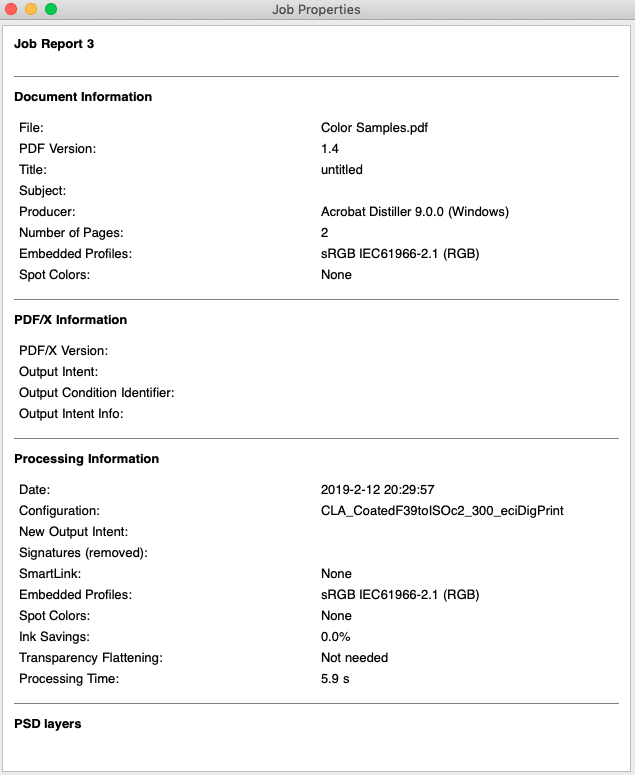
The Job Report provides relevant information for the selected file including any PDF/X and ZePrA processing information. It can be accessed via the context menu (by right-clicking on a job in the section Processed Jobs and selecting the entry Show Job Properties).
Document Information
This section contains information about the PDF version and the spot colors used. It also displays the page number for multi-page PDF files.
PDF/X Information
Shows the PDF/X-Version and the Output Intent.
Processing Information
Provides information about the Date and time of the conversion, Embedded Profiles of the original file, which Configuration was used, the New Output Intent, whether DeviceLink profiles were calculated using SmartLink, the Ink Saving percentage (if enabled), whether a spot color was iterated and whether Transparency Reduction was used including the selected settings.
The total Processing Time of a job is listed as well. The time is always displayed in seconds, even if the processing takes several minutes.
Spot Color Processing
This list provides information regarding the spot color library used for the conversion and the printing sequence. If the Spot Color module is licensed and spot colors are converted to the target color space, all spot colors and their DeltaE color value upon conversion are listed in the section Spot Color Processing. Additionally, the average and maximum deltaE00 values, as well as the expected dE00 and dE76 values are listed for each spot color. When an error occurs during conversion in ZePrA, the information will be listed under Warnings.
PSD layers lists the layers that were converted.
Save Job Properties
Job properties can be saved as a report file in various formats (including PDF, XML, TXT, and HTML) by right-clicking and selecting Save Job Properties.
The Job Properties report can also be saved in the formats Raw data in XML format and Raw data in JSON format. For new workflows it is recommended to use one of these formats. The older XML format is no longer recommended and is only available for compatibility reasons with older workflows.

Note: If separate libraries are created for different substrates or printing processes, identical spot color names can occur in several libraries but will be associated with different measurements. Make sure to select the correct library for the color conversion in the configuration to avoid problems.
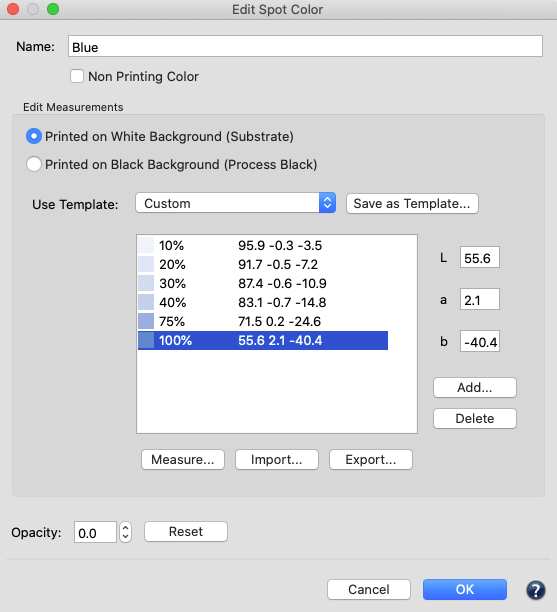
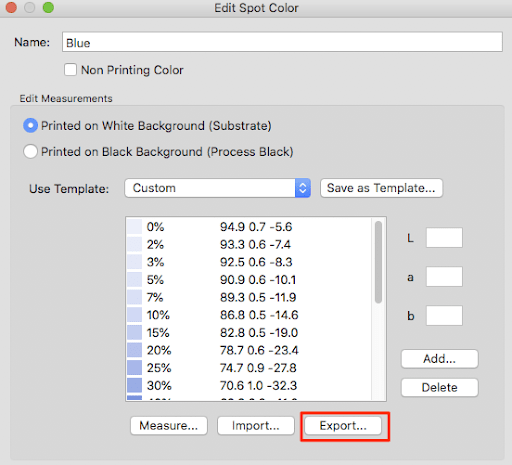
Editing a Spot Color
Note: It is recommended to print a wedge of the spot color directly onto the respective substrate as well as a second wedge of the spot color as an overprint with the black process color (black must be printed first) using the correct printing conditions and to measure them spectrally in ZePrA. This will allow ZePrA to perform high quality conversions for the solid tones, the gradations and the opacity, taking dot gain into account. Compared to Lab values, spectral measurement data can improve the simulation of overprinting spot colors.
Opacity indicates how translucent or opaque a color is. A spot color is fully transparent when the value is set to 0% and completely opaque with a value of 100%. When the opacity value is changed manually, the spot color has a custom opacity.
Reset: Removes the custom opacity from the spot color. The Reset button is enabled if the spot color has a custom opacity, otherwise it is disabled. If the spot color has no custom opacity (Reset button disabled), the displayed opacity value is updated whenever a relevant measurement value (e.g. measurement on black) changes.
Note: ZePrA will automatically calculate the opacity of measured values on black backgrounds, and use the opacity values for the color conversion of spot colors. Information from the ink manufacturer regarding the opacity of the spot color can be entered directly as a percentage, measurements on a black background are not required. Without any opacity information ZePrA will assume the spot color to be fully transparent at 0%.
Note: The Information table under Spot Colors from selected Libraries indicates whether a spot color in the library consists of a solid tone or of tints and whether the color values are based on spectral or Lab data. The opacity of the spot colors is shown as well, if available. Color values can be edited by double clicking on a spot color in the table. Delete, Cut, Copy and Paste are accessible using the right click context menu. Colors can be moved to another library by Cut and Paste. To do so, select the color(s) to be moved, right click and either Cut or Copy. Then select another Library, so that its colors appear in the table under Spot Colors from selected Libraries, right click and Paste.
Some measuring instruments allow to select the measuring mode (M0, M1 or M2). Select the mode that fits the measuring requirements, then select the measuring mode for the wedge layout and press the Measure button on the instrument.
Note: Barbieri measuring instruments are optimized for test chart measurement therefore single patch measurement is not available.
Once the measurement is complete, the measured color appears in the Measure Tool. The measurement data can now be transmitted to ZePrA by clicking Transmit. Saving the measured values in the Measure Tool is not required.
The Measure Tool is part of ColorAnt and included in ZePrA. If it has not been installed on the computer, the Measure button is not available in ZePrA.
The following measuring instruments are supported by the Measure Tool:
Connect the measuring instrument to the USB port of the computer and select the appropriate wedge from the drop-down menu Use Template. Then click the Measure button in the Edit Spot Colors window in ZePrA. The Measure Tool will start and the rest of the process is completed within the Measure Tool software.
If a solid tone is selected, a single color patch is preselected for the measurement. If a step wedge is selected, the layout of the wedge selected in ZePrA is displayed. Under Selection, select the measuring instrument connected to the USB port from the drop-down menu. Click Connect and follow the instructions. More information about measuring can be found in the ColorAnt online help.
In single patch measurement, only one color is measured and transmitted at a time. Either click Transmit or re-measure if the measurement was faulty or unsuccessful.
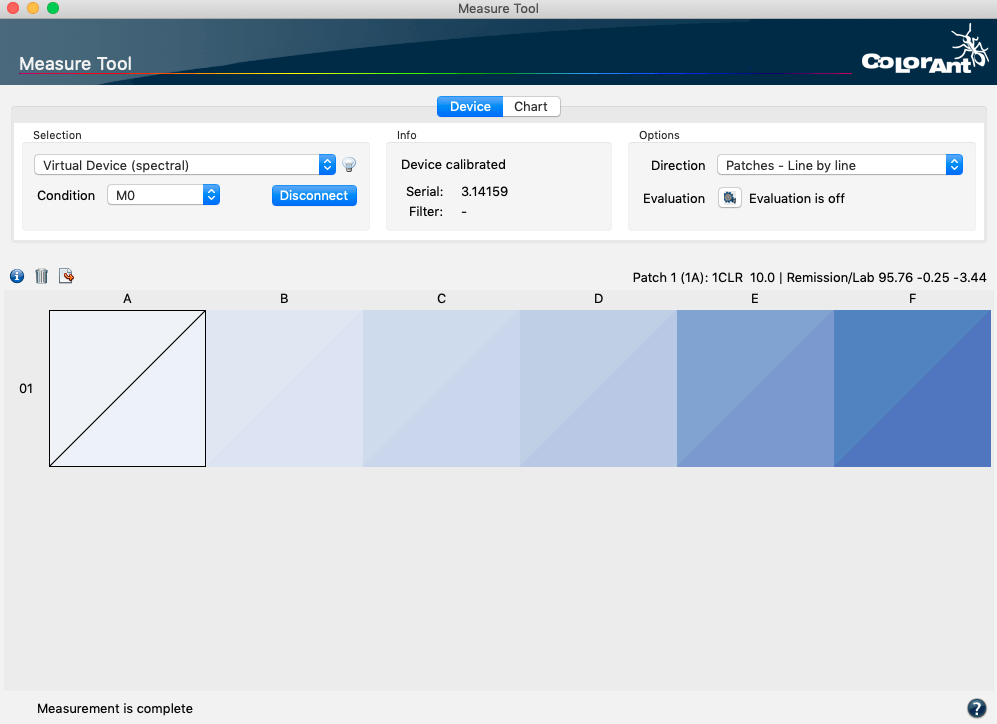
The Measure Tool Window
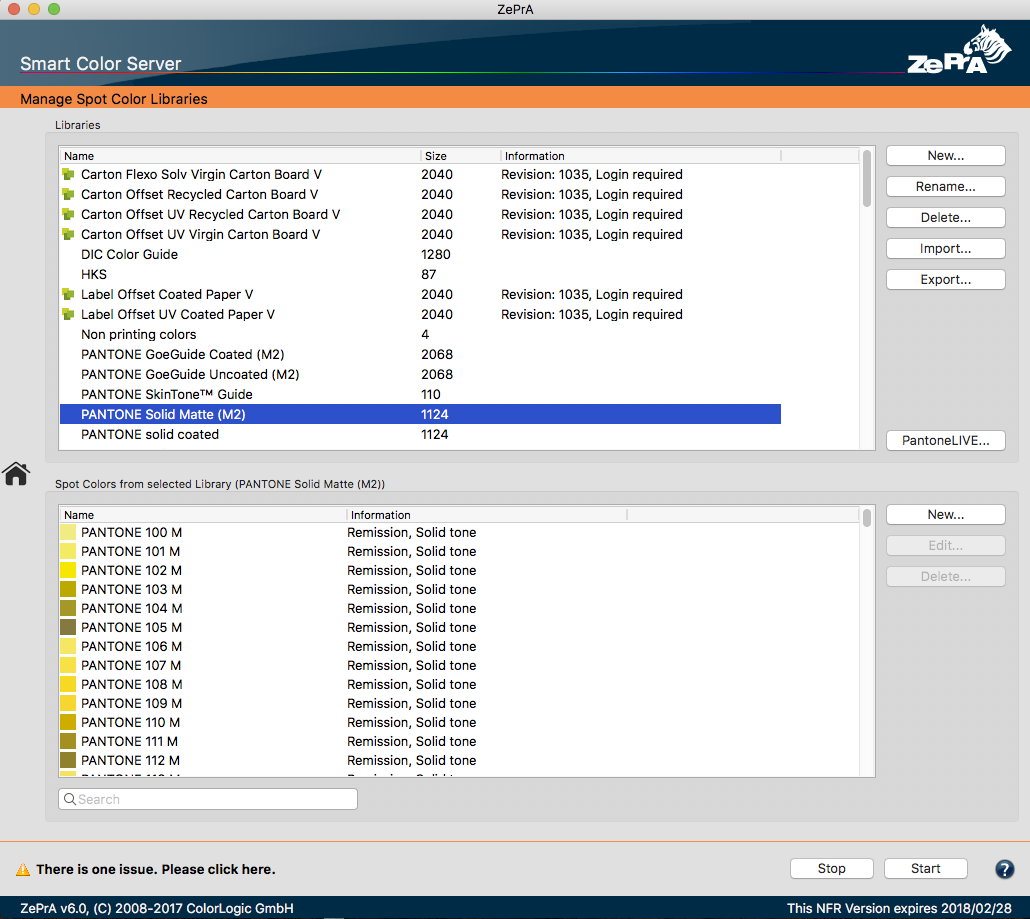
Spot Color Libraries
ZePrA’s spot color module allows management of spot colors and spot color libraries efficiently. Select the tool Spot Color Libraries from the sidebar to access the window Manage Spot Colors.
Here you can create, add, view and customize libraries. Spot colors can be edited, imported or measured. For example, spot colors from color fans can be measured with a spectrophotometer or Lab values can be entered manually. Furthermore, color tables with spot colors can also be imported. Supported formats are Named Color ICC profiles, Photoshop ACO color tables, Adobe ASE color tables (from InDesign or Illustrator), text files in CGATS format or CxF files, such as CxF/X-4.
X-Rite Pantone Color Manager color tables support Named Color ICC profiles, CxF files (there are current Lab values, but no spectral values for Pantone solids), and CGATS-compliant text files. Import your PantoneLIVE color fans stored in the cloud by clicking the PantoneLIVE button.
Note: PantoneLIVE® from X-Rite is a cloud-based solution for the digital storage of spectral spot colors. To use PantoneLIVE, licenses are required for the ZePrA spot color module and X-Rite’s PantoneLIVE module. You need to unlock your licenses for use in ZePrA under My X-Rite. See PantoneLIVE to learn how to activate your licenses.
Both lab and spectral color values are supported; however, spectral measurement data is preferred as it provides the best results internally.
A spot color library can contain a multitude of different information in just one library, such as the full tone, tints printed on a substrate or black, spectral or Lab measurements and opacity values.
All available libraries and the number of spot colors of a library are listed under Libraries. Additionally, the revision number and expiration date of PantoneLIVE libraries are displayed (with the PantoneLIVE icon).
After double-clicking on the selected library the spot colors will be shown in the lower part of the window. In order to improve the performance – especially with extensive libraries – spot colors will only become available when they are used for the processing of jobs or by double-clicking on a library.
The spot color table shows the Name of each spot color and additional Information such as the data type (Remission or Lab) Solid tone or Tone values, or Opacity information (custom or calculated).
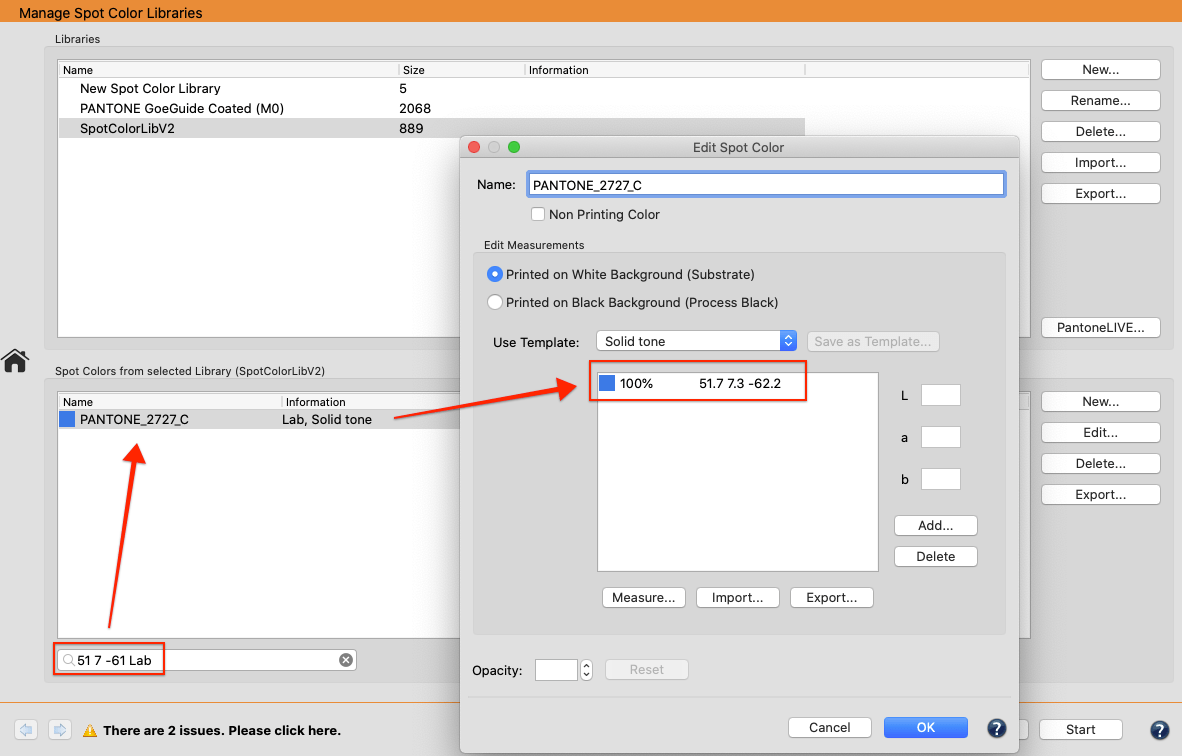
The search function can be used to find specific spot colors quickly. Spot color libraries can also be searched for Lab values. If the search text is of the form “L a b Lab” (e.g. “51 7 -61 Lab”), ZePrA searches for spot colors matching the specified value. Since exact matches often fail due to rounding and non-precise input, a tolerance is applied.
Note: PantoneLIVE libraries are protected and in ZePrA they can not be edited, extended or removed. With PantoneLIVE, Pantone spot colors and libraries can be accessed directly from ZePrA.
Note: ZePrA does not provide spot color libraries with a new install. To obtain spot colors from some applications export Adobe Photoshop color tables with Lab color values as ACO files or Adobe InDesign/Illustrator files as ASE. Color tables of the X-Rite Pantone Color Manager can be saved as Named Color ICC profiles or as CxF file (provides current Lab values but no spectral values for Pantone full primaries) and CGATS compliant text files. Another source for spot colors is the PantoneLive eco system. The use of PantoneLIVE libraries requires the corresponding access data and an X-Rite license.
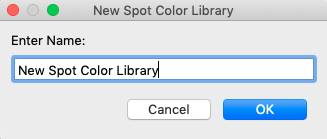
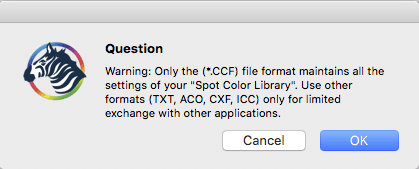
Spot color libraries can be exported. When clicking Export the supported file formats (CCF, ACO, ICC, TXT, CxF) for saving the library are displayed. Note that only the ZePrA internal CCF format allows saving all information that may be in a library. Use the CCF format to exchange a library with another ZePrA installation on another computer. The other more common file formats are mainly included for exchange with other applications. A warning appears for other file formats.
There are three ways to Export spot colors:
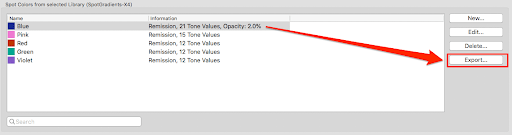
When clicking Export the supported file formats (CCF, ACO, ICC, TXT, CxF) for saving the library or a single spot color are displayed:

SaveInk reports give a detailed overview of the ink savings of all SaveInk queues and jobs processed. To create a report select SaveInk Report in the sidebar.
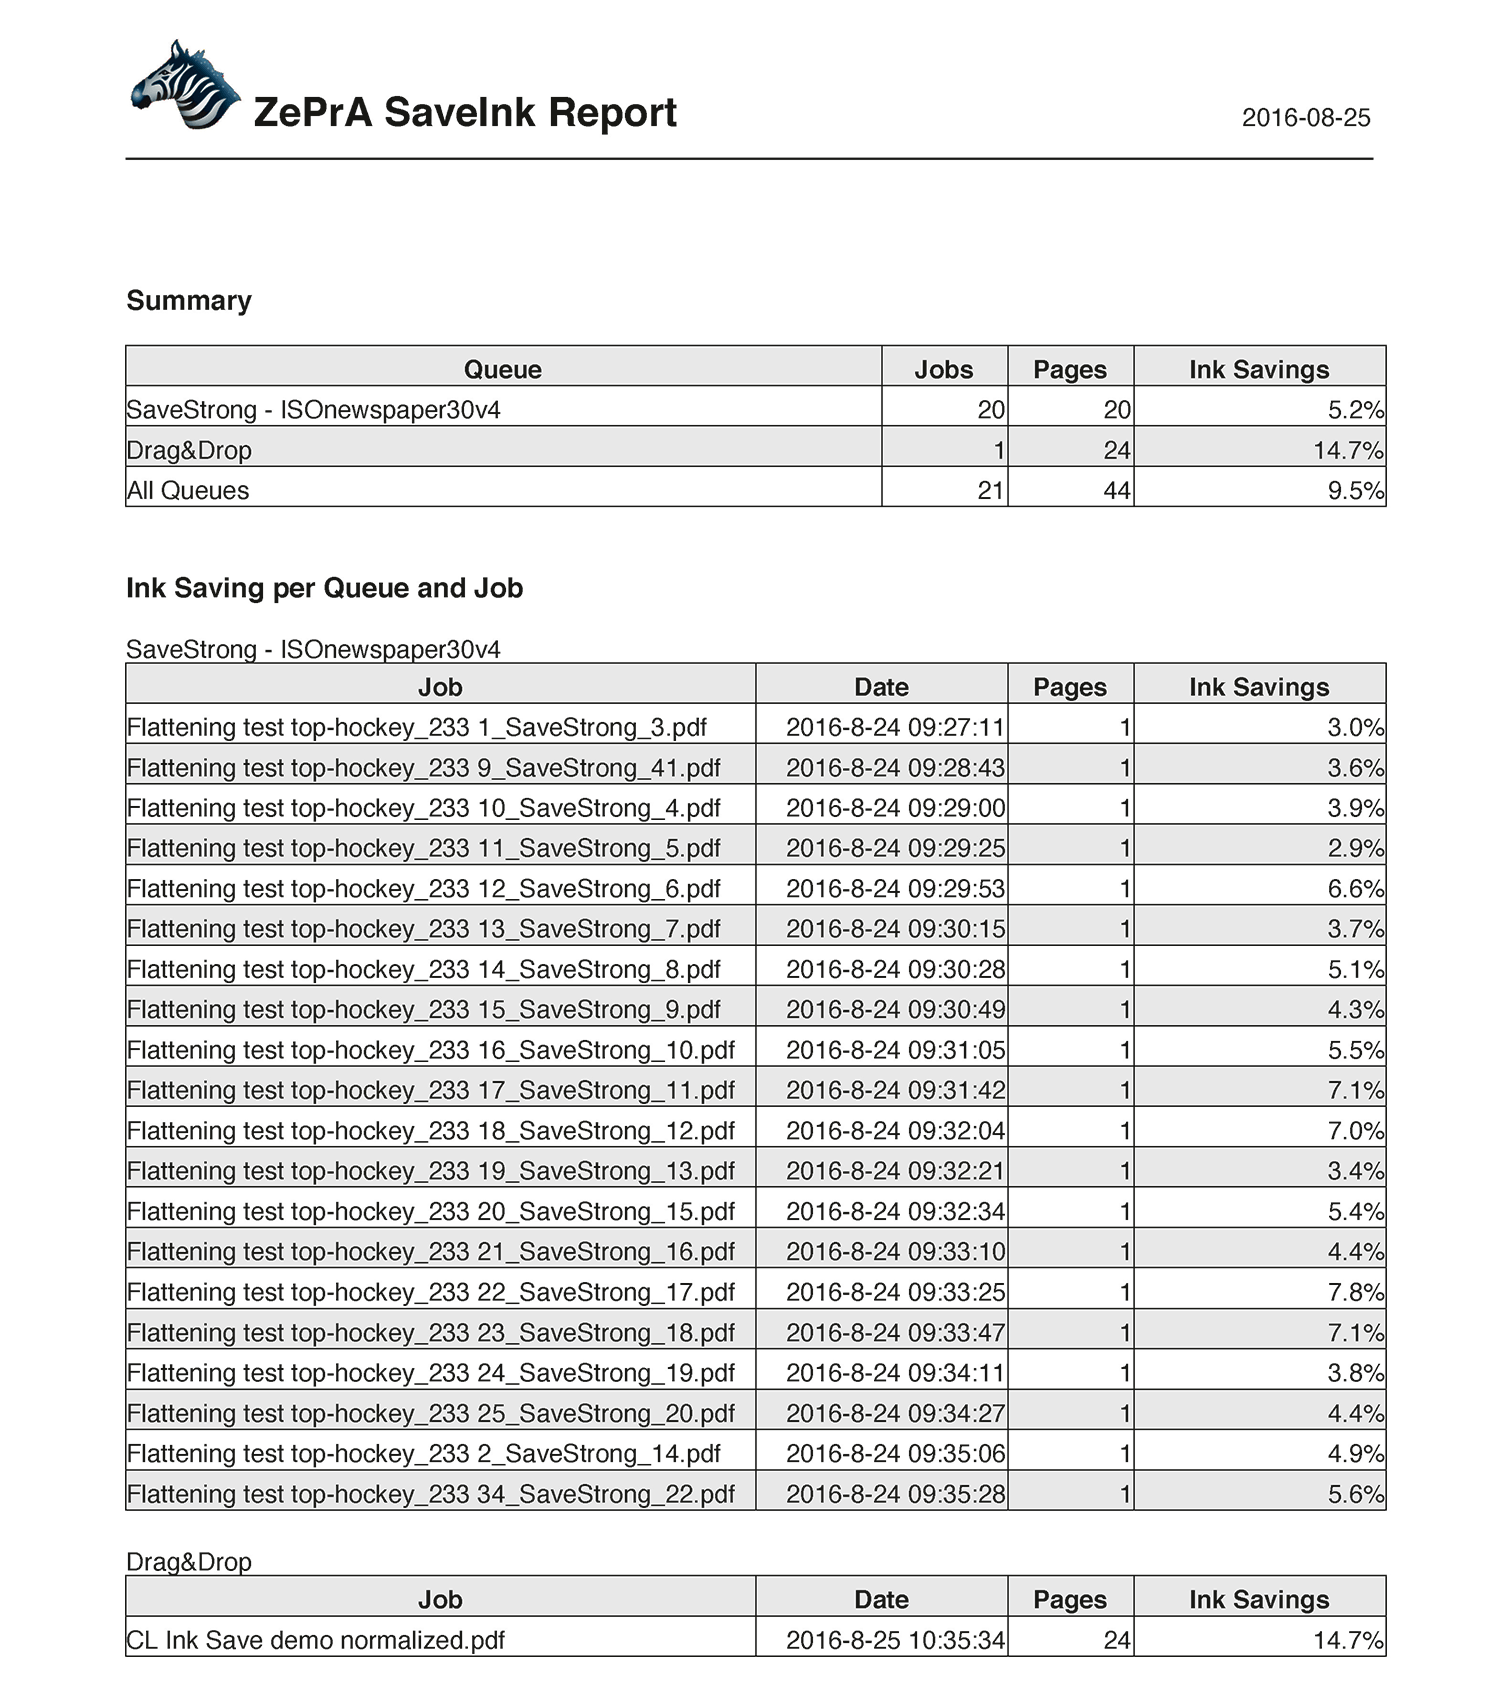
Ink savings on all SaveInk queues
Summary: Shows the ink saving for all files for each SaveInk queue and for all queues.
Ink Saving per Queue and Job: Shows details of individual queues and jobs.
Note: The percentage calculations in the SaveInk Report refer only to the CMYK components. Transparency effects, overprinting elements, and spot colors are not taken into account.