ColorAnt | CIE Conversions

CIE Conversion

Change the standard observer and illumination of data sets

CIE Conversion

Overview

The CIE Conversion tool converts measurement data into another viewing condition.

Possible tasks can include the presentation of photos in a gallery under incandescent light (corresponds approximately to illuminant A) or displays under exhibition lighting, where the lighting consists of fluorescent light. Another task is to change the illumination and observer angle for the textile industry, where D65 and a 10-degree observer are used as standard.

The CIE Conversion can be applied to spectral or colorimetric data (XYZ or Lab). For colorimetric data it uses a Chromatic Adaption Transform (CAT) based on CIECAM02.

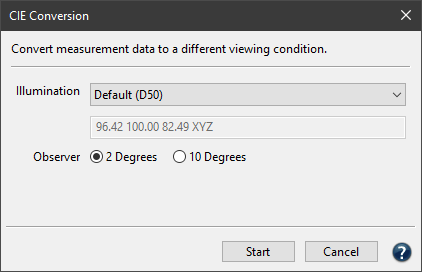
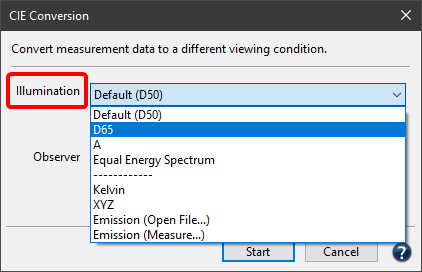
The Illumination/Source illumination/Target illumination drop-down menus contain the following options:

  • A selection of a standard illuminant: D50, D65, illuminant A or the Equal Energy Spectrum. Typically, printer profiles are created for D50 viewing conditions.
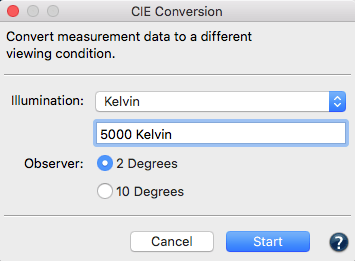
  • Manual input of Kelvin or XYZ values.
  • Emission (Open File): Selection of spectral emission readings (as CxF or text file) of a specific light source. The data can be loaded or dragged and dropped onto the selection. ColorAnt can also extract data (the white point) from a measurement file and display these values.
  • Emission (Measure): Opens the Measure Tool in Ambient Light Measurement mode. The ambient light can be measured directly from within the CIE Conversion tool using supported devices (e.g., X-Rite i1Pro, Konica-Minolta FD-7 and Myiro 1). For more information, see the Measure Tool help.

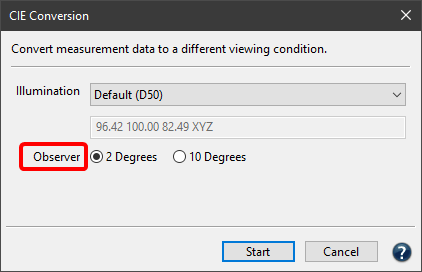
Observer: For spectral measurement data, the Observer can be changed from 2 degrees to 10 degrees. For colorimetric measurement data, the Observer cannot be changed.

CIE Conversion with spectral measurement data

  1. Select a spectral measurement file of a test chart and open the CIE conversion.
  2. Under Illumination, select one of the predefined illuminants, or manually enter the measured illuminant as Kelvin value or XYZ value. You can also simply drag a measurement file (TXT and CxF3 file) of the measured light onto the value field. Alternatively, to select a spectral light measurement, select Emission (Open File) from the drop-down menu and select your measurement file in the subsequent dialog.

    Note: If you choose to enter your own illumination, it is recommended to work with one of the two emission options, since spectral data is used throughout.
    Multiple measurements of the same light source: If there are multiple measurements in a measurement file, it is best to use the Redundancy tool for averaging, to save the file and then use it as an Emission (Open File) in the CIE Conversion.
  3. Under Observer, select the desired observer angle, 2 or 10 degrees.
  4. Click Start and the spectral measurement data are converted into colorimetric data for a specific viewing condition.

Resulting file: Spectral data are converted to Lab during CIE Conversion with the set Illumination and the selected Observer. The resulting measurement file contains only Lab values. You can then use this file to create profiles.
Note: Use the CIE Conversion as the last step due to the conversion of spectral data to Lab.

CIE Conversion with colorimetric data

  1. Select a colorimetric data file and open the CIE conversion.
  2. Set the illuminant of the measurement in the upper drop-down menu Source illumination and the desired viewing condition in the lower drop-down menu Target illumination.
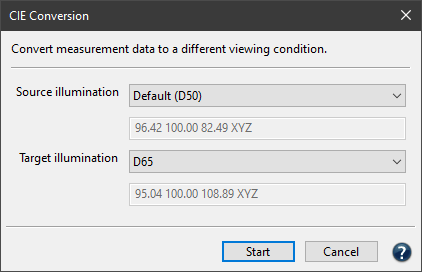
  3. The observer cannot be changed with colorimetric data.
  4. Click Start and the colorimetric data are converted into a different illumination using a color appearance model (Chromatic Adaption Transform (CAT) based on CIECAM02).

Note: Spectral measurement data achieve a better quality of the conversion, and, in addition, the observer can be changed.

ColorAnt | Averaging

Averaging

Average several data sets into one data set

Averaging Data Sets in ColorAnt

Overview

The tool Averaging can be used to average several measurement files of the same test chart and combine them to form a data set. For most data sets, the Auto method is recommended.

The methods for averaging the data sets are the same as in the Redundancies tool.

Auto: Different methods are used depending on the number of color patches. It is therefore quite possible that some color patches are processed with a different method than others. If there are two identical color patches with differing measurement values and one of the measurement values is recognized as an outlier, this method automatically selects the plausible color value.
For more than three color patches, the Weighted or Median methods are used. If there are a large number of measured values, both the Median and the Weighted methods consider values that are far apart to a lesser extent for averaging.

As the most intelligent method, Auto is preferable to the other methods.

Arithmetic: For the arithmetic averaging of values of several color patches, i.e. the average of the measurements (if, for example, only two color patches are to be averaged).

Median: Is a statistical method and denotes a boundary between two halves. The median is the “middle value” of a sorted list of numbers. Half of the numbers in the list are smaller and the other half of the numbers are larger than the median.

Weighted: Calculates a weighted mean value, i.e. a mean value to which some values contribute more than others. Outliers can be considered to a lesser extent for averaging.

Apply redundancies correction after averaging: This function is activated by default and useful if a test chart contains redundant patches, since these could still be different in the averaged file. This function saves you the extra step of using the Redundancies tool after averaging.

Procedure

  1. Load the measured values you want to average and select them in the Data Sets window. Make sure that the number of color patches is identical in all selected measurement files, otherwise you cannot use the Averaging function directly.
  2. Select the tool Averaging from the sidebar.
  3. The methods described above are available for averaging. The Auto method is selected by default and recommended for most cases.
  4. Apply redundancies correction after averaging. This function is enabled by default and saves you the extra step of applying the Redundancies tool after averaging.
  5. After clicking Start, the selected measurement files are merged to an averaged file (Average.txt).
  6. The averaged file can be saved as a new file using File/Save As.

ColorAnt | ICC Transformation

ICC Transformation

Use ICC device and DeviceLink profiles to test impact on data.

Using ICC Transformation

Overview

The ICC Transformation tool applies ICC device profiles and DeviceLinks to reference data (device values such as CMYK or device independent values such as Lab) to synthetically check the effect of ICC color conversions.

Only ICC profiles that match the selected data (either DCS data only, CIE data only, or both) are displayed in the drop-down menus. For example, if a CMYK reference data set (DCS) has been loaded, only CMYK profiles or CMYK DeviceLinks are displayed. This prevents unnecessary error messages due to inappropriate profile selection.

Convert to Lab: If activated, the resulting color space of the transformation is Lab. If deactivated, the resulting color space is that of the last selected profile in the dialog.

Color space changes: Shows all color space conversions including intermediate steps which are displayed in parentheses. This provides useful insight of how the conversion will be applied and what the resulting color space will be.

The available functions and the profiles available in the drop-down menus depend on the selected data. The following three use cases apply:

ICC Transformation with CIE only data

Typical use cases are converting spot colors with profiles to check the accuracy of a pure ICC conversion, or in general to check how Lab values are converted with profiles.

Convert from Lab: For CIE only data this checkbox is activated by default.

Rendering intent: Select the rendering intent for the first conversion step (from Lab to the first profile) from the top drop-down menu on the right.

First profile drop-down menu: Select the first profile for the transformation from the first drop-down menu. It contains Printer, Monitor and Abstract profiles.

Second profile drop-down menu: Select the second profile. The drop-down menu contains all Output, Monitor, Abstract and DeviceLink profiles fitting the color space of the first profile.

Resulting color space of the transformation

If the last selected profile is a device profile, the result is in the color space of the profile.

If Convert to Lab is selected, the result is Lab and the rendering intent used to convert to Lab is the one from the last selected profile.
Note: In case you wish to evaluate the accuracy of a profile including paper white simulation, the absolute colorimetric rendering intent must be used when converting to Lab.

If the second profile is a DeviceLink profile, the result is in the target color space of the DeviceLink profile.

The checkbox Convert to Lab is only available if the target profile of the DeviceLink is available. If the target profile is available and the checkbox Convert to Lab is enabled a conversion from the DeviceLink color space will be done with that target profile to Lab using the rendering intent selected next to the selected DeviceLink.

ICC Transformation with DCS only data

Typical use cases are: Creating virtual measurement data for profiles without embedded measurement data or checking the conversion of DeviceLink profiles such as the accuracy check of SaveInk profiles which is described at the bottom of this page.

Convert from Lab: For DCS only data this checkbox is deactivated by default.

First profile drop-down menu: Select the first profile for the transformation from the drop-down menu. It contains all Input, Monitor and Output profiles and all DeviceLink profiles with the corresponding color space of the loaded data. 

If only one profile (the first profile) is selected and that profile is an Input, Monitor or Output profile, the conversion is always done to Lab, hence the checkbox Convert to Lab is enabled by default and can not be disabled.

If the first selected profile is a DeviceLink profile and the checkbox Convert to Lab is not enabled, the resulting color space is the device color space of the DeviceLink. If the checkbox Convert to Lab is not grayed out then the target profile used in the DLP is available on the system. If the checkbox Convert to Lab is enabled a conversion from the DeviceLink color space will be done with that target profile to Lab using the rendering intent selected next to the selected DeviceLink.

When enabling the checkbox in front of the second profile drop-down menu, you may select:

  1. Output, Monitor or Abstract profiles in case the first selected profile was a printer profile,
    or, in case the first selected profile was a DeviceLink profile,
  2. all Output profiles with the corresponding target color space of the first profile and all DeviceLink profiles with the corresponding source color space of the first profile target color space.

Note: If the second profile is a DeviceLink profile, the checkbox Convert to Lab is enabled only if the target profile is available on the system, otherwise it is disabled. If the target profile is available, and the checkbox Convert to Lab is enabled, a conversion from the DeviceLink color space will be done with that target profile to Lab using the rendering intent selected behind the selected DLP.

If the second profile is a DeviceLink and the checkbox Convert to Lab is not enabled, the resulting color space is DCS.

ICC Transformation of data with DCS and CIE

This is probably the most often occurrence that loaded data has both DCS and CIE data. In this case it is in the user’s decision which of the two options described above shall be applied. If the user disables the first checkbox at Convert from Lab, then the DCS data will be used as a starting point and the description for use case 2 applies. If the user enables the first checkbox at Convert from Lab, then the conversion uses the Lab data as a starting point and the description of the first use case applies.

Checking the accuracy of a SaveInk DeviceLink profile

Procedure

  1. Open the same large test chart layout (e.g. IT8.7-4) twice via File/Open Predefined. The CMYK reference values of this test chart are opened.
  2. Select the first opened reference file and open ICC Transformation.
  3. Apply the original printer profile which was used to create the Savelnk profile in the first profile drop-down menu. Convert the reference file to Lab with the Absolute Colorimetric rendering intent by clicking on Start.
  4. Now select the second reference file and open ICC Transformation. In the first profile drop-down menu select the SaveInk-DeviceLink profile and in the second profile drop-down menu select the same printer profile as in step 2. To Convert to Lab use the Absolute Colorimetric rendering intent behind that profile.
  5. The objective of a SaveInk conversion is to visually keep the consistency of the original printer profile, despite modified (reduced) CMYK values to achieve the lowest possible color deviations. Compare both files in the Color Comparison window. The Graph tab displays the average deviation (Average) is 0.1 DeltaE and the maximum deviation (Maximum) is 1.9 DeltaE in this example. 90% of the deviations (90% percentile) do not diverge by more than 0.2 DeltaE.

ColorAnt | Link

Link

Combine sets of measurement data

Link multiple data sets

Three options are available in the Link tool. The options are grouped with radio buttons that are enabled and disabled according to the chosen files.

Link data with same color space: combine several separate measurement data files with the same color space to one large data set. For example, combine three CMYK data sets to one large CMYK measurement data set.

Combine CIE with DCS: combines two separate files to one data set. This option is enabled if one file contains the reference data (DCS – Device Color Space) and the other file contains the measurement data (CIE) and both have the same number of patches.

Merge by Channel Name: links multicolor measurement data from different sources, e.g. separate Esko Equinox measurement data files. Combines separate measurement data files with different channel names to a new file. For example if you combine a four color CMYK file with a CMYK+Orange data set the resulting file will be a 5 color data set CMYK+Orange with additional CMYK data.

Note: Combining multicolor data requires a ColorAnt L license.

Tip: ColorLogic suggests averaging the redundant color patches with the Redundancies tool after using the Link tool. Delete redundant color patches by activating the Remove Duplicate Patches checkbox next to the averaging method. The methods for averaging redundant color patches are the same as in the Averaging tool.

View the channel re-ordering options in Edit Primaries.

How to link multiple Multicolor data sets: