ColorAnt | Color Editor


Color Editor
The Color Editor tool covers several applications:
- Best possible conversion of colors (usually spot colors) using ICC profiles.
- Saving spot colors converted with Color Editor in various color formats for use in other applications.
- Manually changing color names.
- Manually changing Lab values and device values assigned to a color patch.
- Adding or removing color patches.
Overview of the Color Editor
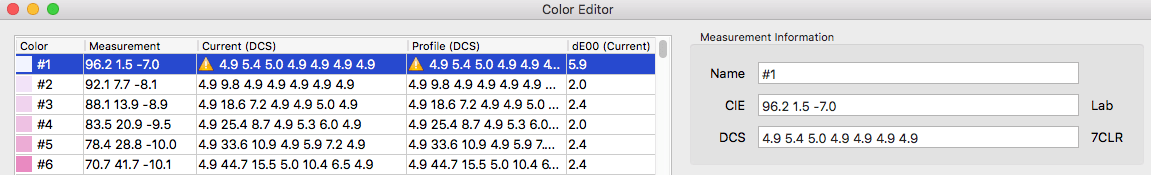
On the left side is a table with the colors of the loaded measurement file. It contains the following information:
- Color: Name of the color
- Measurement: Measured color values in Lab (spectral values are retained but shown as Lab)
- Current (DCS): Specifies the current device values. Displays the device values after applying the settings and functions on the right side.
- Profile (DCS): Displays the device values resulting from a conversion using the selected profile on the right-hand side.
- dE00 (Current): Displays the absolute colorimetric DeltaE 2000 values, which result from the measured Lab values and the current device values.
Single, multiple or all color values can be selected in the table and then edited with the tools on the right. The color table can be sorted by Color or dE00 (Current) by clicking on the column headings.
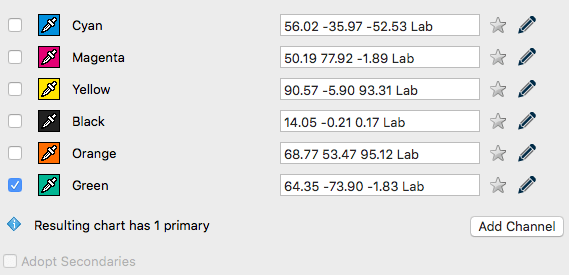
Below the table are two buttons to Add or Delete patches as well as the Invert Selection button.
Invert Selection: Provides a quick and easy way to reduce a large number of displayed colors of a large data set to only a few colors. Simply select the desired color patches, click Invert Selection followed by the Delete button. Now you are working on your individual color selection.
Search: Helps to find and edit specific colors of large data sets. Type in the name of the desired color and the list will show only colors with those name components.
Tip: Combine the Search with Invert Selection
If, for example, you would like to edit all colors with the name component ‘Red’ of a Pantone library as a small list, enter ‘Red’ in the Search.
Select the colors found, then delete the search term and click on Invert Selection.
By pressing the Delete button, only the colors with the name component ‘Red’ remain in the list. All others are removed.
Spot Color Report: Generates a PDF report that can be used to check the conversion of spot colors before actually printing.
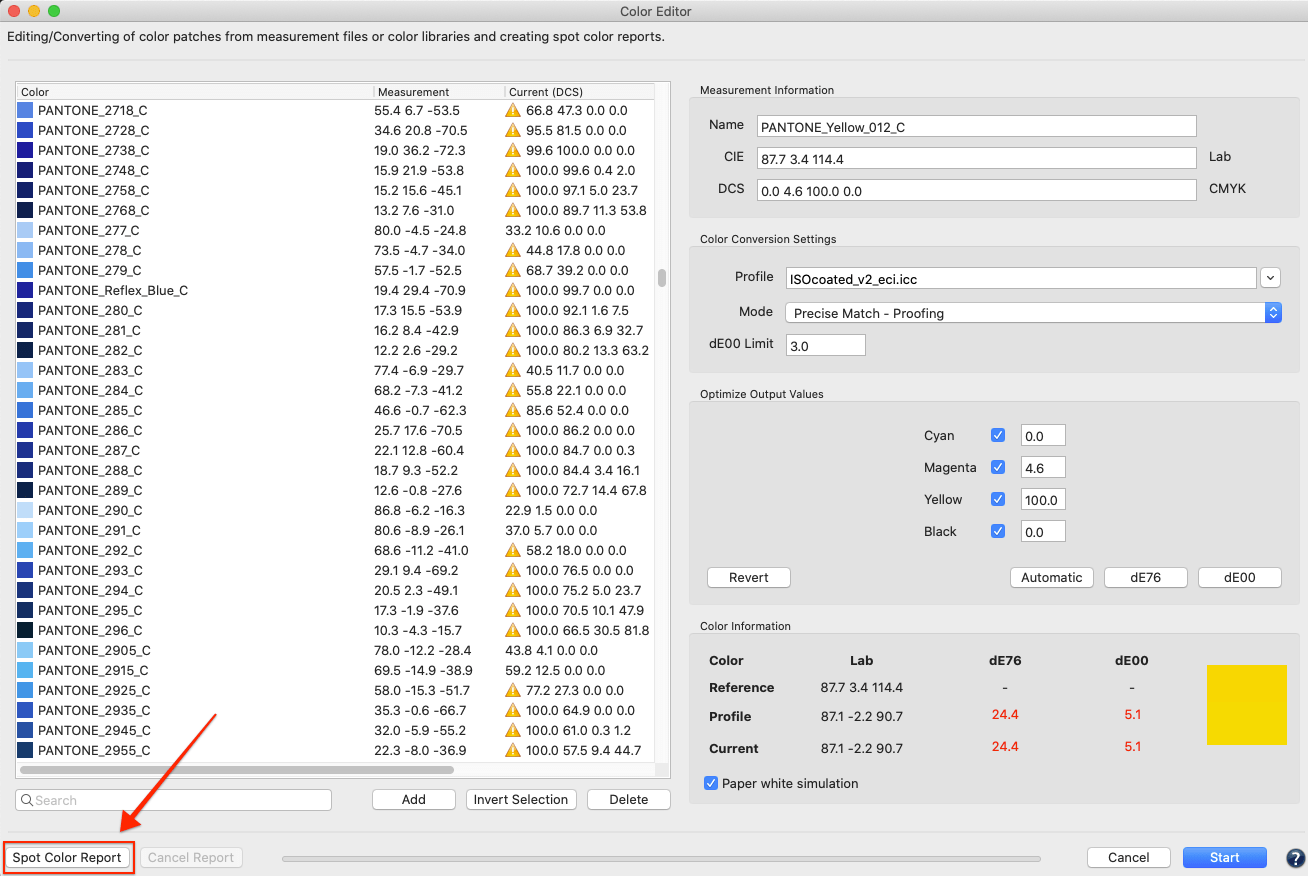
The spot color report shows the results achieved by a spot color conversion in relation to deltaE00, deltaE76, and the separation into process colors. This allows the accuracy of spot color conversions to be checked before processing or printing, and to determine in advance how spot colors (e.g., Pantone® or HKS and other colors) of specific PDF and image files are converted.
A spot color library with multiple spot colors such as Pantone, HKS or other colors can be color converted with a target ICC profile to check for the resulting process color breakdowns (DCS). The report provides the color name for each spot color, the process color breakdowns, the expected deltaE2000 and deltaE76 values, and an overall evaluation in terms of average and maximum deltaEs. It also includes the median and how many colors are reproduced within a tolerance of 1 and 2.5 dE00 as well as within the user-defined dE00 limit.
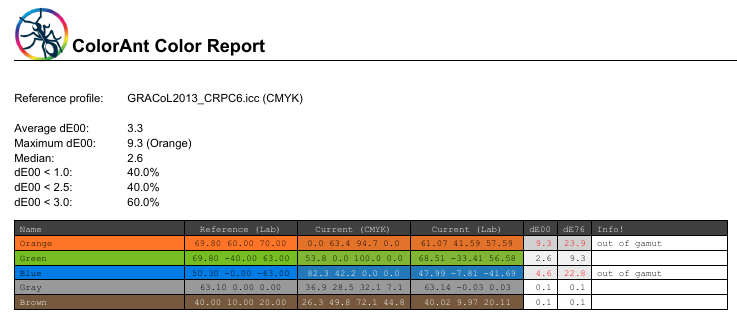
The report also contains an information column that shows, among other things, whether a color is out of gamut.
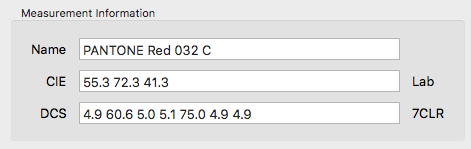
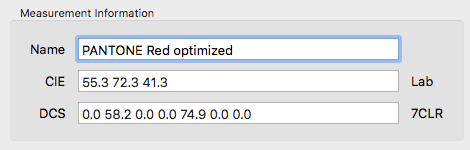
Measurement Information
Shows the Name, the measured Lab value (CIE) and the current device value (DCS) including the color space for the selected color field.
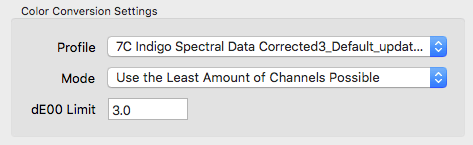
Color Conversion Settings
After selecting an ICC Profile, first the DCS values are calculated using the Absolute Colorimetric rendering intent.
However, these are not always the best possible color values, neither with regard to the smallest DeltaE nor to printability.
Therefore, various optimization modes are available in the Color Conversion Settings, which can be applied to the colors selected on the left side of the table.
It is also possible to apply different modes and colors to individual colors.
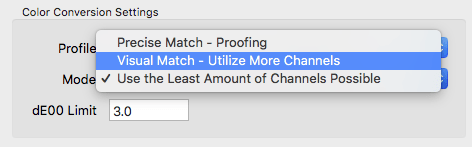
Define the Profile and the Mode for the conversion of the measured values. Six modes are available for the color conversion:
- Precise Match – Proofing
Spot colors are reproduced as accurately as possible on a proof printer. This method is not suitable for production as it may use all process colors for spot color simulation to achieve the best result (based on DeltaE 2000). The full tone is calculated with the aim of achieving the smallest possible DeltaE 2000 value. No channel reduction or print optimization is applied. - Visual Match – Utilize More Channels
Produces visually the best possible conversion with high color accuracy and with excellent printing properties. Full tones of spot colors are converted with as few channels as possible and still remain colorimetrically accurate. This method is suitable for digital printing, large format inkjet printing or offset printing with a fine screen ruling and good register accuracy. - Use the least Amount of Channels possible
A good method to convert full tones of spot colors with a minimum number of channels and still get colorimetric accurate results. Choose this method for packaging printing where pure colors are desired. One or two-color combinations are also included in the search for the best possible color combination. - Use one Output Channel only
Useful for print packaging production. The spot colors used for text and bar codes will be converted using a maximum of one process color. - Use a Maximum of two Channels
Uses one or two output channels. Best for one or two process colors providing the best colorimetric match selected for each spot color automatically. The results are very clean separations that are easily printed, but not necessarily very exact in colorimetric terms. It is recommended to only use this function for individual, manually created spot colors. - Use a Maximum of three Channels
Uses one to three output channels. Similar to the calculation method Use the least Amount of Channels possible. No more than a maximum of three channels should be used. Choose this method for packaging printing, where the purest possible colors are to be produced and not more than three process colors for spot color conversion must be used. Single-color and two-color combinations are also included in the search for the best color combination.
dE00 Limit: Colors exceeding the set threshold are marked with a warning symbol.
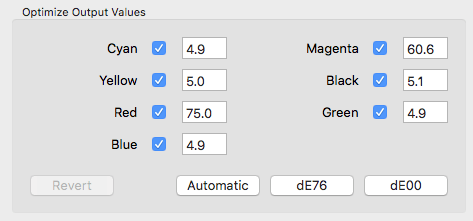
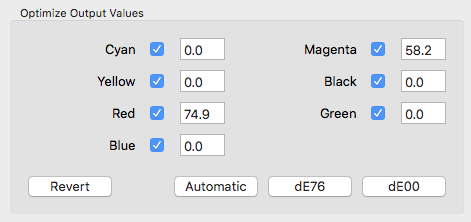
Optimize Output Values
Displays the current device values for the selected ICC profile.
By clicking on dE76 or dE00 the deltaE can be minimized for each color.
Automatic: Uses the selected ColorLogic calculation mode, typically reducing the number of channels for better printability.
Note: By deactivating the checkboxes for the color channels, the values displayed in the number fields are fixed (for example 0% or 100%) so that they are not changed when applying dE76 or dE00. However, this does not apply to Automatic, here, all channels are always taken into account.
Revert: Undoes all changes and reverts back to the original DCS values initially calculated using the selected ICC Profile.
Color Information
Displays various information about the selected color:
Reference: Measured Lab value of the color
Profile: Shows the color value calculated with the process colors of the target profile
Current: Optimized color value of the process colors
dE76: Expected color difference in DeltaE 76
dE00: Expected color difference in DeltaE 2000
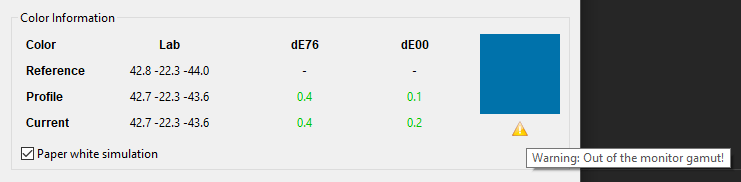
Paper white simulation: Considers the coloration of the substrate for the target color space
Note: It is recommended to activate the Paper white simulation.
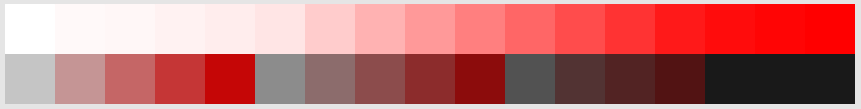
Divided color preview: The divided color preview shows how the original color (upper bar), the non-optimized color by means of the profile (left lower square), and the optimized color (right lower square) would look like when printing. The color preview is displayed in true colors on a calibrated and profiled monitor.
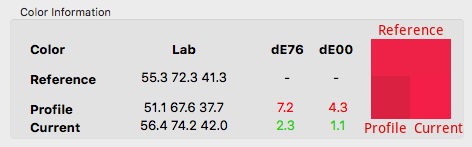
Comparison of original color (Reference), non-edited color (Profile) and edited color (Current)
Note: A warning message is displayed below the color preview when one of the three colors is out of the monitor’s gamut.
After editing the measured values, a file with the optimized device and/or measured values is created by clicking on Start.
Note: The Color Editor tool is grayed out if the file loaded under Data Sets does not contain any measured values. Once a single measurement file has been selected, it can be opened in the Color Editor (multiple files cannot be opened simultaneously).
Color Editor Use Cases
Example: Best possible conversion of (spot) colors
Measurement data from spot colors loaded into ColorAnt can be converted into any color space using the Color Editor and ICC profiles. All color spaces including RGB, CMYK and Multicolor are supported.
Note: The Conversion of Multicolor profiles requires an L license.
To convert a spot color to RGB, CMYK or Multicolor, follow these steps:
- Load the measurement data file including individual full tone spot colors (for example a spot color library as CxF file) under Data Sets in ColorAnt, select the file and then click Color Editor.
- Under Color Conversion Settings, select the desired ICC Profile from the drop-down menu.
- The table on the left side fills with the device values. Initially, the device values are identical for Current (DCS) and Profile (DCS), since no optimizations have yet been made.
- Select the color you would like to optimize from the table and a Mode under Color Conversion Settings.
The calculation mode specifies how ZePrA should convert one or more spot colors to the target color space. - Choose one of the three modes described above. Under dE00 Limit, enter the threshold value in DeltaE 2000 from which colors in the table are to be marked with a warning symbol.
- The control panel Optimize Output Values shows the device values (Current DCS) calculated with the selected ICC profile. The calculation is always absolute colorimetric.

- Now click on Automatic to convert the colors using the selected calculation mode. Alternatively, perform the calculation according to DeltaE76 (dE76) or DeltaE 2000 (dE00). However, these two methods do not include ColorLogics high-quality calculation modes. The device values are displayed immediately after application of the calculation.
By clicking on Revert the changes can be undone. - The Color Information panel shows the measured Lab value of the color under Reference, the color value calculated with the process colors of the target profile under Profile and the optimized color value under Current. Additionally, the expected color difference is displayed in dE76 (DeltaE 76) and dE00 (DeltaE 2000). Activating the checkbox Paper white simulation takes the coloration of the substrate for the target color space into account. The calculation of the Lab values for Current and the color distance (DeltaE) are performed accordingly.
Note: It is recommended to activate the Paper white simulation.
Divided color preview: The divided color preview shows how the original color (upper bar), the non-optimized color by means of the profile (left lower square) and the optimized color (right lower square) would look like when printing. The color preview is displayed in true colors on a calibrated and profiled monitor.Comparison of original color (Reference), non-edited color (Profile) and edited color (Current)
- If you want to make fine adjustments, manually optimize the percentages in the Optimize Output Values control panel and see the effects directly under Color Information.
- If you are satisfied with the optimization, continue optimizing more colors. Optimized colors are updated directly in the table. With a click on Start the editing is completed using the device values shown under Current (DCS) and the dialog will close. Please note that colors that have not been optimized will only be converted using the normal profile conversion and may therefore not achieve the best possible result.
Specifics
- If you would like to optimize several or all colors in the table at once, select the desired colors and click on the desired calculation (Automatic, dE76 or dE00).
- If two or more colors are selected, device and color values are grayed out in the panels Optimize Output Values and Color Information.
- If a file previously optimized with an ICC profile in the Color Editor is re-opened in Color Editor, the previously used ICC profile is preselected automatically.
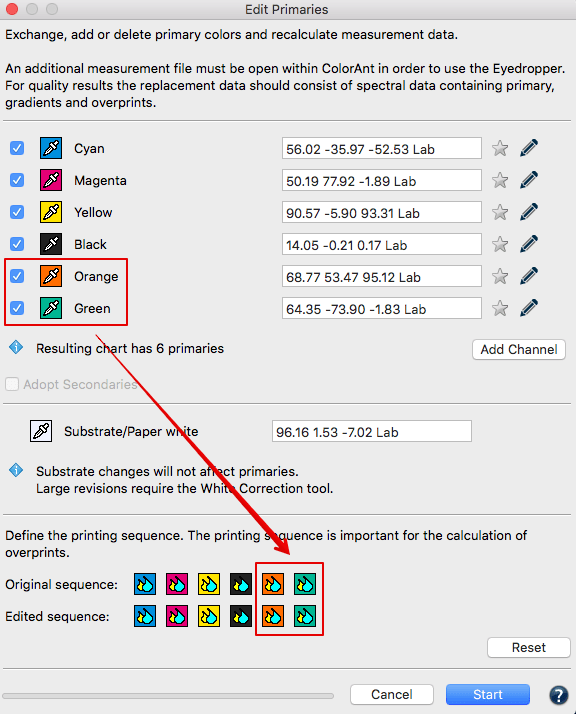
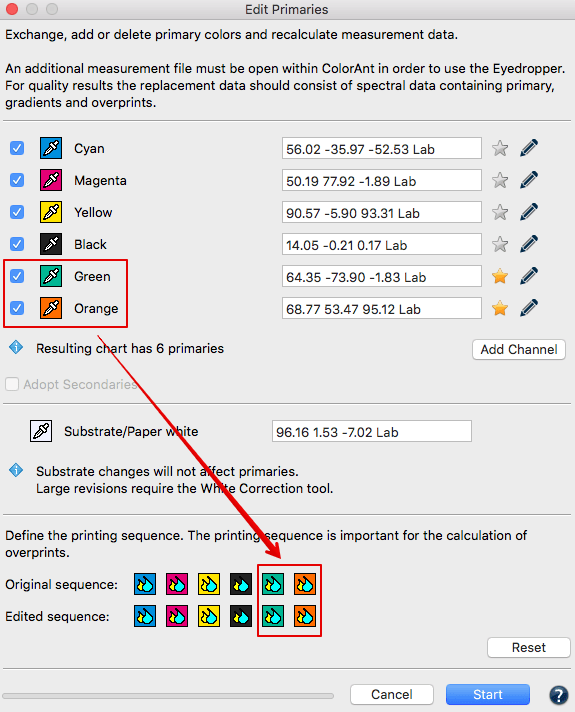
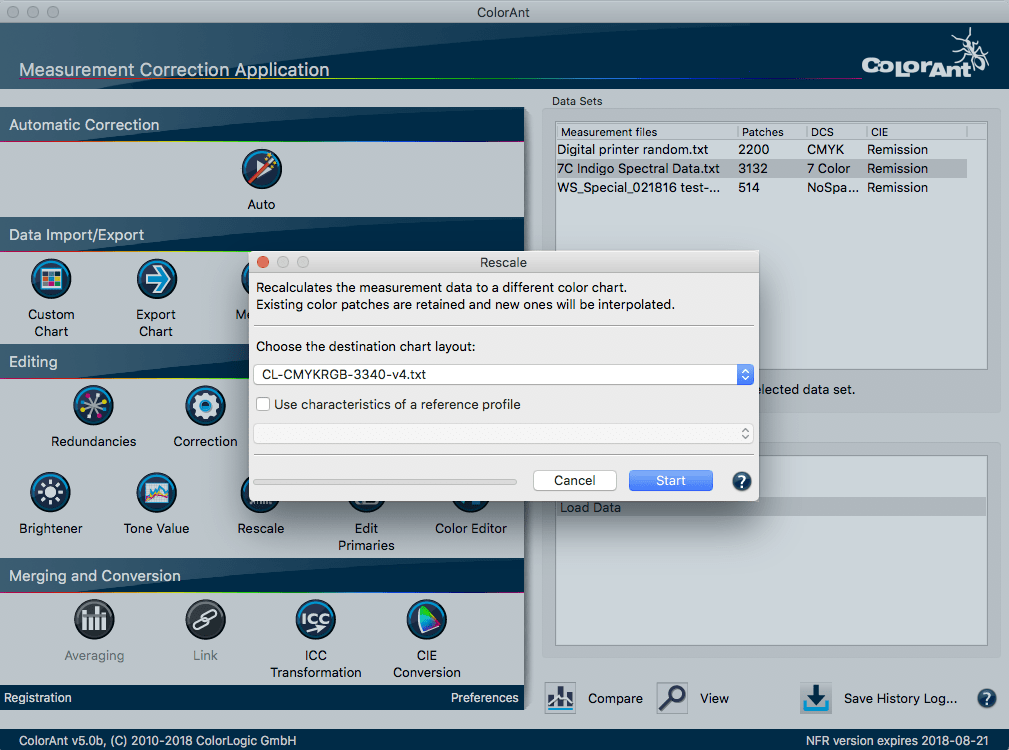
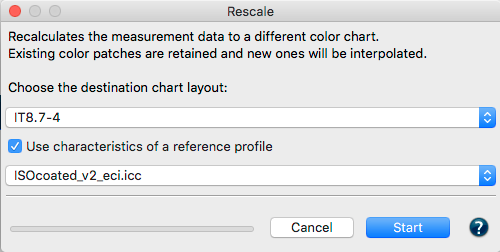
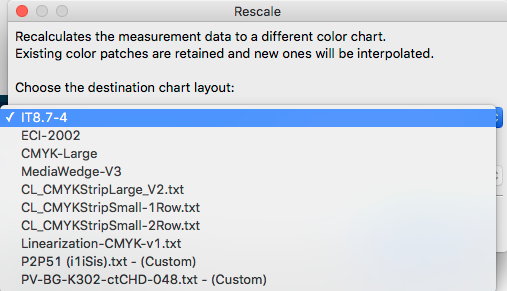
- If you change the ICC profile, typically, the device values have to be recalculated. To do so, activate the checkbox Recalculate DCS values and confirm with OK.
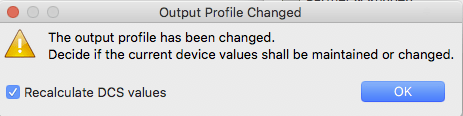
Confirm recalculation of the DCS values
Example: Saving color-converted spot colors to other formats
- CxF or CxF/X-4 for use in many modern applications
- Adobe Swatch Exchange (ASE) for use in Adobe Illustrator and InDesign
- ACO for use in Adobe Photoshop
- ICC Named Color Profiles for use in programs that support this special ICC format.
The complete list of supported formats can be found here.
Note: Spot colors converted with Color Editor contain the original color values (Lab or spectral values) and the optimized device values for the selected ICC profile.
Example: Manual Editing
The Color Editor also allows to manually change color patch names or color names, to manually change the measurements and device values associated with a color patch, and add or remove individual color patches. Make the appropriate changes in the topmost control panel Measurement Information.
Under Name change the name of (spot) colors or color patches of test charts.
Under CIE edit the measured values of the color, under DCS edit device values (if present). Typically, DCS values are not available in a pure spot color measurement file.
Using the buttons below the table (Add, Delete), selected colors can be removed or one or more colors can be added. Added colors are placed at the end of the table. A default name and a medium gray are preselected, which can be changed under Measurement Information as required.
Specifics
- Measurements of profiling test charts often have no name designations. For such measurements, the Color Editor automatically adds an identifier, for example #1 for the first patch.
- Spectral measurement data can also be edited in the Color Editor. They are then displayed as Lab values with D50/2 degree standard observers. In the final file, however, the spectral values are preserved.
- If the CIE values of spectral measurements are edited as Lab values, the spectral properties of the color are retained.
- We recommend not to change or optimize DCS values in test charts if the data is used for profiling purposes.
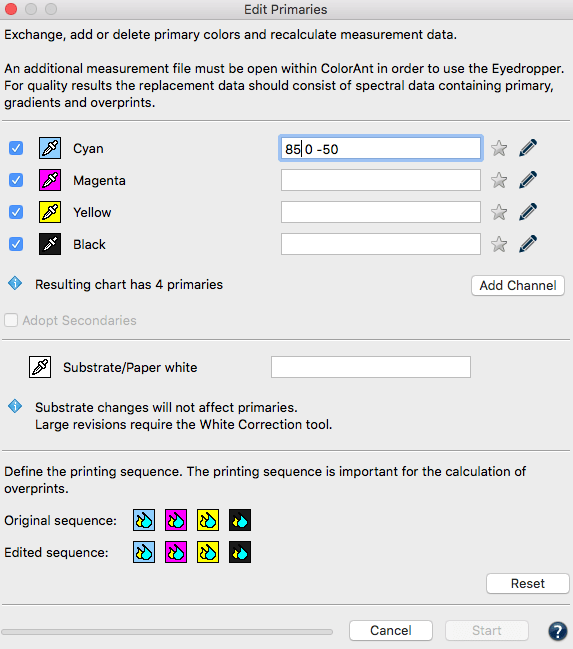
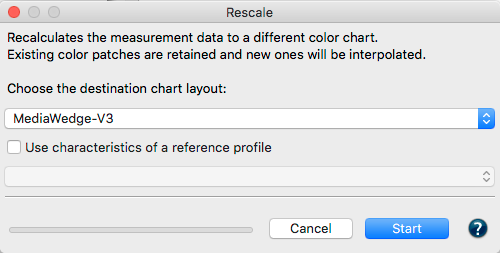
- When selecting an ICC profile, typically, the device values don’t have to be recalculated. Deactivate the checkbox Recalculate DCS values and confirm with OK.
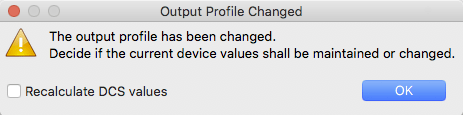
Recalculating colors without changing the DCS values